

Callistemon
553 投稿

Callistemon
報告
ユーザーをブロック
Investor/Trader/Architect
153 フォロー
4.1K+ フォロワー
7.4K+ いいね
投稿
すべて
引用
動画
·
--
ブリッシュ
NFPが物語を変えた。だが、私の仮説は違う。
Binance Squareを1か月離れていた。
市場は動いた。
でも、私の仮説は動かなかった。
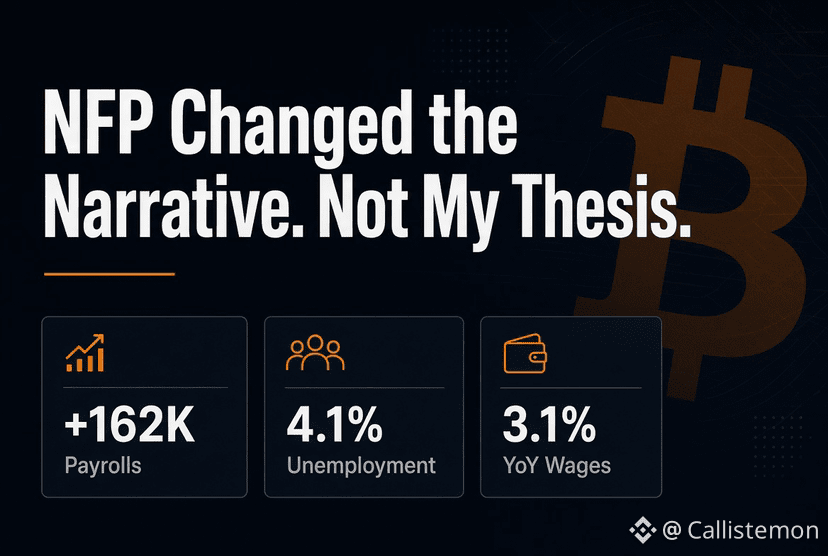
8月の雇用者数は+162K。失業率は4.1%で横ばい。賃金の伸びは前年比3.1%で抑制されたままだった。
たしかに、この結果はFRBにとってタカ派的だ。
だが、景気が崩れたとは見ていない。
労働市場はまだ持ちこたえており、賃金圧力も管理可能な範囲にある。ここが重要だ。
強気シナリオに必要なのは、すべてのマクロ指標がハト派寄りになることではない。
必要なのは、最終的にFRBが緩和に動けるだけのインフレ環境を残しつつ、景気後退を避けられる程度に経済が強いことだ。
現時点では:
成長は底堅い。
労働市場も底堅い。
流動性が、なお最大の論点だ。
見方は変わらない。強気だ。
問題は、景気サイクルが続くかどうかではない。
次の拡大局面までに、市場がどれだけのマクロ圧力を吸収できるかだ。
あなたはどう見る?
強気サイクル、それとも後期サイクルの罠?
#NFP #macro $BTC
{future}(BTCUSDT)
NFPが物語を変えた。だが、私の仮説は違う。
Binance Squareを1か月離れていた。
市場は動いた。
でも、私の仮説は動かなかった。
8月の雇用者数は+162K。失業率は4.1%で横ばい。賃金の伸びは前年比3.1%で抑制されたままだった。
たしかに、この結果はFRBにとってタカ派的だ。
だが、景気が崩れたとは見ていない。
労働市場はまだ持ちこたえており、賃金圧力も管理可能な範囲にある。ここが重要だ。
強気シナリオに必要なのは、すべてのマクロ指標がハト派寄りになることではない。
必要なのは、最終的にFRBが緩和に動けるだけのインフレ環境を残しつつ、景気後退を避けられる程度に経済が強いことだ。
現時点では:
成長は底堅い。
労働市場も底堅い。
流動性が、なお最大の論点だ。
見方は変わらない。強気だ。
問題は、景気サイクルが続くかどうかではない。
次の拡大局面までに、市場がどれだけのマクロ圧力を吸収できるかだ。
あなたはどう見る?
強気サイクル、それとも後期サイクルの罠?
#NFP #macro $BTC
Binance Squareを1か月離れていた。
市場は動いた。
でも、私の仮説は動かなかった。
8月の雇用者数は+162K。失業率は4.1%で横ばい。賃金の伸びは前年比3.1%で抑制されたままだった。
たしかに、この結果はFRBにとってタカ派的だ。
だが、景気が崩れたとは見ていない。
労働市場はまだ持ちこたえており、賃金圧力も管理可能な範囲にある。ここが重要だ。
強気シナリオに必要なのは、すべてのマクロ指標がハト派寄りになることではない。
必要なのは、最終的にFRBが緩和に動けるだけのインフレ環境を残しつつ、景気後退を避けられる程度に経済が強いことだ。
現時点では:
成長は底堅い。
労働市場も底堅い。
流動性が、なお最大の論点だ。
見方は変わらない。強気だ。
問題は、景気サイクルが続くかどうかではない。
次の拡大局面までに、市場がどれだけのマクロ圧力を吸収できるかだ。
あなたはどう見る?
強気サイクル、それとも後期サイクルの罠?
#NFP #macro $BTC
1
115
·
--
ブリッシュ
ONDO セットアップが面白くなってきた
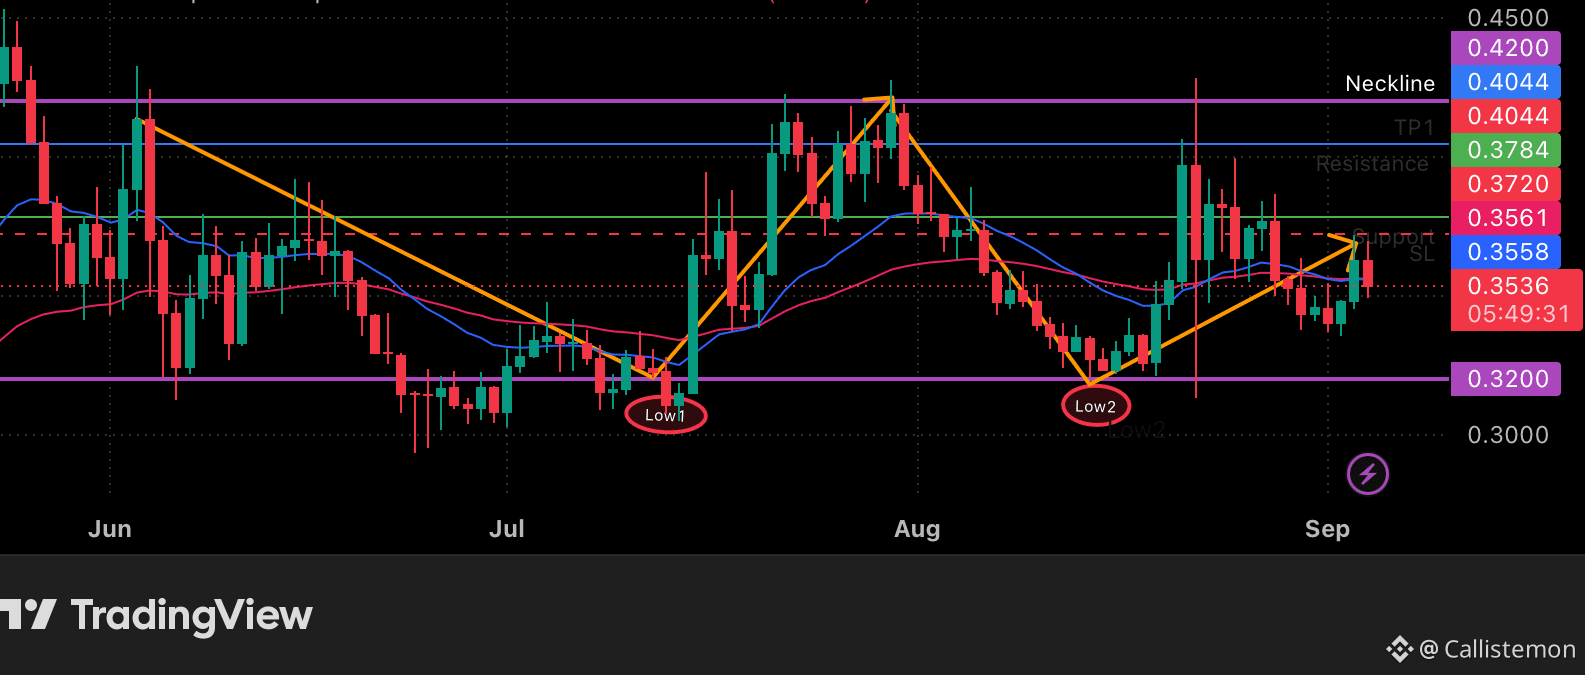
$ONDO は日足チャートでダブルボトムの形成を狙っている。
最初の安値は約 $0.32 付近で形成された。
2つ目の安値も同じゾーンを維持した。
現在の価格は約 $0.35 付近で、主要な抵抗は $0.3784、ネックラインは $0.4044 にある。
構造はシンプルだ:
$0.32: ダブルボトムのサポート
$0.355–0.378: 現在の持ち合い / レジスタンスゾーン
$0.4044: ネックライン
$0.4200: 最初の上値目標
重要なのは、パターンそのものではない。
それは確認だ。
日足で $0.4044 を上抜けて引ければ、この構造は完成し、ONDO は蓄積局面から拡張局面へ移行する可能性がある。
それまでは、まだセットアップにすぎない。
あなたならブレイクアウトで取引する? それともネックラインの再テストを待つ?
#ONDO #crypto
{future}(ONDOUSDT)
ONDO セットアップが面白くなってきた
$ONDO は日足チャートでダブルボトムの形成を狙っている。
最初の安値は約 $0.32 付近で形成された。
2つ目の安値も同じゾーンを維持した。
現在の価格は約 $0.35 付近で、主要な抵抗は $0.3784、ネックラインは $0.4044 にある。
構造はシンプルだ:
$0.32: ダブルボトムのサポート
$0.355–0.378: 現在の持ち合い / レジスタンスゾーン
$0.4044: ネックライン
$0.4200: 最初の上値目標
重要なのは、パターンそのものではない。
それは確認だ。
日足で $0.4044 を上抜けて引ければ、この構造は完成し、ONDO は蓄積局面から拡張局面へ移行する可能性がある。
それまでは、まだセットアップにすぎない。
あなたならブレイクアウトで取引する? それともネックラインの再テストを待つ?
#ONDO #crypto
$ONDO は日足チャートでダブルボトムの形成を狙っている。
最初の安値は約 $0.32 付近で形成された。
2つ目の安値も同じゾーンを維持した。
現在の価格は約 $0.35 付近で、主要な抵抗は $0.3784、ネックラインは $0.4044 にある。
構造はシンプルだ:
$0.32: ダブルボトムのサポート
$0.355–0.378: 現在の持ち合い / レジスタンスゾーン
$0.4044: ネックライン
$0.4200: 最初の上値目標
重要なのは、パターンそのものではない。
それは確認だ。
日足で $0.4044 を上抜けて引ければ、この構造は完成し、ONDO は蓄積局面から拡張局面へ移行する可能性がある。
それまでは、まだセットアップにすぎない。
あなたならブレイクアウトで取引する? それともネックラインの再テストを待つ?
#ONDO #crypto
1
249
·
--
ブリッシュ
LDO/USDT 何かが形成されつつある
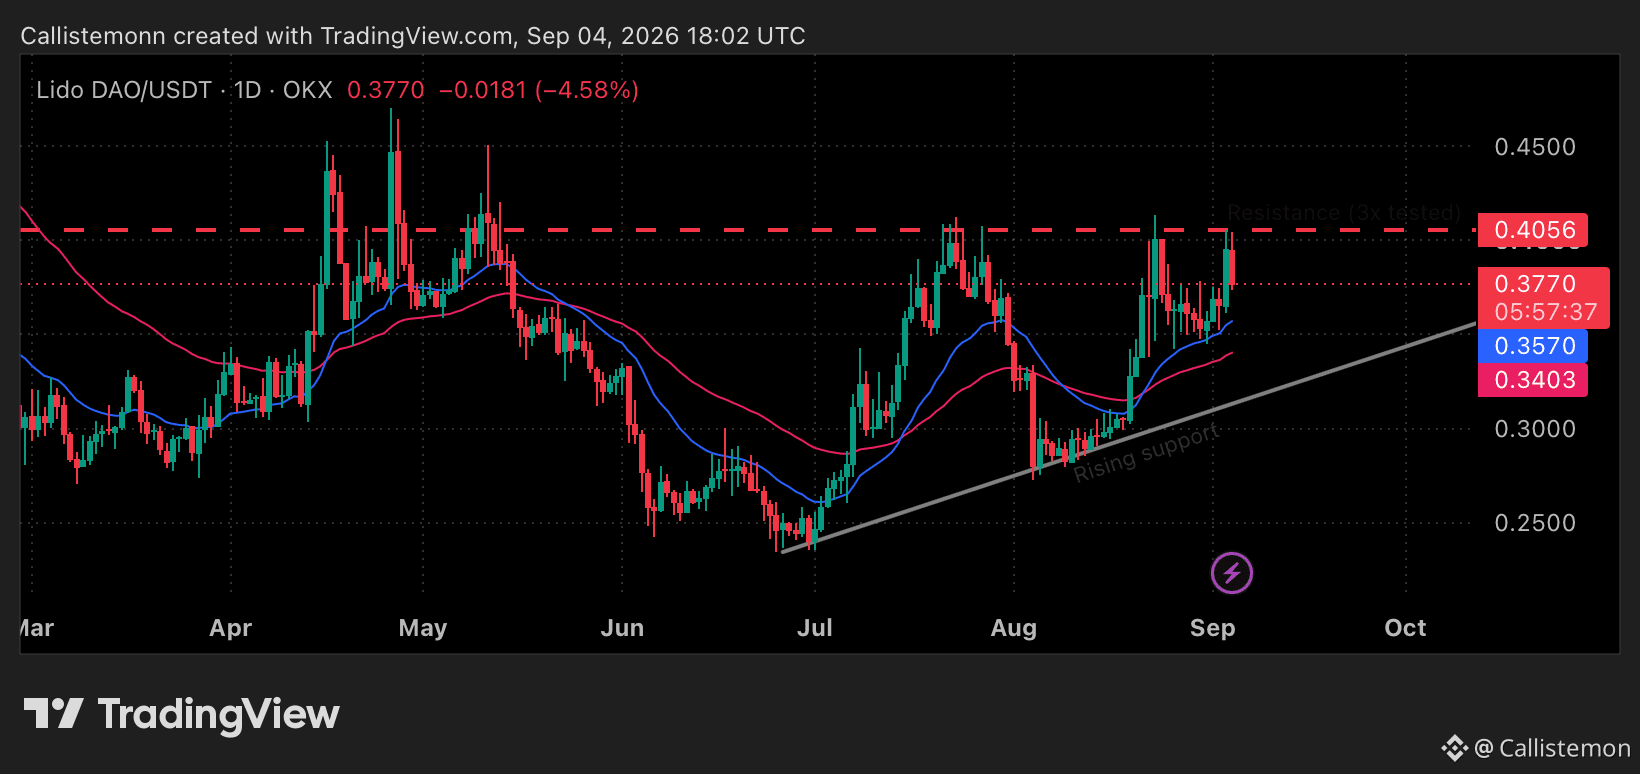
$LDO is は再び $0.4056 に戻ってきた。
このレジスタンスはすでに3回、価格を跳ね返している。
だが、私が注目している重要な点がひとつある:
大きな反落のたびに、より高い安値が形成されている。
今、価格は以下の上に位置している:
20日移動平均線: $0.3570
50日移動平均線: $0.3403
上昇トレンドライン
それが興味深い圧縮を生み出している:
レジスタンスは横ばい。
サポートは上昇し続ける。
もし $0.4056 を強い日足終値で上抜ければ、構造は変わる。
もし再び反落するなら、$0.3570 → $0.3403 が注目すべき領域になる。
では、最初に何が起こるのか?
4回目の反落か、それともブレイクアウトか?
私はヒゲではなく、終値を見ている。
#ldo #Crypto
{future}(LDOUSDT)
LDO/USDT 何かが形成されつつある
$LDO is は再び $0.4056 に戻ってきた。
このレジスタンスはすでに3回、価格を跳ね返している。
だが、私が注目している重要な点がひとつある:
大きな反落のたびに、より高い安値が形成されている。
今、価格は以下の上に位置している:
20日移動平均線: $0.3570
50日移動平均線: $0.3403
上昇トレンドライン
それが興味深い圧縮を生み出している:
レジスタンスは横ばい。
サポートは上昇し続ける。
もし $0.4056 を強い日足終値で上抜ければ、構造は変わる。
もし再び反落するなら、$0.3570 → $0.3403 が注目すべき領域になる。
では、最初に何が起こるのか?
4回目の反落か、それともブレイクアウトか?
私はヒゲではなく、終値を見ている。
#ldo #Crypto
$LDO is は再び $0.4056 に戻ってきた。
このレジスタンスはすでに3回、価格を跳ね返している。
だが、私が注目している重要な点がひとつある:
大きな反落のたびに、より高い安値が形成されている。
今、価格は以下の上に位置している:
20日移動平均線: $0.3570
50日移動平均線: $0.3403
上昇トレンドライン
それが興味深い圧縮を生み出している:
レジスタンスは横ばい。
サポートは上昇し続ける。
もし $0.4056 を強い日足終値で上抜ければ、構造は変わる。
もし再び反落するなら、$0.3570 → $0.3403 が注目すべき領域になる。
では、最初に何が起こるのか?
4回目の反落か、それともブレイクアウトか?
私はヒゲではなく、終値を見ている。
#ldo #Crypto
268
·
--
ブリッシュ
📊 $TAO セットアップ:AIカテゴリの強気化
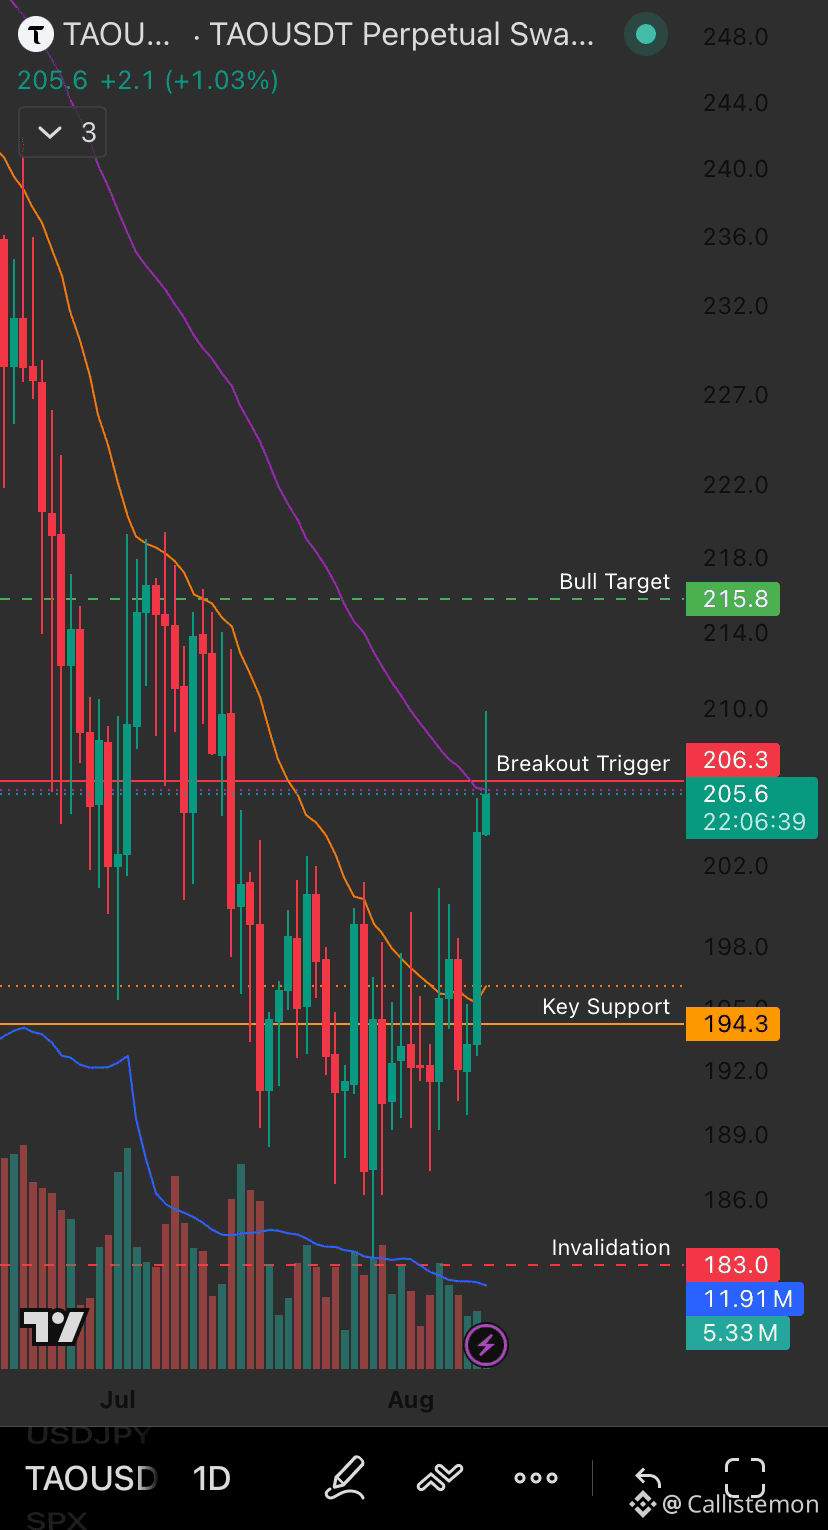
TAOはこの数週間で最も鋭い動きの一つを出しました。$183から$209.9までの単一キャンドルのスパイクが発生し、その後現在は$205.7で調整しています。ちょうど50日EMA($205.8)付近にほぼ一致し、さらに抵抗線$206.3のすぐ下に位置しています。
これは「待つためのセットアップ」ではなく、本当の意思決定ポイントです:
🟢 抵抗:$206.3(出来高で確認されたブレイクがここで起きれば継続を示唆。EMA50は下で既にサポートとして機能しています)
🔴 サポート:$194.3(これを失うと、直近のブレイクアウト構造が崩れてしまいます)
RSIは57.39で、引き締まったモメンタムがありながら過熱ではありません。買い手が主導権を維持していれば、さらに上昇する余地があります。
この点を文脈で捉える価値があります:今週は主要銘柄がまちまちですが、TAOのようなAIナラティブ・トークンは相対的な強さを見せています。仮想通貨の次のローテーションテーマが「AIインフラ」なら、ここで挙げる銘柄の一つがその先頭に立っています。
$206.3がきれいに抜けるか注目しています。Nfa,Dyor こちらにポジションを持っている方いますか? 👇
{future}(TAOUSDT)
📊 $TAO セットアップ:AIカテゴリの強気化
TAOはこの数週間で最も鋭い動きの一つを出しました。$183から$209.9までの単一キャンドルのスパイクが発生し、その後現在は$205.7で調整しています。ちょうど50日EMA($205.8)付近にほぼ一致し、さらに抵抗線$206.3のすぐ下に位置しています。
これは「待つためのセットアップ」ではなく、本当の意思決定ポイントです:
🟢 抵抗:$206.3(出来高で確認されたブレイクがここで起きれば継続を示唆。EMA50は下で既にサポートとして機能しています)
🔴 サポート:$194.3(これを失うと、直近のブレイクアウト構造が崩れてしまいます)
RSIは57.39で、引き締まったモメンタムがありながら過熱ではありません。買い手が主導権を維持していれば、さらに上昇する余地があります。
この点を文脈で捉える価値があります:今週は主要銘柄がまちまちですが、TAOのようなAIナラティブ・トークンは相対的な強さを見せています。仮想通貨の次のローテーションテーマが「AIインフラ」なら、ここで挙げる銘柄の一つがその先頭に立っています。
$206.3がきれいに抜けるか注目しています。Nfa,Dyor こちらにポジションを持っている方いますか? 👇
TAOはこの数週間で最も鋭い動きの一つを出しました。$183から$209.9までの単一キャンドルのスパイクが発生し、その後現在は$205.7で調整しています。ちょうど50日EMA($205.8)付近にほぼ一致し、さらに抵抗線$206.3のすぐ下に位置しています。
これは「待つためのセットアップ」ではなく、本当の意思決定ポイントです:
🟢 抵抗:$206.3(出来高で確認されたブレイクがここで起きれば継続を示唆。EMA50は下で既にサポートとして機能しています)
🔴 サポート:$194.3(これを失うと、直近のブレイクアウト構造が崩れてしまいます)
RSIは57.39で、引き締まったモメンタムがありながら過熱ではありません。買い手が主導権を維持していれば、さらに上昇する余地があります。
この点を文脈で捉える価値があります:今週は主要銘柄がまちまちですが、TAOのようなAIナラティブ・トークンは相対的な強さを見せています。仮想通貨の次のローテーションテーマが「AIインフラ」なら、ここで挙げる銘柄の一つがその先頭に立っています。
$206.3がきれいに抜けるか注目しています。Nfa,Dyor こちらにポジションを持っている方いますか? 👇
3
279
·
--
ブリッシュ
📊 DXYの反転が、ETHローテーションの“本当の物語”だ
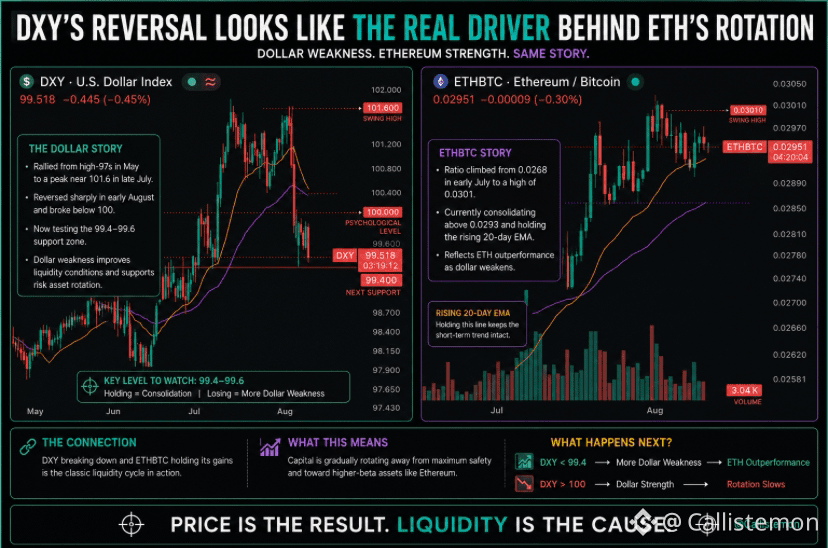
ここ最近、クリプトTwitterはDXYに固執してきましたが、チャートを見るとその注目は当然です。ドル指数は5月から7月下旬にかけて大きく上昇し、約101.6ドル付近でピークを付けたのち、8月初旬に急反転して99.518まで下落しました。そして現在、100ドルという心理的水準のすぐ下にある99.4〜99.6のサポートゾーンを試しに行っています。これは“背景ノイズ”ではなく、実際に取引できる値動きです。
同じ期間でETHBTCと照らし合わせてみると、比率は7月上旬の0.0268から上昇し、0.0301の高値まで到達、その後は現在0.02951で推移しながら、上昇している20日移動平均線(20日MA)を上回る水準を維持しています。ドル安とETHの値動きの良さが同じ期間に現れており、クリプトのトレーダーが注目する典型的な逆相関が、いままさに進行中です。
これは今週初めに私が挙げたローテーションの話とも直結しています。IntesaのQ2の13Fで、BTCへのエクスポージャーからステーキングされたETHへのシフトが示されており、今日のBTC/ETHの値動きも同じ方向性を示しています。
DXYがこのサポートゾーンを維持するのか、それとも下にブレイクするのか注目する価値があります。そうなればETH/BTC比率にとって次の局面(次の足)が決まりそうです。0.#dxy #ETHBTC
📊 DXYの反転が、ETHローテーションの“本当の物語”だ
ここ最近、クリプトTwitterはDXYに固執してきましたが、チャートを見るとその注目は当然です。ドル指数は5月から7月下旬にかけて大きく上昇し、約101.6ドル付近でピークを付けたのち、8月初旬に急反転して99.518まで下落しました。そして現在、100ドルという心理的水準のすぐ下にある99.4〜99.6のサポートゾーンを試しに行っています。これは“背景ノイズ”ではなく、実際に取引できる値動きです。
同じ期間でETHBTCと照らし合わせてみると、比率は7月上旬の0.0268から上昇し、0.0301の高値まで到達、その後は現在0.02951で推移しながら、上昇している20日移動平均線(20日MA)を上回る水準を維持しています。ドル安とETHの値動きの良さが同じ期間に現れており、クリプトのトレーダーが注目する典型的な逆相関が、いままさに進行中です。
これは今週初めに私が挙げたローテーションの話とも直結しています。IntesaのQ2の13Fで、BTCへのエクスポージャーからステーキングされたETHへのシフトが示されており、今日のBTC/ETHの値動きも同じ方向性を示しています。
DXYがこのサポートゾーンを維持するのか、それとも下にブレイクするのか注目する価値があります。そうなればETH/BTC比率にとって次の局面(次の足)が決まりそうです。0.#dxy #ETHBTC
ここ最近、クリプトTwitterはDXYに固執してきましたが、チャートを見るとその注目は当然です。ドル指数は5月から7月下旬にかけて大きく上昇し、約101.6ドル付近でピークを付けたのち、8月初旬に急反転して99.518まで下落しました。そして現在、100ドルという心理的水準のすぐ下にある99.4〜99.6のサポートゾーンを試しに行っています。これは“背景ノイズ”ではなく、実際に取引できる値動きです。
同じ期間でETHBTCと照らし合わせてみると、比率は7月上旬の0.0268から上昇し、0.0301の高値まで到達、その後は現在0.02951で推移しながら、上昇している20日移動平均線(20日MA)を上回る水準を維持しています。ドル安とETHの値動きの良さが同じ期間に現れており、クリプトのトレーダーが注目する典型的な逆相関が、いままさに進行中です。
これは今週初めに私が挙げたローテーションの話とも直結しています。IntesaのQ2の13Fで、BTCへのエクスポージャーからステーキングされたETHへのシフトが示されており、今日のBTC/ETHの値動きも同じ方向性を示しています。
DXYがこのサポートゾーンを維持するのか、それとも下にブレイクするのか注目する価値があります。そうなればETH/BTC比率にとって次の局面(次の足)が決まりそうです。0.#dxy #ETHBTC
2
126
·
--
ブリッシュ
📉 明確さは窓を逃した いったい何が起きたのか
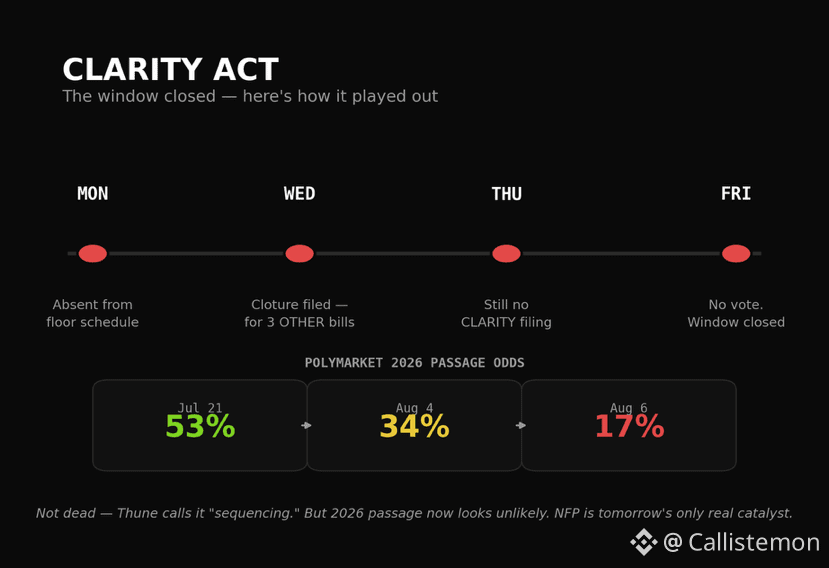
私たちが今週ずっと追ってきたカウントダウンは解決したものの、誰も望んでいた形ではなかった。上院多数党院内総務のトゥーンは水曜日、3つの別の法案についてクローチャー(打ち切り)動議を提出した。対象は「大学スポーツ保護法」、政府の歳出を進めるための手段、そして司法長官の指名である。CLARITYはそのリストに入っていなかった。木曜日の予定にも含まれていない。
市場はもう、この急速な再評価を進めている。2026年の成立に関するPolymarketのオッズは、7月21日の53%から34%を経て、現在は17%にまで下落。Kalshiの「2027年7月以前の成立」を追う契約も、41%まで落ちている。
トゥーンは「死んだわけではない。順序立てて進めているだけだ」と述べ、ルミス議員も休会前に採決を求め続けている。しかし、上院が他の立法を優先していること、そして主要な争点(倫理規制、ステーブルコインの報酬、違法資金対策の条項)がいまだ未解決であることを踏まえると、2026年の採決はますます可能性が低いように見える。
明日へ向けての意味はこうだ。CLARITYは当面の起爆剤(カタリスト)としてはテーブルから外れた。NFPが今週唯一の主要イベントとなり、すでに持っていた以上の重みを帯びる。
この結果を予想していた?それとも金曜日にかけてまだ希望を持っていた? 👇#CLARTYACT
📉 明確さは窓を逃した いったい何が起きたのか
私たちが今週ずっと追ってきたカウントダウンは解決したものの、誰も望んでいた形ではなかった。上院多数党院内総務のトゥーンは水曜日、3つの別の法案についてクローチャー(打ち切り)動議を提出した。対象は「大学スポーツ保護法」、政府の歳出を進めるための手段、そして司法長官の指名である。CLARITYはそのリストに入っていなかった。木曜日の予定にも含まれていない。
市場はもう、この急速な再評価を進めている。2026年の成立に関するPolymarketのオッズは、7月21日の53%から34%を経て、現在は17%にまで下落。Kalshiの「2027年7月以前の成立」を追う契約も、41%まで落ちている。
トゥーンは「死んだわけではない。順序立てて進めているだけだ」と述べ、ルミス議員も休会前に採決を求め続けている。しかし、上院が他の立法を優先していること、そして主要な争点(倫理規制、ステーブルコインの報酬、違法資金対策の条項)がいまだ未解決であることを踏まえると、2026年の採決はますます可能性が低いように見える。
明日へ向けての意味はこうだ。CLARITYは当面の起爆剤(カタリスト)としてはテーブルから外れた。NFPが今週唯一の主要イベントとなり、すでに持っていた以上の重みを帯びる。
この結果を予想していた?それとも金曜日にかけてまだ希望を持っていた? 👇#CLARTYACT
私たちが今週ずっと追ってきたカウントダウンは解決したものの、誰も望んでいた形ではなかった。上院多数党院内総務のトゥーンは水曜日、3つの別の法案についてクローチャー(打ち切り)動議を提出した。対象は「大学スポーツ保護法」、政府の歳出を進めるための手段、そして司法長官の指名である。CLARITYはそのリストに入っていなかった。木曜日の予定にも含まれていない。
市場はもう、この急速な再評価を進めている。2026年の成立に関するPolymarketのオッズは、7月21日の53%から34%を経て、現在は17%にまで下落。Kalshiの「2027年7月以前の成立」を追う契約も、41%まで落ちている。
トゥーンは「死んだわけではない。順序立てて進めているだけだ」と述べ、ルミス議員も休会前に採決を求め続けている。しかし、上院が他の立法を優先していること、そして主要な争点(倫理規制、ステーブルコインの報酬、違法資金対策の条項)がいまだ未解決であることを踏まえると、2026年の採決はますます可能性が低いように見える。
明日へ向けての意味はこうだ。CLARITYは当面の起爆剤(カタリスト)としてはテーブルから外れた。NFPが今週唯一の主要イベントとなり、すでに持っていた以上の重みを帯びる。
この結果を予想していた?それとも金曜日にかけてまだ希望を持っていた? 👇#CLARTYACT
1
231
·
--
ブリッシュ
本人確認中
📊 今日の語彙の変化:Cut(利下げ)→ Hike(利上げ)
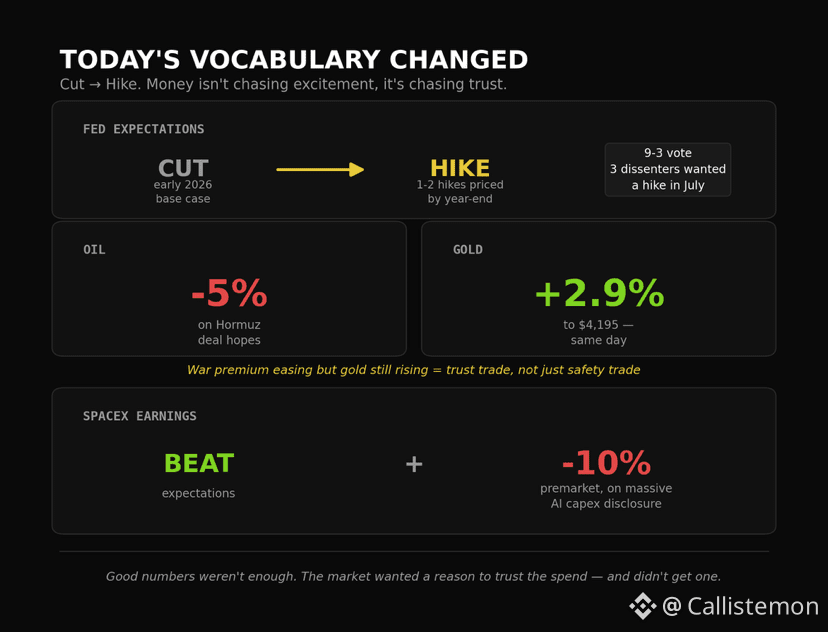
6か月前は、FRB(米連邦準備制度理事会)のあらゆる会話が「金利はいつ下がるのか」に集中していました。ところが今日はその会話が反転しました。7月のFOMCは3.50-3.75%で据え置かれたものの、メンバーのハマック、カシュカリ、ローガンの3人は直ちに利上げを求めて反対票を投じました。市場の見通しは大きく修正されています。利下げから、年末までに1〜2回の利上げが見込まれる状態へと変わったのです。
この変化は、ホルムズとSpaceXに関する今日の見出しよりも重要です。注目を集めているのはそちらですが。
■原油/金:トランプ氏は、ホルムズ再開に関する取引が「今日」に成立する可能性があると言いました。報道を受けて原油は下落しました(予想通り)。しかし金は連動しませんでした。金は上昇し、4,195ドルを突破、約3%高です。ここがポイントです。戦争プレミアムが本当に緩んでいるなら、金もそれに合わせて落ち着くはずです。でも落ち着かなかった。つまり、これはもはや「安全資産としての取引」だけではなく、「信頼の取引」になっているということです。金利、ドル、実質金利が今後どうなるかへの信頼は、ホルムズの見出しが示唆する以上に揺らいでいます。
■SpaceX:決算は上振れしたのに、その後プレマーケットで10%以上下落。大規模なAI向けの設備投資(capex)の開示が重しになりました。良い数字だけでは足りず、市場が「この支出を正当化する物語」を求めたのに、それが得られなかった、そして市場が納得できるものではなかったのです。
まとめると、今の資金は「ワクワク」を探していません。信頼を探しています。金がその取引で勝っているのです。退屈なくらい堅実で、安全性が高く、歴史的に信頼できる。その資本は、ほかの場所に向かうはずだった分を取り込んでいます。株式もそれを取りに行っています。ストーリーによってです。そして今日のSpaceXの反応が示すのは、ミスが許される余地がどれだけ薄くなっているか、ということです。
この環境で暗号資産が本当に新しい資金を呼び込むには、派手な物語だけではおそらく十分ではありません。制度面での規制の明確さ、実際の収益、実質的なカストディの保証といった、機関レベルでの「信頼」を築ける何かが必要です。
単に「次は期待できそう」と言える新しい理由ではなく。
暗号資産にとって、信頼を築く“その瞬間”はどこから生まれると思いますか? 👇
📊 今日の語彙の変化:Cut(利下げ)→ Hike(利上げ)
6か月前は、FRB(米連邦準備制度理事会)のあらゆる会話が「金利はいつ下がるのか」に集中していました。ところが今日はその会話が反転しました。7月のFOMCは3.50-3.75%で据え置かれたものの、メンバーのハマック、カシュカリ、ローガンの3人は直ちに利上げを求めて反対票を投じました。市場の見通しは大きく修正されています。利下げから、年末までに1〜2回の利上げが見込まれる状態へと変わったのです。
この変化は、ホルムズとSpaceXに関する今日の見出しよりも重要です。注目を集めているのはそちらですが。
■原油/金:トランプ氏は、ホルムズ再開に関する取引が「今日」に成立する可能性があると言いました。報道を受けて原油は下落しました(予想通り)。しかし金は連動しませんでした。金は上昇し、4,195ドルを突破、約3%高です。ここがポイントです。戦争プレミアムが本当に緩んでいるなら、金もそれに合わせて落ち着くはずです。でも落ち着かなかった。つまり、これはもはや「安全資産としての取引」だけではなく、「信頼の取引」になっているということです。金利、ドル、実質金利が今後どうなるかへの信頼は、ホルムズの見出しが示唆する以上に揺らいでいます。
■SpaceX:決算は上振れしたのに、その後プレマーケットで10%以上下落。大規模なAI向けの設備投資(capex)の開示が重しになりました。良い数字だけでは足りず、市場が「この支出を正当化する物語」を求めたのに、それが得られなかった、そして市場が納得できるものではなかったのです。
まとめると、今の資金は「ワクワク」を探していません。信頼を探しています。金がその取引で勝っているのです。退屈なくらい堅実で、安全性が高く、歴史的に信頼できる。その資本は、ほかの場所に向かうはずだった分を取り込んでいます。株式もそれを取りに行っています。ストーリーによってです。そして今日のSpaceXの反応が示すのは、ミスが許される余地がどれだけ薄くなっているか、ということです。
この環境で暗号資産が本当に新しい資金を呼び込むには、派手な物語だけではおそらく十分ではありません。制度面での規制の明確さ、実際の収益、実質的なカストディの保証といった、機関レベルでの「信頼」を築ける何かが必要です。
単に「次は期待できそう」と言える新しい理由ではなく。
暗号資産にとって、信頼を築く“その瞬間”はどこから生まれると思いますか? 👇
6か月前は、FRB(米連邦準備制度理事会)のあらゆる会話が「金利はいつ下がるのか」に集中していました。ところが今日はその会話が反転しました。7月のFOMCは3.50-3.75%で据え置かれたものの、メンバーのハマック、カシュカリ、ローガンの3人は直ちに利上げを求めて反対票を投じました。市場の見通しは大きく修正されています。利下げから、年末までに1〜2回の利上げが見込まれる状態へと変わったのです。
この変化は、ホルムズとSpaceXに関する今日の見出しよりも重要です。注目を集めているのはそちらですが。
■原油/金:トランプ氏は、ホルムズ再開に関する取引が「今日」に成立する可能性があると言いました。報道を受けて原油は下落しました(予想通り)。しかし金は連動しませんでした。金は上昇し、4,195ドルを突破、約3%高です。ここがポイントです。戦争プレミアムが本当に緩んでいるなら、金もそれに合わせて落ち着くはずです。でも落ち着かなかった。つまり、これはもはや「安全資産としての取引」だけではなく、「信頼の取引」になっているということです。金利、ドル、実質金利が今後どうなるかへの信頼は、ホルムズの見出しが示唆する以上に揺らいでいます。
■SpaceX:決算は上振れしたのに、その後プレマーケットで10%以上下落。大規模なAI向けの設備投資(capex)の開示が重しになりました。良い数字だけでは足りず、市場が「この支出を正当化する物語」を求めたのに、それが得られなかった、そして市場が納得できるものではなかったのです。
まとめると、今の資金は「ワクワク」を探していません。信頼を探しています。金がその取引で勝っているのです。退屈なくらい堅実で、安全性が高く、歴史的に信頼できる。その資本は、ほかの場所に向かうはずだった分を取り込んでいます。株式もそれを取りに行っています。ストーリーによってです。そして今日のSpaceXの反応が示すのは、ミスが許される余地がどれだけ薄くなっているか、ということです。
この環境で暗号資産が本当に新しい資金を呼び込むには、派手な物語だけではおそらく十分ではありません。制度面での規制の明確さ、実際の収益、実質的なカストディの保証といった、機関レベルでの「信頼」を築ける何かが必要です。
単に「次は期待できそう」と言える新しい理由ではなく。
暗号資産にとって、信頼を築く“その瞬間”はどこから生まれると思いますか? 👇
646
·
--
ブリッシュ
HYPE / USDT 日次テクニカル分析
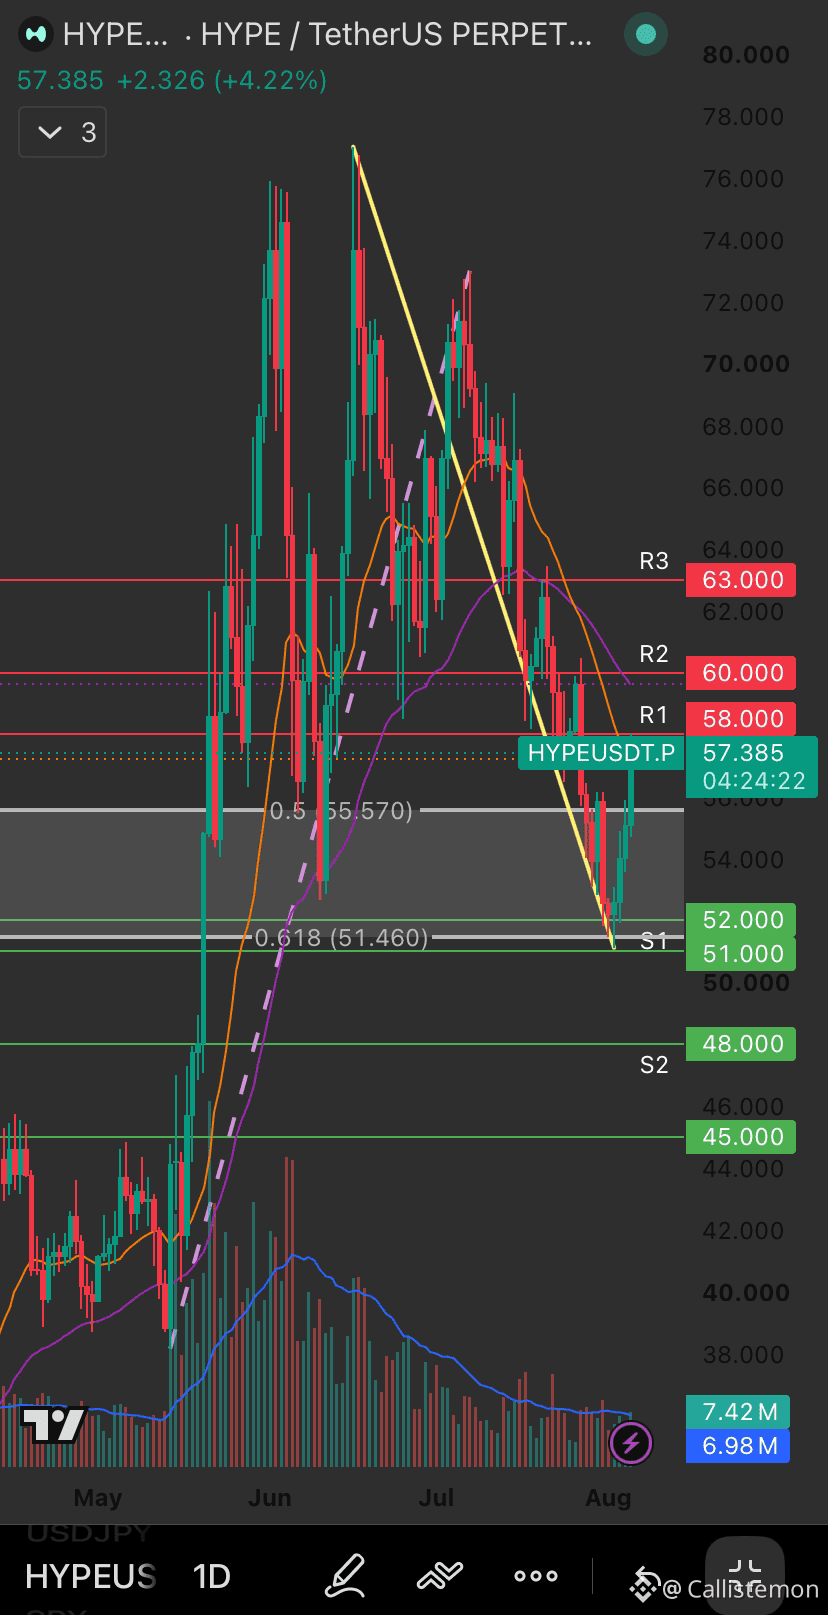
現在の価格は0.5フィボナッチ水準($55.57)を上回って維持されており、重要なレジスタンス・ゾーンをテストしています。
主要レベル:
• レジスタンス1:$58
• レジスタンス2:$60
• レジスタンス3:$63
• 強いサポート(S1):$51 ~ $52(0.618 Fib)
• サポート2:$48
構造:
• 価格は下降トレンドラインの下にとどまっています。
• 20EMAと50EMAがダイナミックなレジスタンスとして機能しています。
• 直近のリカバリー・キャンドルで出来高が増加し始めています。
シナリオ:強気シナリオ → 出来高の確認を伴って$58を日足で終値が上回れば、$60および$63への道が開けます。
弱気シナリオ → $55.57のサポート喪失により、焦点は$51~$52のゾーンへ移ります。
次の決定的な動きは、$58水準でのクリーンな反応から生じる可能性が高いでしょう。
NFA、自己調査(DYOR)。
#hype #Hyperliquid #TechnicalAnalysis #crypto
HYPE / USDT 日次テクニカル分析
現在の価格は0.5フィボナッチ水準($55.57)を上回って維持されており、重要なレジスタンス・ゾーンをテストしています。
主要レベル:
• レジスタンス1:$58
• レジスタンス2:$60
• レジスタンス3:$63
• 強いサポート(S1):$51 ~ $52(0.618 Fib)
• サポート2:$48
構造:
• 価格は下降トレンドラインの下にとどまっています。
• 20EMAと50EMAがダイナミックなレジスタンスとして機能しています。
• 直近のリカバリー・キャンドルで出来高が増加し始めています。
シナリオ:強気シナリオ → 出来高の確認を伴って$58を日足で終値が上回れば、$60および$63への道が開けます。
弱気シナリオ → $55.57のサポート喪失により、焦点は$51~$52のゾーンへ移ります。
次の決定的な動きは、$58水準でのクリーンな反応から生じる可能性が高いでしょう。
NFA、自己調査(DYOR)。
#hype #Hyperliquid #TechnicalAnalysis #crypto
現在の価格は0.5フィボナッチ水準($55.57)を上回って維持されており、重要なレジスタンス・ゾーンをテストしています。
主要レベル:
• レジスタンス1:$58
• レジスタンス2:$60
• レジスタンス3:$63
• 強いサポート(S1):$51 ~ $52(0.618 Fib)
• サポート2:$48
構造:
• 価格は下降トレンドラインの下にとどまっています。
• 20EMAと50EMAがダイナミックなレジスタンスとして機能しています。
• 直近のリカバリー・キャンドルで出来高が増加し始めています。
シナリオ:強気シナリオ → 出来高の確認を伴って$58を日足で終値が上回れば、$60および$63への道が開けます。
弱気シナリオ → $55.57のサポート喪失により、焦点は$51~$52のゾーンへ移ります。
次の決定的な動きは、$58水準でのクリーンな反応から生じる可能性が高いでしょう。
NFA、自己調査(DYOR)。
#hype #Hyperliquid #TechnicalAnalysis #crypto
139
·
--
ブリッシュ
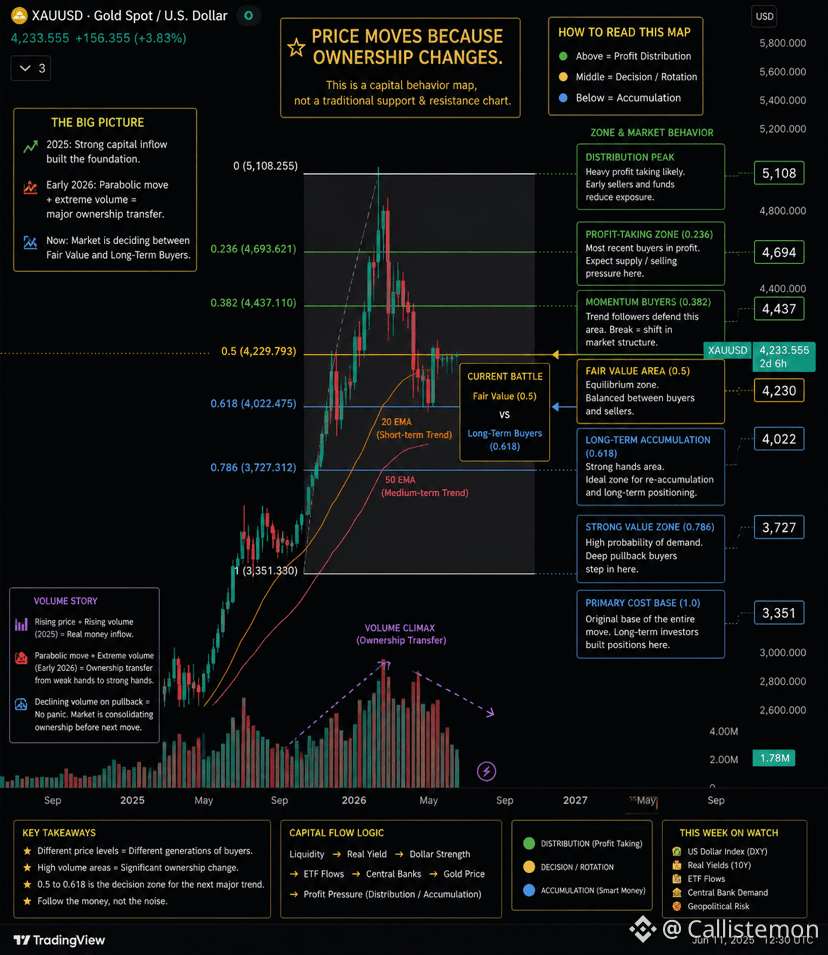
レンズを通した資本回転によるゴールド
「サポートはどこにあるのか?」と問う代わりに、私はこう問います:
「投資家のさまざまなグループは、どこで行動しそうか?」
長期の構造、フィボナッチ・リトレースメント、トレンド分析を用いて、単なる価格水準ではなく、行動ゾーンに市場を分けました。
現在の市場構造
$5,108 → 分配(ディストリビューション)ピーク
$4,694 → 利益確定ゾーン
$4,437 → モメンタム買い
$4,230 → 公正価値(現在の意思決定エリア)
$4,022 → 長期買い
$3,727 → 強いバリューゾーン
$3,351 → 取得原価のベース
2つのシナリオ
強気
$4,230を上回って保つ
$4,437を上抜ける
モメンタムは、先の高値である約$5,108を目指します。
弱気
$4,022を失う
資本は$3,727〜$3,351の蓄積ゾーンへ回転します。
目的は、すべての値動きを予測することではありません。
参加者間で資本がどのように回転するのか、そして次の重要な持ち分(オーナーシップ)の変化がどこで起こり得るかを理解することです。
これは議論のための枠組みであり、投資助言ではありません。$XAU
{future}(XAUUSDT)
レンズを通した資本回転によるゴールド
「サポートはどこにあるのか?」と問う代わりに、私はこう問います:
「投資家のさまざまなグループは、どこで行動しそうか?」
長期の構造、フィボナッチ・リトレースメント、トレンド分析を用いて、単なる価格水準ではなく、行動ゾーンに市場を分けました。
現在の市場構造
$5,108 → 分配(ディストリビューション)ピーク
$4,694 → 利益確定ゾーン
$4,437 → モメンタム買い
$4,230 → 公正価値(現在の意思決定エリア)
$4,022 → 長期買い
$3,727 → 強いバリューゾーン
$3,351 → 取得原価のベース
2つのシナリオ
強気
$4,230を上回って保つ
$4,437を上抜ける
モメンタムは、先の高値である約$5,108を目指します。
弱気
$4,022を失う
資本は$3,727〜$3,351の蓄積ゾーンへ回転します。
目的は、すべての値動きを予測することではありません。
参加者間で資本がどのように回転するのか、そして次の重要な持ち分(オーナーシップ)の変化がどこで起こり得るかを理解することです。
これは議論のための枠組みであり、投資助言ではありません。$XAU
「サポートはどこにあるのか?」と問う代わりに、私はこう問います:
「投資家のさまざまなグループは、どこで行動しそうか?」
長期の構造、フィボナッチ・リトレースメント、トレンド分析を用いて、単なる価格水準ではなく、行動ゾーンに市場を分けました。
現在の市場構造
$5,108 → 分配(ディストリビューション)ピーク
$4,694 → 利益確定ゾーン
$4,437 → モメンタム買い
$4,230 → 公正価値(現在の意思決定エリア)
$4,022 → 長期買い
$3,727 → 強いバリューゾーン
$3,351 → 取得原価のベース
2つのシナリオ
強気
$4,230を上回って保つ
$4,437を上抜ける
モメンタムは、先の高値である約$5,108を目指します。
弱気
$4,022を失う
資本は$3,727〜$3,351の蓄積ゾーンへ回転します。
目的は、すべての値動きを予測することではありません。
参加者間で資本がどのように回転するのか、そして次の重要な持ち分(オーナーシップ)の変化がどこで起こり得るかを理解することです。
これは議論のための枠組みであり、投資助言ではありません。$XAU
1
186
·
--
ブリッシュ
📊 トランプの日はまた来た。でも実際に暗号資産は動くの?
「株式市場は記録更新を重ねている。投資家はアメリカが勝っていると知っている。これがアメリカの黄金時代だ。」
こうした発言は数週間に一度のように出てきて、反応に備えるのがいつもの本能だ。そこで、その直感が本当に成り立つのか確かめた。
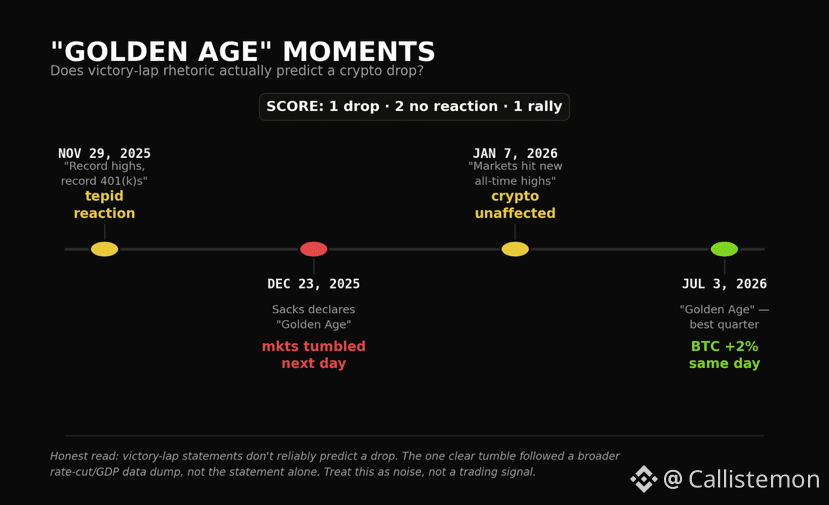
直近4回、トランプが市場について似た勝利宣言をした際は:
2025年11月29日 — 「史上最高値、史上最高の401(k)」→ 反応は鈍い
2025年12月23日 — 強いGDP/利下げデータとともに「黄金時代」宣言 → 翌日、市場は崩れた
2026年1月7日 — 「市場が新高値」→ 暗号資産は無反応
2026年7月3日 — 「黄金時代」、最高の四半期 → BTCは当日実際に2%上昇
結果:下落1回、無反応2回、上昇1回。これを取引のパターンとして使えるようなものではなく、むしろノイズに近い。実際に大きく崩れたのは、発言そのものではなく、その日のGDP/利下げデータが着地したことが原因の可能性が高い。
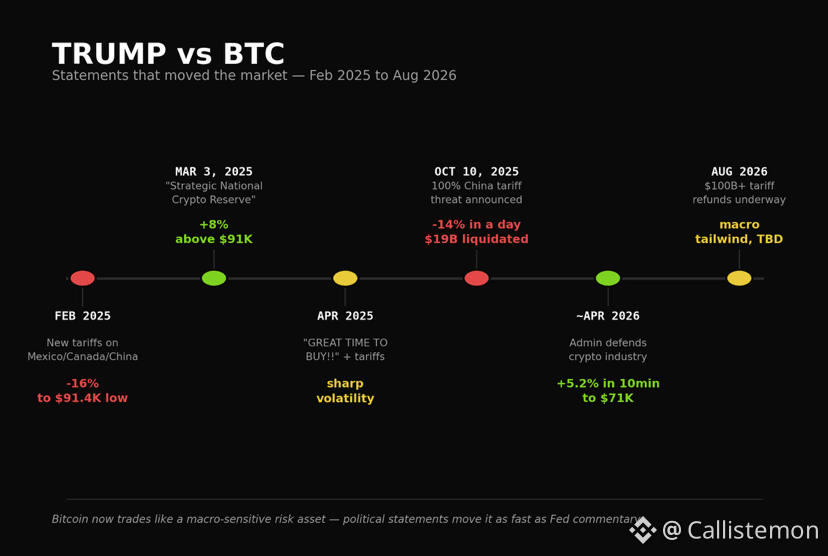
一方で、トランプの実際に市場を動かす発言は、関税の脅しや政策の転換だ。こちらは、はるかに明確で一貫した反応を示す:2025年2月の関税で-16%、「Strategic Reserve(戦略備蓄)」の発表で+8%、10月の対中関税の脅しで1日で-14%、そして政権が暗号資産業界を擁護した際には10分で+5.2%。
教訓:トランプの名前が見出しに入っているからといって、すべてがきっかけになるわけではない。きっかけになるのは、関税、規制、政策の変更だ。勝利の万歳的なものは、たいてい違う。
今週の本当の材料は、金曜日の雇用統計と、CLARITY Actの締切だ。そこにこそ実際のシグナルがある。 #trump
📊 トランプの日はまた来た。でも実際に暗号資産は動くの?
「株式市場は記録更新を重ねている。投資家はアメリカが勝っていると知っている。これがアメリカの黄金時代だ。」
こうした発言は数週間に一度のように出てきて、反応に備えるのがいつもの本能だ。そこで、その直感が本当に成り立つのか確かめた。
直近4回、トランプが市場について似た勝利宣言をした際は:
2025年11月29日 — 「史上最高値、史上最高の401(k)」→ 反応は鈍い
2025年12月23日 — 強いGDP/利下げデータとともに「黄金時代」宣言 → 翌日、市場は崩れた
2026年1月7日 — 「市場が新高値」→ 暗号資産は無反応
2026年7月3日 — 「黄金時代」、最高の四半期 → BTCは当日実際に2%上昇
結果:下落1回、無反応2回、上昇1回。これを取引のパターンとして使えるようなものではなく、むしろノイズに近い。実際に大きく崩れたのは、発言そのものではなく、その日のGDP/利下げデータが着地したことが原因の可能性が高い。
一方で、トランプの実際に市場を動かす発言は、関税の脅しや政策の転換だ。こちらは、はるかに明確で一貫した反応を示す:2025年2月の関税で-16%、「Strategic Reserve(戦略備蓄)」の発表で+8%、10月の対中関税の脅しで1日で-14%、そして政権が暗号資産業界を擁護した際には10分で+5.2%。
教訓:トランプの名前が見出しに入っているからといって、すべてがきっかけになるわけではない。きっかけになるのは、関税、規制、政策の変更だ。勝利の万歳的なものは、たいてい違う。
今週の本当の材料は、金曜日の雇用統計と、CLARITY Actの締切だ。そこにこそ実際のシグナルがある。 #trump
「株式市場は記録更新を重ねている。投資家はアメリカが勝っていると知っている。これがアメリカの黄金時代だ。」
こうした発言は数週間に一度のように出てきて、反応に備えるのがいつもの本能だ。そこで、その直感が本当に成り立つのか確かめた。
直近4回、トランプが市場について似た勝利宣言をした際は:
2025年11月29日 — 「史上最高値、史上最高の401(k)」→ 反応は鈍い
2025年12月23日 — 強いGDP/利下げデータとともに「黄金時代」宣言 → 翌日、市場は崩れた
2026年1月7日 — 「市場が新高値」→ 暗号資産は無反応
2026年7月3日 — 「黄金時代」、最高の四半期 → BTCは当日実際に2%上昇
結果:下落1回、無反応2回、上昇1回。これを取引のパターンとして使えるようなものではなく、むしろノイズに近い。実際に大きく崩れたのは、発言そのものではなく、その日のGDP/利下げデータが着地したことが原因の可能性が高い。
一方で、トランプの実際に市場を動かす発言は、関税の脅しや政策の転換だ。こちらは、はるかに明確で一貫した反応を示す:2025年2月の関税で-16%、「Strategic Reserve(戦略備蓄)」の発表で+8%、10月の対中関税の脅しで1日で-14%、そして政権が暗号資産業界を擁護した際には10分で+5.2%。
教訓:トランプの名前が見出しに入っているからといって、すべてがきっかけになるわけではない。きっかけになるのは、関税、規制、政策の変更だ。勝利の万歳的なものは、たいてい違う。
今週の本当の材料は、金曜日の雇用統計と、CLARITY Actの締切だ。そこにこそ実際のシグナルがある。 #trump
125
·
--
ブリッシュ
📡 $ASTS セットアップ:同情的な相場(Sympathy Rally)か、それとも本当のブレイクアウトか?
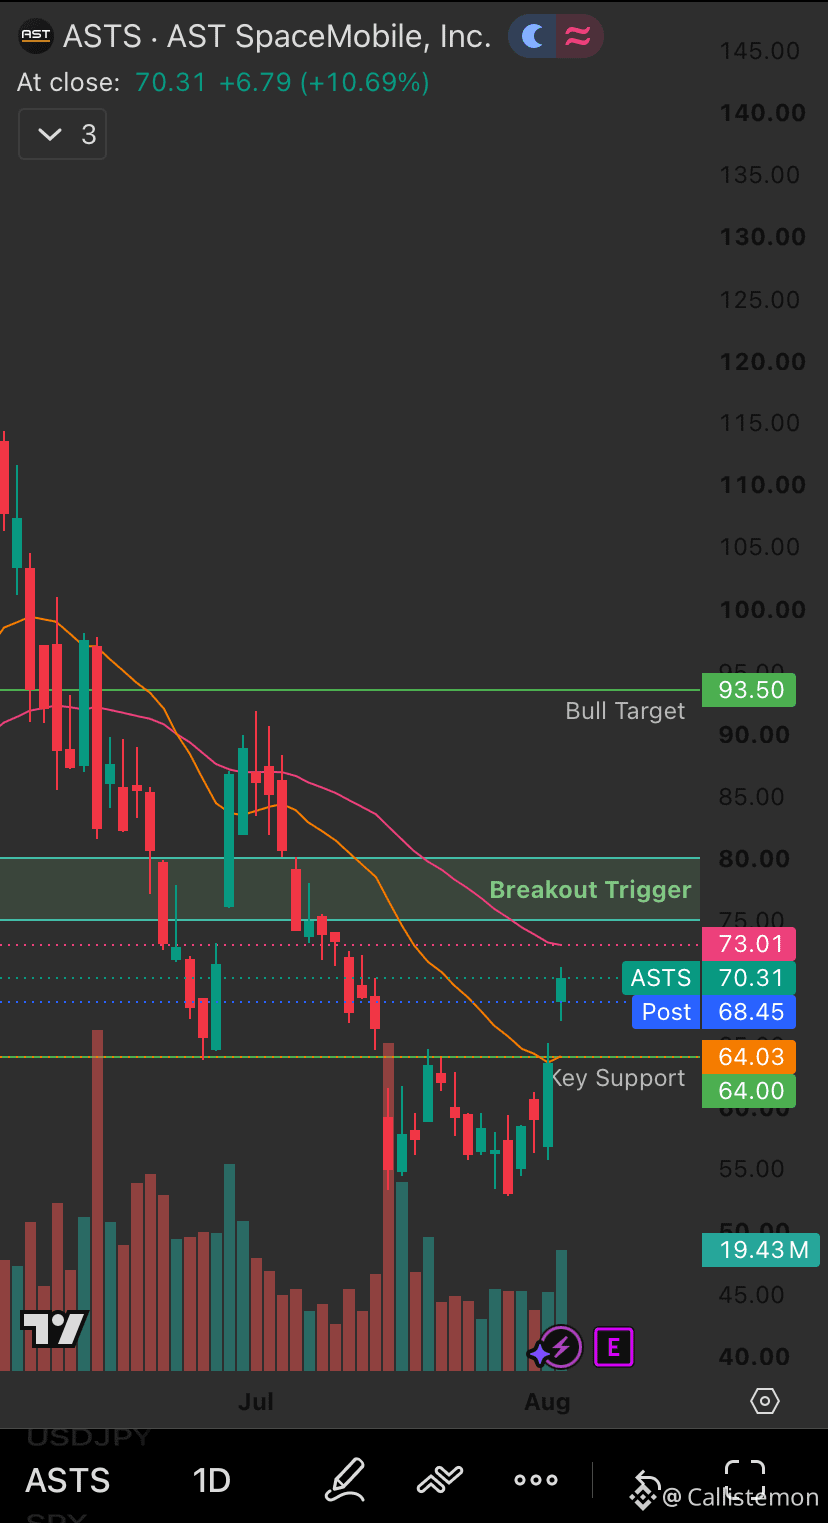
AST SpaceMobileは本日+10.69%で$70.31に上昇しましたが、あまり深読みする前に文脈が重要です。これは、SpaceXが初の一般向け決算発表を行う前の、セクター全体の動きでした。SpaceXが+4%、ASTSが+9%、Rocket Labが+6%となり、上昇は衛星や打ち上げ関連の銘柄全体に広がりました。宇宙関連株に対するRedditのセンチメントは、7月にセクターが25〜33%下落した後、強気に反転しています。
テクニカル面では:ASTSは、$64付近の主要サポート(これまで2度支持されたダブルボトム)から跳ね返された後、現在$73〜$80のブレイクアウト・トリガー・ゾーンをテスト中です。このゾーンの上では、直近のスイング高の構造に基づき$93.50が次の本命ターゲットです。
本当のきっかけは今日の値動きではなく、8月10日です。この日にASTSが決算を発表します。売上の予想は$34.54Mで、前年の$1.16Mから大幅に増加見込み。損失は縮小傾向で、EPS予想は-0.29ドル(前年同期-0.41ドル)。ただ、アナリストの見方は現時点で本当に割れています。Piper Sandlerは目標株価$100(Overweight)、B. Rileyは$85(Buy)ですが、Scotiabankは7月29日に目標株価$50.80へ引き下げ(Sector Perform)ており、その目標は今日の価格よりも実際に低い水準です。
押さえておくべき構造的リスクもあります。ASTSは宇宙セクターのETF(例:Procure Space)において重要なウェイトを持つため、企業ニュースとは無関係に、ファンドの資金流入・流出によって機械的な売買が発生し得ます。
結論:今日の上げは、ASTS固有のシグナルというより、セクターへの連動(ベータ)に近いように見えます。8月10日の決算で、価格アクションをファンダメンタルが裏付けるのかが分かります。
これ、引き続き注目してます。みなさんの考えは?👇
{future}(ASTSUSDT)
📡 $ASTS セットアップ:同情的な相場(Sympathy Rally)か、それとも本当のブレイクアウトか?
AST SpaceMobileは本日+10.69%で$70.31に上昇しましたが、あまり深読みする前に文脈が重要です。これは、SpaceXが初の一般向け決算発表を行う前の、セクター全体の動きでした。SpaceXが+4%、ASTSが+9%、Rocket Labが+6%となり、上昇は衛星や打ち上げ関連の銘柄全体に広がりました。宇宙関連株に対するRedditのセンチメントは、7月にセクターが25〜33%下落した後、強気に反転しています。
テクニカル面では:ASTSは、$64付近の主要サポート(これまで2度支持されたダブルボトム)から跳ね返された後、現在$73〜$80のブレイクアウト・トリガー・ゾーンをテスト中です。このゾーンの上では、直近のスイング高の構造に基づき$93.50が次の本命ターゲットです。
本当のきっかけは今日の値動きではなく、8月10日です。この日にASTSが決算を発表します。売上の予想は$34.54Mで、前年の$1.16Mから大幅に増加見込み。損失は縮小傾向で、EPS予想は-0.29ドル(前年同期-0.41ドル)。ただ、アナリストの見方は現時点で本当に割れています。Piper Sandlerは目標株価$100(Overweight)、B. Rileyは$85(Buy)ですが、Scotiabankは7月29日に目標株価$50.80へ引き下げ(Sector Perform)ており、その目標は今日の価格よりも実際に低い水準です。
押さえておくべき構造的リスクもあります。ASTSは宇宙セクターのETF(例:Procure Space)において重要なウェイトを持つため、企業ニュースとは無関係に、ファンドの資金流入・流出によって機械的な売買が発生し得ます。
結論:今日の上げは、ASTS固有のシグナルというより、セクターへの連動(ベータ)に近いように見えます。8月10日の決算で、価格アクションをファンダメンタルが裏付けるのかが分かります。
これ、引き続き注目してます。みなさんの考えは?👇
AST SpaceMobileは本日+10.69%で$70.31に上昇しましたが、あまり深読みする前に文脈が重要です。これは、SpaceXが初の一般向け決算発表を行う前の、セクター全体の動きでした。SpaceXが+4%、ASTSが+9%、Rocket Labが+6%となり、上昇は衛星や打ち上げ関連の銘柄全体に広がりました。宇宙関連株に対するRedditのセンチメントは、7月にセクターが25〜33%下落した後、強気に反転しています。
テクニカル面では:ASTSは、$64付近の主要サポート(これまで2度支持されたダブルボトム)から跳ね返された後、現在$73〜$80のブレイクアウト・トリガー・ゾーンをテスト中です。このゾーンの上では、直近のスイング高の構造に基づき$93.50が次の本命ターゲットです。
本当のきっかけは今日の値動きではなく、8月10日です。この日にASTSが決算を発表します。売上の予想は$34.54Mで、前年の$1.16Mから大幅に増加見込み。損失は縮小傾向で、EPS予想は-0.29ドル(前年同期-0.41ドル)。ただ、アナリストの見方は現時点で本当に割れています。Piper Sandlerは目標株価$100(Overweight)、B. Rileyは$85(Buy)ですが、Scotiabankは7月29日に目標株価$50.80へ引き下げ(Sector Perform)ており、その目標は今日の価格よりも実際に低い水準です。
押さえておくべき構造的リスクもあります。ASTSは宇宙セクターのETF(例:Procure Space)において重要なウェイトを持つため、企業ニュースとは無関係に、ファンドの資金流入・流出によって機械的な売買が発生し得ます。
結論:今日の上げは、ASTS固有のシグナルというより、セクターへの連動(ベータ)に近いように見えます。8月10日の決算で、価格アクションをファンダメンタルが裏付けるのかが分かります。
これ、引き続き注目してます。みなさんの考えは?👇
1
120
·
--
ブリッシュ
本人確認中
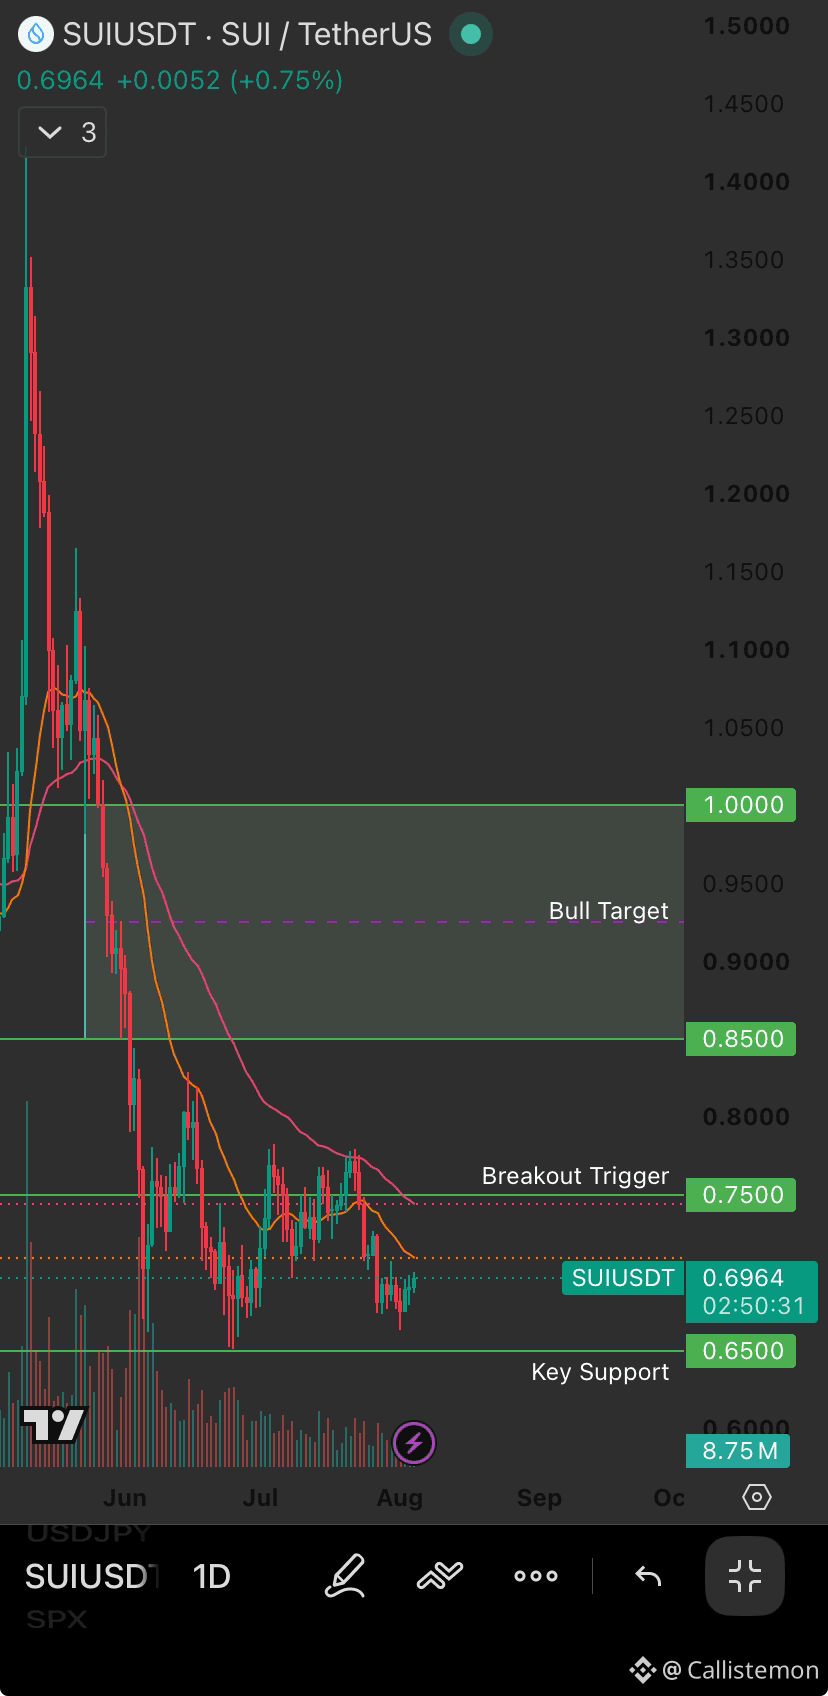
🔵 $SUI 設定:強固な基礎、遅れているテクニカル
Suiは、アブダビのMubadalaが同ネットワーク上で7,500万ドル規模のプライベート・マーケッツ・ファンドをトークン化したという、本物の機関投資家レベルのマイルストーンを獲得したばかりです。これは物語主導の投機ではなく、より長い時間軸で意味を持つ資本配分の動きです。
ただしテクニカル面では、まだそれが確認できていません。SUIは$0.6967で取引されており、50日・200日の移動平均の両方を下回っています(200Dは現在価格より35%超上)。また週足チャートでは、数カ月にわたって続く下降チャネルが依然として表示されています。
注目ポイント:
🟢 ブレイクアウトのきっかけ:出来高を伴って$0.75を奪回すれば、$0.85〜$1.00への道が開ける
🔴 重要サポート:$0.65を割り込むと、より深い下落のリスク。より広いチャネル構造を踏まえると要警戒です
現状は価格がその2つの間に挟まれており、ファンダメンタルの物語とテクニカルのセットアップの間にあるこのギャップこそ、まさに注目すべき緊張感です。今月、控えめなトークンアンロック(供給増は約0.55%)もありますが、重大な重しというほどではなく、把握しておく価値はあります。
機関投資家の採用は、価格に即座に反映されないこともあります。問題は、SUIのチャートが物語に追いつくのか、それとも物語が先に色あせるのか、です。
あなたはこの件、どのポジションですか?👇
{future}(SUIUSDT)
🔵 $SUI 設定:強固な基礎、遅れているテクニカル
Suiは、アブダビのMubadalaが同ネットワーク上で7,500万ドル規模のプライベート・マーケッツ・ファンドをトークン化したという、本物の機関投資家レベルのマイルストーンを獲得したばかりです。これは物語主導の投機ではなく、より長い時間軸で意味を持つ資本配分の動きです。
ただしテクニカル面では、まだそれが確認できていません。SUIは$0.6967で取引されており、50日・200日の移動平均の両方を下回っています(200Dは現在価格より35%超上)。また週足チャートでは、数カ月にわたって続く下降チャネルが依然として表示されています。
注目ポイント:
🟢 ブレイクアウトのきっかけ:出来高を伴って$0.75を奪回すれば、$0.85〜$1.00への道が開ける
🔴 重要サポート:$0.65を割り込むと、より深い下落のリスク。より広いチャネル構造を踏まえると要警戒です
現状は価格がその2つの間に挟まれており、ファンダメンタルの物語とテクニカルのセットアップの間にあるこのギャップこそ、まさに注目すべき緊張感です。今月、控えめなトークンアンロック(供給増は約0.55%)もありますが、重大な重しというほどではなく、把握しておく価値はあります。
機関投資家の採用は、価格に即座に反映されないこともあります。問題は、SUIのチャートが物語に追いつくのか、それとも物語が先に色あせるのか、です。
あなたはこの件、どのポジションですか?👇
Suiは、アブダビのMubadalaが同ネットワーク上で7,500万ドル規模のプライベート・マーケッツ・ファンドをトークン化したという、本物の機関投資家レベルのマイルストーンを獲得したばかりです。これは物語主導の投機ではなく、より長い時間軸で意味を持つ資本配分の動きです。
ただしテクニカル面では、まだそれが確認できていません。SUIは$0.6967で取引されており、50日・200日の移動平均の両方を下回っています(200Dは現在価格より35%超上)。また週足チャートでは、数カ月にわたって続く下降チャネルが依然として表示されています。
注目ポイント:
🟢 ブレイクアウトのきっかけ:出来高を伴って$0.75を奪回すれば、$0.85〜$1.00への道が開ける
🔴 重要サポート:$0.65を割り込むと、より深い下落のリスク。より広いチャネル構造を踏まえると要警戒です
現状は価格がその2つの間に挟まれており、ファンダメンタルの物語とテクニカルのセットアップの間にあるこのギャップこそ、まさに注目すべき緊張感です。今月、控えめなトークンアンロック(供給増は約0.55%)もありますが、重大な重しというほどではなく、把握しておく価値はあります。
機関投資家の採用は、価格に即座に反映されないこともあります。問題は、SUIのチャートが物語に追いつくのか、それとも物語が先に色あせるのか、です。
あなたはこの件、どのポジションですか?👇
1
153
·
--
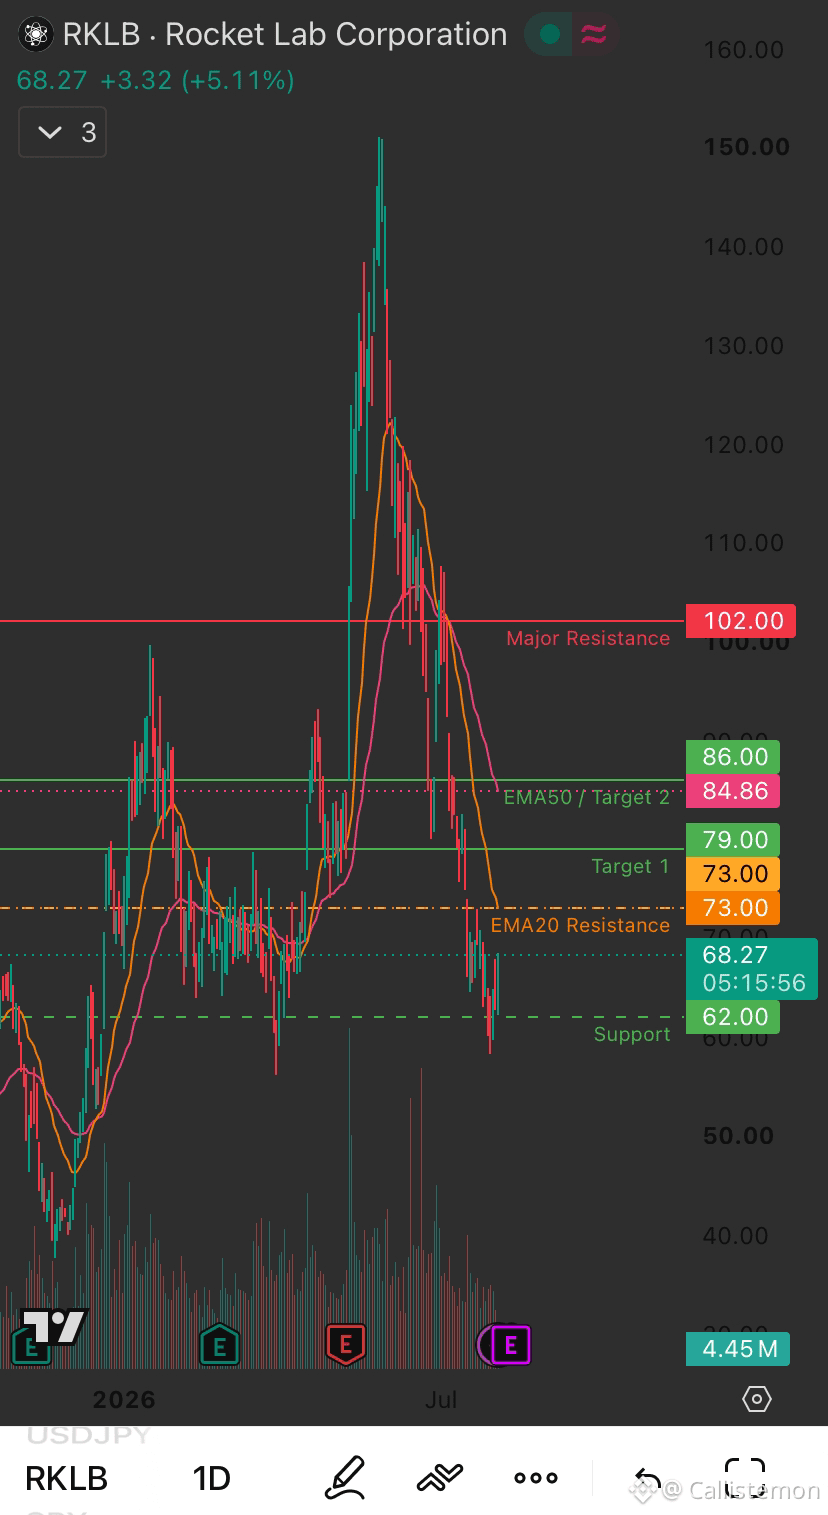
$RKLB は急激な調整の後、安定化を目指しているところです。
価格は依然として20日EMAと50日EMAの両方を下回っており、より広いトレンドはまだ慎重です。
$62のサポートが維持される限り、リカバリーのシナリオは成り立ったままです。
$73付近の20日EMAを奪回できれば、最初の強気の確認となり、$79、さらに$86付近の50日EMAへの道が開けます。
$102を明確に上抜けると、より強いトレンド反転を示し、長期的な見通しは再び強気に戻ります。
注目レベル:
サポート:$62
EMA20のレジスタンス:$73
目標1:$79
EMA50 / 目標2:$86
主要レジスタンス:$102
{future}(RKLBUSDT)
$RKLB は急激な調整の後、安定化を目指しているところです。
価格は依然として20日EMAと50日EMAの両方を下回っており、より広いトレンドはまだ慎重です。
$62のサポートが維持される限り、リカバリーのシナリオは成り立ったままです。
$73付近の20日EMAを奪回できれば、最初の強気の確認となり、$79、さらに$86付近の50日EMAへの道が開けます。
$102を明確に上抜けると、より強いトレンド反転を示し、長期的な見通しは再び強気に戻ります。
注目レベル:
サポート:$62
EMA20のレジスタンス:$73
目標1:$79
EMA50 / 目標2:$86
主要レジスタンス:$102
価格は依然として20日EMAと50日EMAの両方を下回っており、より広いトレンドはまだ慎重です。
$62のサポートが維持される限り、リカバリーのシナリオは成り立ったままです。
$73付近の20日EMAを奪回できれば、最初の強気の確認となり、$79、さらに$86付近の50日EMAへの道が開けます。
$102を明確に上抜けると、より強いトレンド反転を示し、長期的な見通しは再び強気に戻ります。
注目レベル:
サポート:$62
EMA20のレジスタンス:$73
目標1:$79
EMA50 / 目標2:$86
主要レジスタンス:$102
118
·
--
ブリッシュ
📊 月曜キックオフ。
今週注目すべきBTCの水準
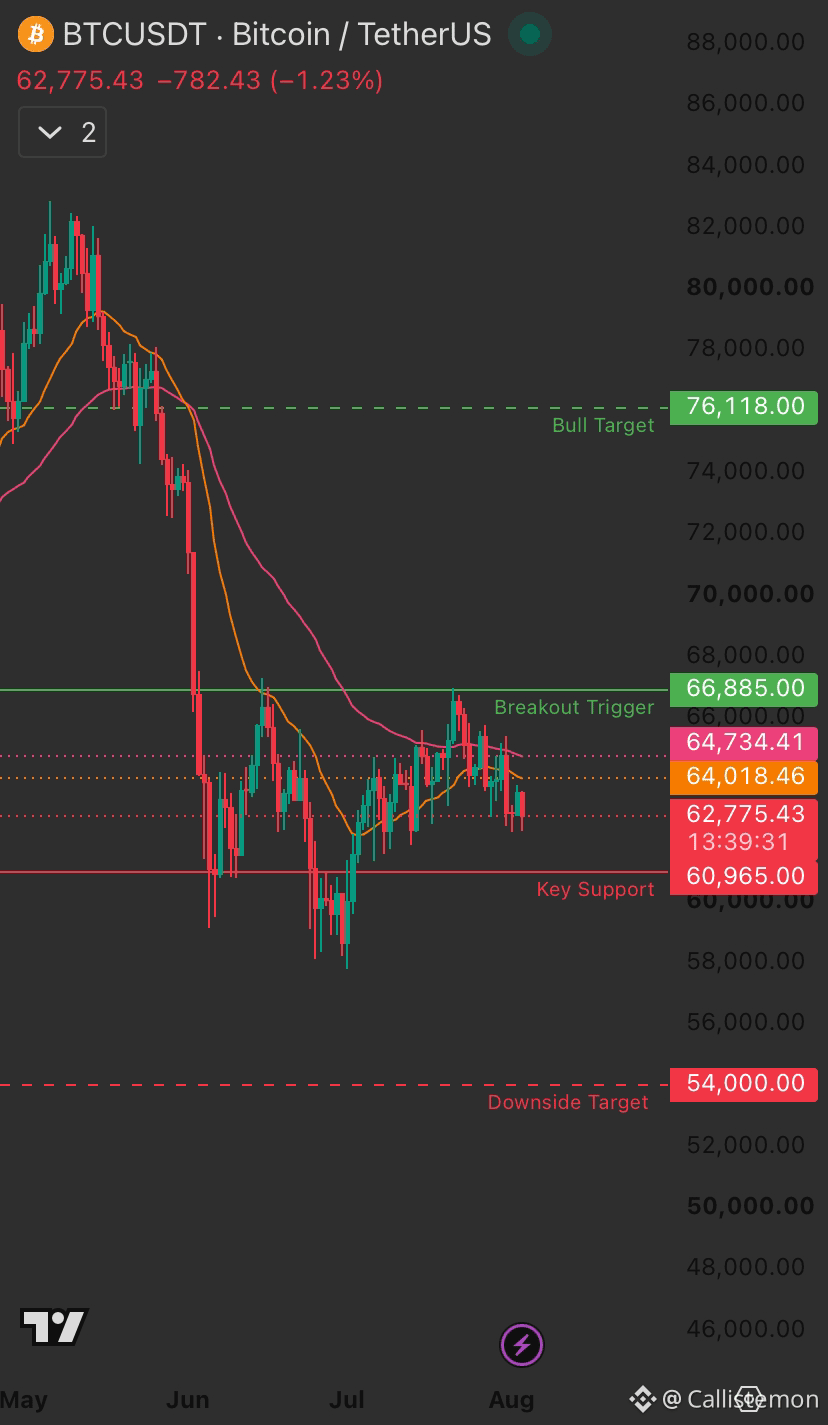
BTCは週明けに$62,775(-1.23%)でスタートし、$60,965〜$66,885のレンジ内の“もみ合いゾーン”ど真ん中に位置しています。現時点では明確な方向感はありませんが、まさにここが注目すべき範囲です。
セットアップ:
🟢 $66,885(ブレイクアウトのトリガー)を上抜ける3日間の終値で、強気のモメンタムが回復し、$76,118(ブルターゲット)への道が開ける可能性
🔴 $60,965(重要サポート)を下抜けると、下方向へのリスクが顕在化し、$54,000に向かう展開
今週これが重要な理由:今週の最大のマクロ材料は、金曜日の米雇用統計です。弱めの内容なら、暗号資産のようなリスク資産にとっては最良のシナリオになり得ます。景気後退への警戒感が和らぎ、雇用の伸びが冷えれば、利下げ期待を後押しする傾向があります。
また、念のため押さえておきたい点:8月は歴史的にビットコインにとって最も弱い月の一つです。ここで少し慎重になるのは不自然ではありません。もちろん、同じことが繰り返されるとは限りませんが、状況としての文脈です。
どちらに傾いていますか?ブレイクアウトか、それともブレイクダウンか? 👇$BTC
{future}(BTCUSDT)
📊 月曜キックオフ。
今週注目すべきBTCの水準
BTCは週明けに$62,775(-1.23%)でスタートし、$60,965〜$66,885のレンジ内の“もみ合いゾーン”ど真ん中に位置しています。現時点では明確な方向感はありませんが、まさにここが注目すべき範囲です。
セットアップ:
🟢 $66,885(ブレイクアウトのトリガー)を上抜ける3日間の終値で、強気のモメンタムが回復し、$76,118(ブルターゲット)への道が開ける可能性
🔴 $60,965(重要サポート)を下抜けると、下方向へのリスクが顕在化し、$54,000に向かう展開
今週これが重要な理由:今週の最大のマクロ材料は、金曜日の米雇用統計です。弱めの内容なら、暗号資産のようなリスク資産にとっては最良のシナリオになり得ます。景気後退への警戒感が和らぎ、雇用の伸びが冷えれば、利下げ期待を後押しする傾向があります。
また、念のため押さえておきたい点:8月は歴史的にビットコインにとって最も弱い月の一つです。ここで少し慎重になるのは不自然ではありません。もちろん、同じことが繰り返されるとは限りませんが、状況としての文脈です。
どちらに傾いていますか?ブレイクアウトか、それともブレイクダウンか? 👇$BTC
今週注目すべきBTCの水準
BTCは週明けに$62,775(-1.23%)でスタートし、$60,965〜$66,885のレンジ内の“もみ合いゾーン”ど真ん中に位置しています。現時点では明確な方向感はありませんが、まさにここが注目すべき範囲です。
セットアップ:
🟢 $66,885(ブレイクアウトのトリガー)を上抜ける3日間の終値で、強気のモメンタムが回復し、$76,118(ブルターゲット)への道が開ける可能性
🔴 $60,965(重要サポート)を下抜けると、下方向へのリスクが顕在化し、$54,000に向かう展開
今週これが重要な理由:今週の最大のマクロ材料は、金曜日の米雇用統計です。弱めの内容なら、暗号資産のようなリスク資産にとっては最良のシナリオになり得ます。景気後退への警戒感が和らぎ、雇用の伸びが冷えれば、利下げ期待を後押しする傾向があります。
また、念のため押さえておきたい点:8月は歴史的にビットコインにとって最も弱い月の一つです。ここで少し慎重になるのは不自然ではありません。もちろん、同じことが繰り返されるとは限りませんが、状況としての文脈です。
どちらに傾いていますか?ブレイクアウトか、それともブレイクダウンか? 👇$BTC
95
·
--
ブリッシュ
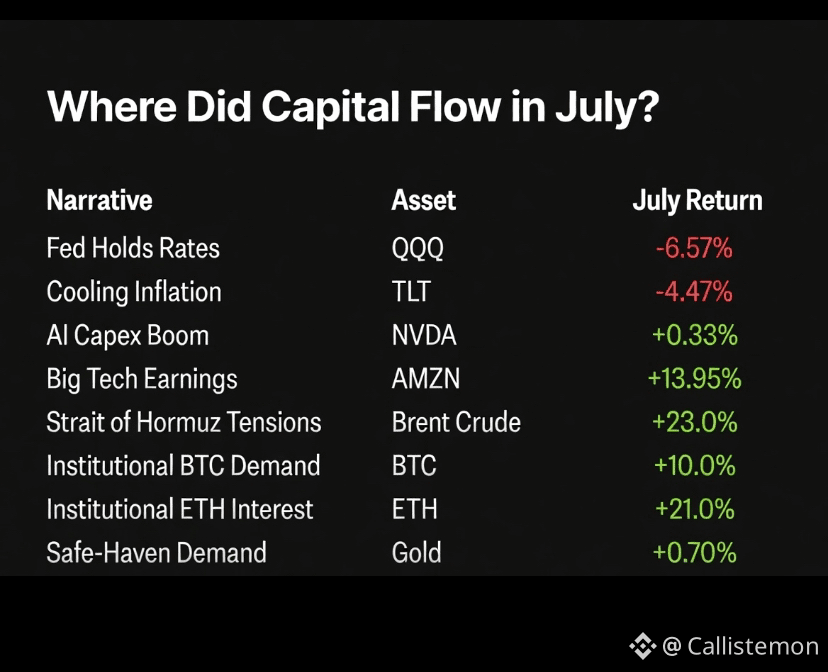
7月の資本を動かした8つのナラティブ
7月が過ぎ、新しい取引月が始まった今、シンプルな問いを立てる価値があります。
一体、何が市場を動かしたのか?
答えは、単一の見出しではありませんでした。マクロ政策、決算、地政学、そして機関投資家の資本の組み合わせがもたらしたものです。
7月は、幅広い買いによるものというより、選別的な資本配分によって動く市場を浮き彫りにしました。
月間で最も好調だったのは次の通りです:
ブレント原油:+23%
イーサリアム:+21%
Amazon:+13.95%
ビットコイン:+10%
これらの値動きは、重要な教訓を裏づけました。資本がなぜ動くのかを理解することは、すでに価格がどこまで動いたかを眺めるだけよりも、しばしばはるかに価値が高いという点です。
8月が正式に始まりました。いま、市場は次のナラティブを探しています。
7月は、ナラティブが今も市場を動かす一方で、すべてのナラティブが同じように勝者を生むわけではないことを改めて示しました。
原油とイーサリアムは月末までに最も明確な上振れとなり、地政学と機関投資家需要が依然として支配的なテーマであることを証明しました。
8月は今始まる。次のローテーションはすでに始まっています。$CL $ETH
7月の資本を動かした8つのナラティブ
7月が過ぎ、新しい取引月が始まった今、シンプルな問いを立てる価値があります。
一体、何が市場を動かしたのか?
答えは、単一の見出しではありませんでした。マクロ政策、決算、地政学、そして機関投資家の資本の組み合わせがもたらしたものです。
7月は、幅広い買いによるものというより、選別的な資本配分によって動く市場を浮き彫りにしました。
月間で最も好調だったのは次の通りです:
ブレント原油:+23%
イーサリアム:+21%
Amazon:+13.95%
ビットコイン:+10%
これらの値動きは、重要な教訓を裏づけました。資本がなぜ動くのかを理解することは、すでに価格がどこまで動いたかを眺めるだけよりも、しばしばはるかに価値が高いという点です。
8月が正式に始まりました。いま、市場は次のナラティブを探しています。
7月は、ナラティブが今も市場を動かす一方で、すべてのナラティブが同じように勝者を生むわけではないことを改めて示しました。
原油とイーサリアムは月末までに最も明確な上振れとなり、地政学と機関投資家需要が依然として支配的なテーマであることを証明しました。
8月は今始まる。次のローテーションはすでに始まっています。$CL $ETH
7月が過ぎ、新しい取引月が始まった今、シンプルな問いを立てる価値があります。
一体、何が市場を動かしたのか?
答えは、単一の見出しではありませんでした。マクロ政策、決算、地政学、そして機関投資家の資本の組み合わせがもたらしたものです。
7月は、幅広い買いによるものというより、選別的な資本配分によって動く市場を浮き彫りにしました。
月間で最も好調だったのは次の通りです:
ブレント原油:+23%
イーサリアム:+21%
Amazon:+13.95%
ビットコイン:+10%
これらの値動きは、重要な教訓を裏づけました。資本がなぜ動くのかを理解することは、すでに価格がどこまで動いたかを眺めるだけよりも、しばしばはるかに価値が高いという点です。
8月が正式に始まりました。いま、市場は次のナラティブを探しています。
7月は、ナラティブが今も市場を動かす一方で、すべてのナラティブが同じように勝者を生むわけではないことを改めて示しました。
原油とイーサリアムは月末までに最も明確な上振れとなり、地政学と機関投資家需要が依然として支配的なテーマであることを証明しました。
8月は今始まる。次のローテーションはすでに始まっています。$CL $ETH
134
·
--
ブリッシュ
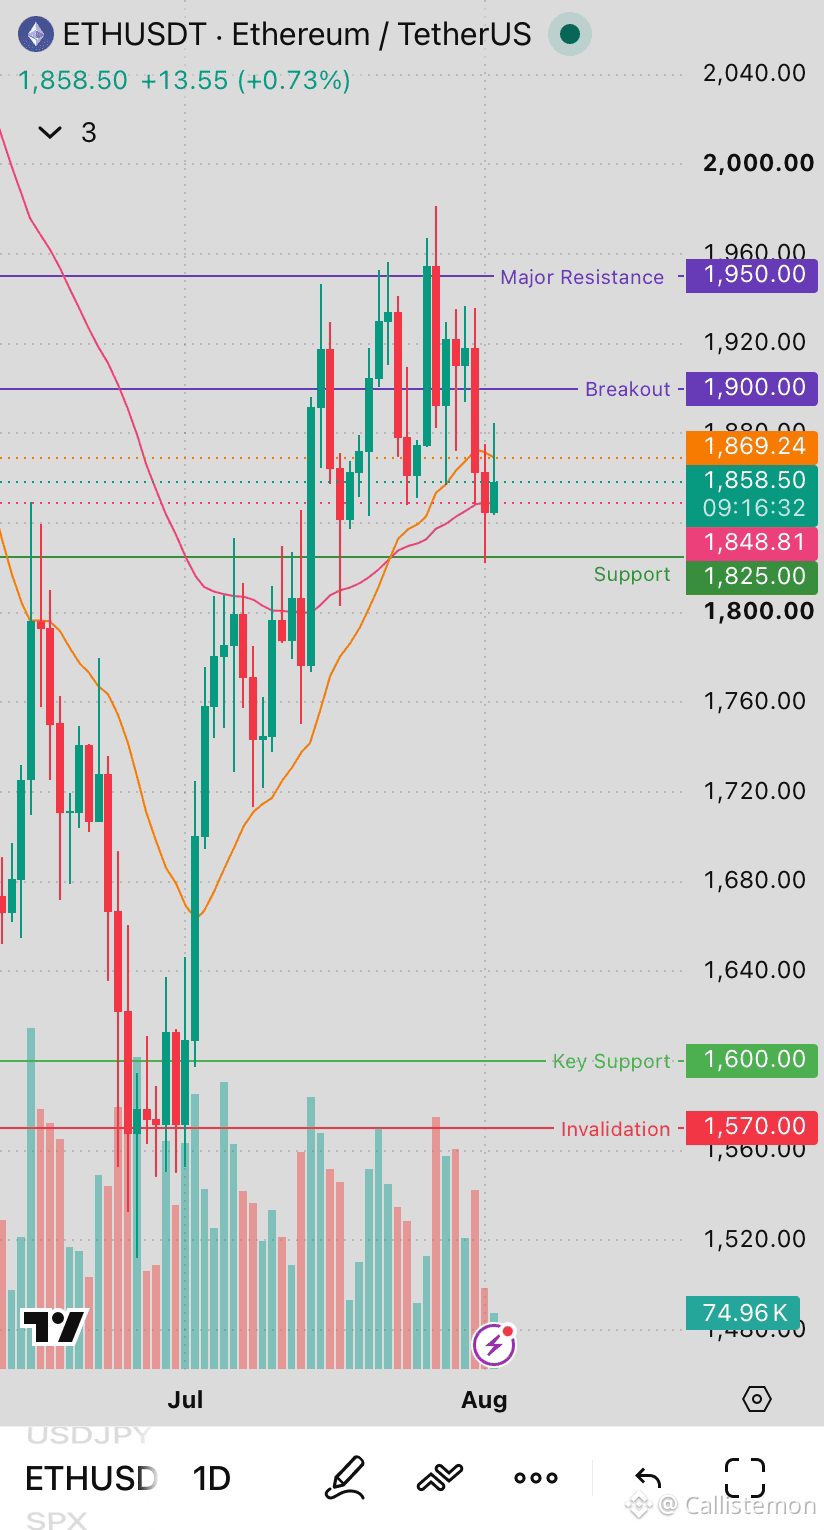
$ETH : 1900超え → 強気継続
1825未満 → より深い押し目のリスク。
イーサリアム 1D
ETHは1900のブレイクアウト・ゾーンを取り戻せずに下落した後、現在は20日EMAと1825のサポートの間の領域をテストしています。
1825が維持される限り、より大きな回復構造は維持されたままです。とはいえ、強気派は勢いを取り戻し、次の主要レジスタンスである1950への道を開くために、1900を上回る決定的な日足終値が必要です。
1825を割り込むと、短期的な売り圧力が高まりやすい一方で、高時間足の構造は1600の重要サポートの上では有効です。
🟣 主要レジスタンス: 1950
🟣 ブレイクアウト: 1900
🟢 サポート: 1825
🟢 重要サポート: 1600
🔴 無効化: 1570
$ETH : 1900超え → 強気継続
1825未満 → より深い押し目のリスク。
イーサリアム 1D
ETHは1900のブレイクアウト・ゾーンを取り戻せずに下落した後、現在は20日EMAと1825のサポートの間の領域をテストしています。
1825が維持される限り、より大きな回復構造は維持されたままです。とはいえ、強気派は勢いを取り戻し、次の主要レジスタンスである1950への道を開くために、1900を上回る決定的な日足終値が必要です。
1825を割り込むと、短期的な売り圧力が高まりやすい一方で、高時間足の構造は1600の重要サポートの上では有効です。
🟣 主要レジスタンス: 1950
🟣 ブレイクアウト: 1900
🟢 サポート: 1825
🟢 重要サポート: 1600
🔴 無効化: 1570
1825未満 → より深い押し目のリスク。
イーサリアム 1D
ETHは1900のブレイクアウト・ゾーンを取り戻せずに下落した後、現在は20日EMAと1825のサポートの間の領域をテストしています。
1825が維持される限り、より大きな回復構造は維持されたままです。とはいえ、強気派は勢いを取り戻し、次の主要レジスタンスである1950への道を開くために、1900を上回る決定的な日足終値が必要です。
1825を割り込むと、短期的な売り圧力が高まりやすい一方で、高時間足の構造は1600の重要サポートの上では有効です。
🟣 主要レジスタンス: 1950
🟣 ブレイクアウト: 1900
🟢 サポート: 1825
🟢 重要サポート: 1600
🔴 無効化: 1570
1
95
·
--
ブリッシュ
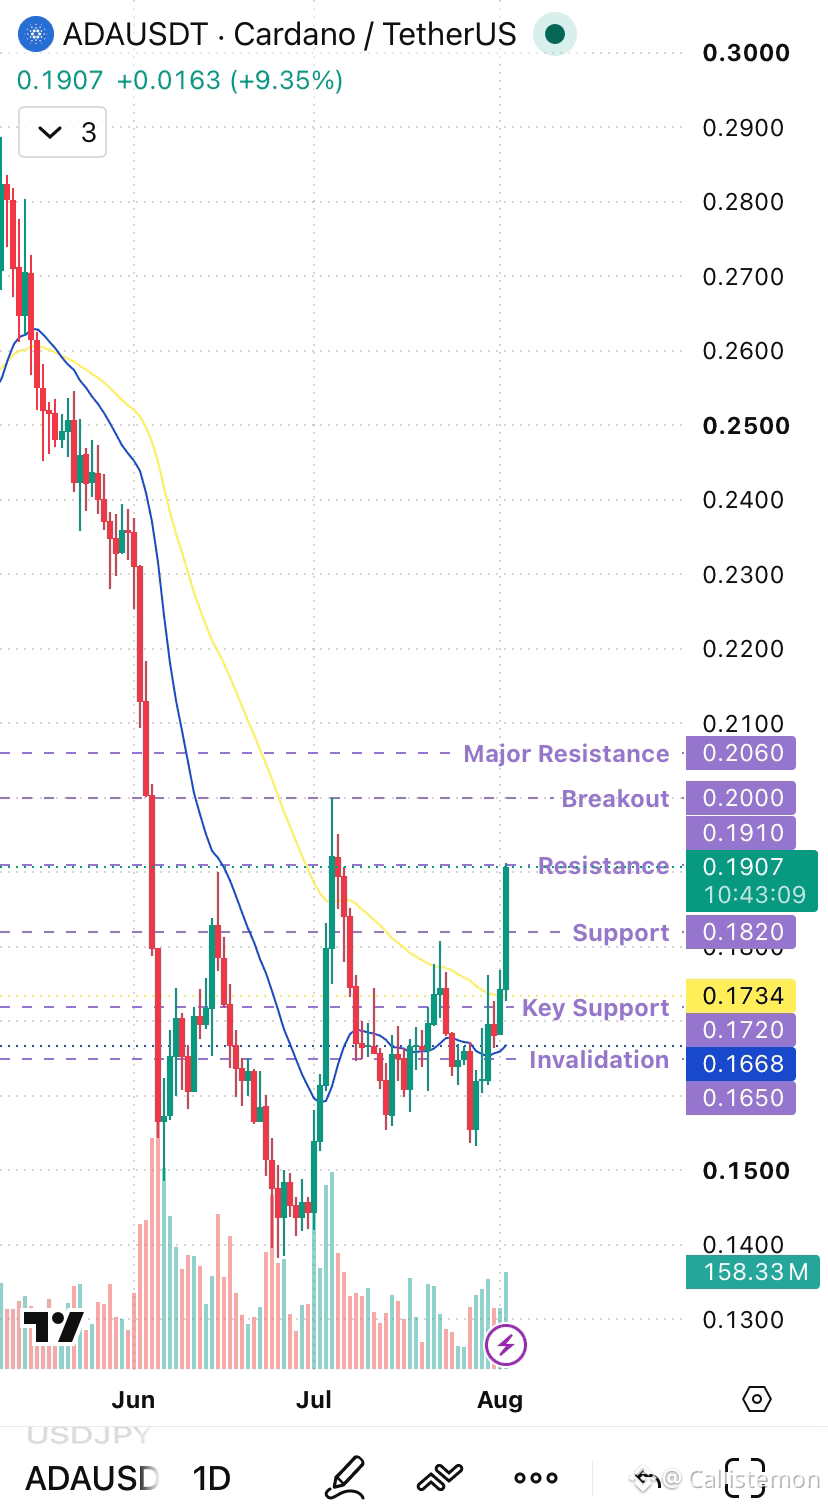
$ADA ADA/USDT デイリー設定
カルダノは、直近のレンジを上抜けた後、強気の勢いを取り戻そうとしている。
主要レベル:
🟣 レジスタンス:0.1910
🟣 ブレイクアウト:0.2000
🟣 主要レジスタンス:0.2060
🟢 サポート:0.1820
🟢 重要サポート:0.1720
🔴 無効ライン:0.1650
最新の動きは増加する出来高に裏付けられており、20日EMAは数週間ぶりに上向きへの転換を始めている。
0.2000を上回る日足終値が出れば、より大きなトレンド転換が確認されるだろう。それまでは、この動きはより大きな下降トレンドの中でのリカバリー(回復)を試している段階にとどまる。
相場は「予想」ではなく「確認」に報いる。※投資助言ではない、自己調査を。
{future}(ADAUSDT)
$ADA ADA/USDT デイリー設定
カルダノは、直近のレンジを上抜けた後、強気の勢いを取り戻そうとしている。
主要レベル:
🟣 レジスタンス:0.1910
🟣 ブレイクアウト:0.2000
🟣 主要レジスタンス:0.2060
🟢 サポート:0.1820
🟢 重要サポート:0.1720
🔴 無効ライン:0.1650
最新の動きは増加する出来高に裏付けられており、20日EMAは数週間ぶりに上向きへの転換を始めている。
0.2000を上回る日足終値が出れば、より大きなトレンド転換が確認されるだろう。それまでは、この動きはより大きな下降トレンドの中でのリカバリー(回復)を試している段階にとどまる。
相場は「予想」ではなく「確認」に報いる。※投資助言ではない、自己調査を。
カルダノは、直近のレンジを上抜けた後、強気の勢いを取り戻そうとしている。
主要レベル:
🟣 レジスタンス:0.1910
🟣 ブレイクアウト:0.2000
🟣 主要レジスタンス:0.2060
🟢 サポート:0.1820
🟢 重要サポート:0.1720
🔴 無効ライン:0.1650
最新の動きは増加する出来高に裏付けられており、20日EMAは数週間ぶりに上向きへの転換を始めている。
0.2000を上回る日足終値が出れば、より大きなトレンド転換が確認されるだろう。それまでは、この動きはより大きな下降トレンドの中でのリカバリー(回復)を試している段階にとどまる。
相場は「予想」ではなく「確認」に報いる。※投資助言ではない、自己調査を。
350
·
--
ブリッシュ
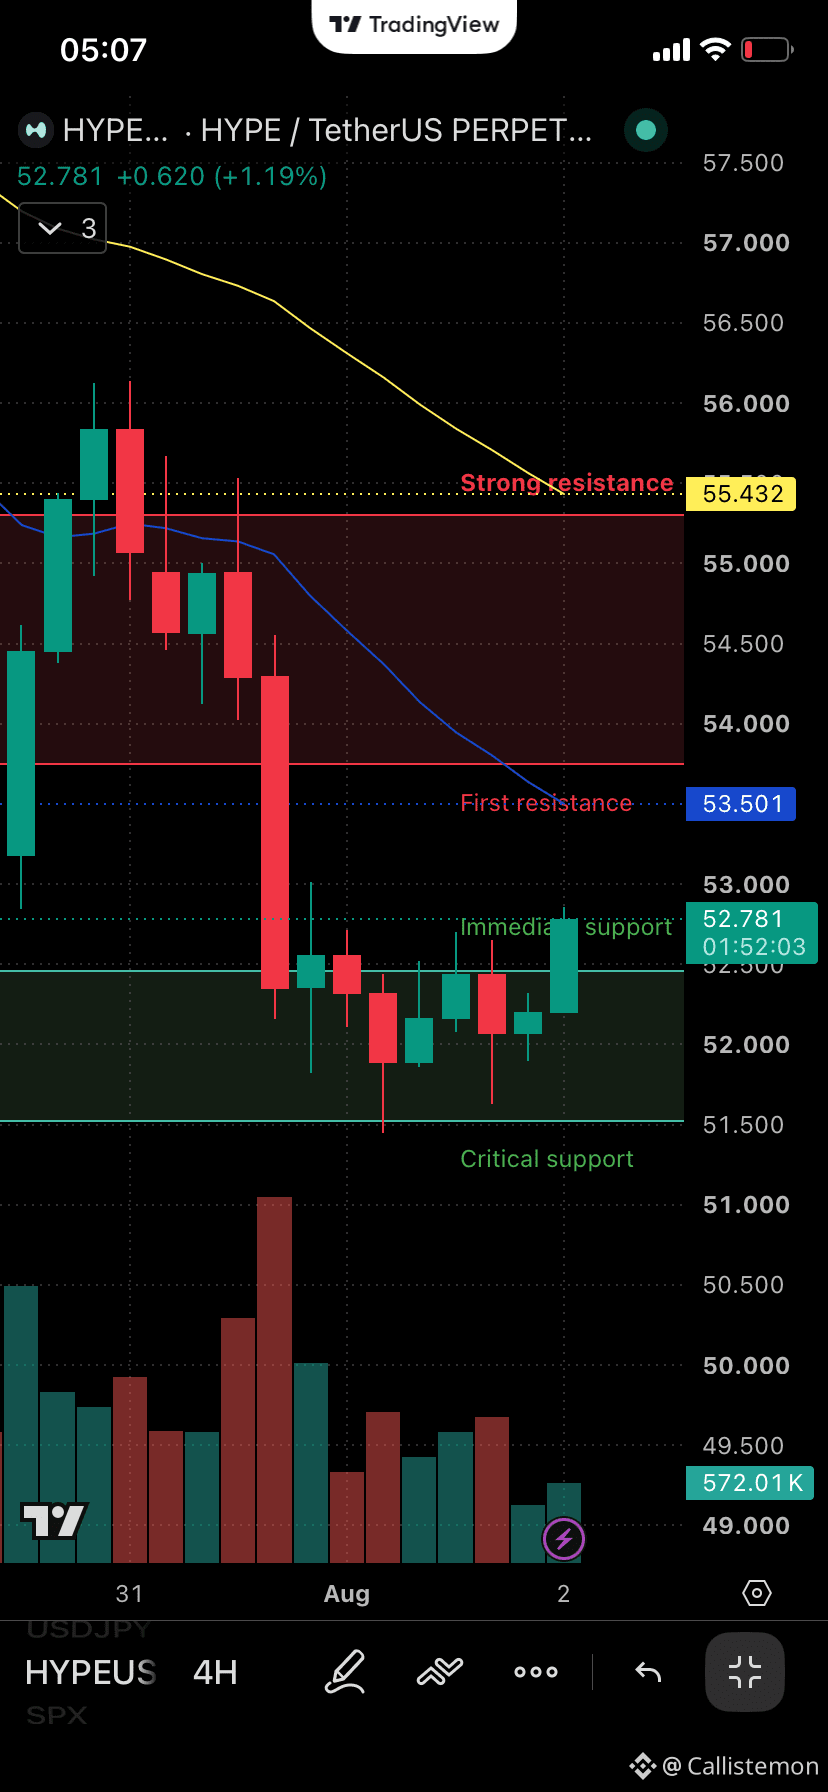
HYPE/USDT 4H チャート
トレンドは依然として弱気ですが、安値からのリリーフ反発(戻り)を試みているのが見えます。
主要な水準:
• 直近のサポート:52.44 – 52.80
• 重要なサポート:51.50
• 最初のレジスタンス:53.50
• 強いレジスタンス:55.43
強気の確認:4Hで53.50を上回ってクローズ
弱気の継続:52.40 – 51.50を下抜け
出来高はまだ弱いので、より明確な確認を待っています。
NFA $HYPE
{future}(HYPEUSDT)
HYPE/USDT 4H チャート
トレンドは依然として弱気ですが、安値からのリリーフ反発(戻り)を試みているのが見えます。
主要な水準:
• 直近のサポート:52.44 – 52.80
• 重要なサポート:51.50
• 最初のレジスタンス:53.50
• 強いレジスタンス:55.43
強気の確認:4Hで53.50を上回ってクローズ
弱気の継続:52.40 – 51.50を下抜け
出来高はまだ弱いので、より明確な確認を待っています。
NFA $HYPE
トレンドは依然として弱気ですが、安値からのリリーフ反発(戻り)を試みているのが見えます。
主要な水準:
• 直近のサポート:52.44 – 52.80
• 重要なサポート:51.50
• 最初のレジスタンス:53.50
• 強いレジスタンス:55.43
強気の確認:4Hで53.50を上回ってクローズ
弱気の継続:52.40 – 51.50を下抜け
出来高はまだ弱いので、より明確な確認を待っています。
NFA $HYPE
156
·
--
ブリッシュ
『『10月のディップ』を待つ』は戦略ではない
一部の仮想通貨のベテランは、何年も同じプランを回しています。つまり、傍観して10月を待ち、下落が予定どおりに来ることを期待する、というものです。
しかし、正直に言うとそれはプランではありません。確信のふりをしたカレンダーのリマインダーです。リスク管理は1か月を待つものではありません。水準を待ちます。トレンドラインのブレイク、サポートのテスト、そしてマクロ要因が実際に起きているか—「いつも10月だから見てみよう」ではなく。
複数のサイクルを本当に生き延びてきたトレーダーは、好きな月がある人たちではありません。カレンダーとは無関係で、その目の前のチャートに基づく無効化ポイントを持っている人たちです。
10月は戦略ではありません。ローソク足の占いです。
みんなそれぞれの“これ”がどんなものか気になります。つまり、実際にプランを定義する代わりに、あなたが待ち続けているものは何ですか?
投資助言ではありません。日曜のつぶやきです。
$BTC #CryptoCommunity #TradingMindset
『『10月のディップ』を待つ』は戦略ではない
一部の仮想通貨のベテランは、何年も同じプランを回しています。つまり、傍観して10月を待ち、下落が予定どおりに来ることを期待する、というものです。
しかし、正直に言うとそれはプランではありません。確信のふりをしたカレンダーのリマインダーです。リスク管理は1か月を待つものではありません。水準を待ちます。トレンドラインのブレイク、サポートのテスト、そしてマクロ要因が実際に起きているか—「いつも10月だから見てみよう」ではなく。
複数のサイクルを本当に生き延びてきたトレーダーは、好きな月がある人たちではありません。カレンダーとは無関係で、その目の前のチャートに基づく無効化ポイントを持っている人たちです。
10月は戦略ではありません。ローソク足の占いです。
みんなそれぞれの“これ”がどんなものか気になります。つまり、実際にプランを定義する代わりに、あなたが待ち続けているものは何ですか?
投資助言ではありません。日曜のつぶやきです。
$BTC #CryptoCommunity #TradingMindset
一部の仮想通貨のベテランは、何年も同じプランを回しています。つまり、傍観して10月を待ち、下落が予定どおりに来ることを期待する、というものです。
しかし、正直に言うとそれはプランではありません。確信のふりをしたカレンダーのリマインダーです。リスク管理は1か月を待つものではありません。水準を待ちます。トレンドラインのブレイク、サポートのテスト、そしてマクロ要因が実際に起きているか—「いつも10月だから見てみよう」ではなく。
複数のサイクルを本当に生き延びてきたトレーダーは、好きな月がある人たちではありません。カレンダーとは無関係で、その目の前のチャートに基づく無効化ポイントを持っている人たちです。
10月は戦略ではありません。ローソク足の占いです。
みんなそれぞれの“これ”がどんなものか気になります。つまり、実際にプランを定義する代わりに、あなたが待ち続けているものは何ですか?
投資助言ではありません。日曜のつぶやきです。
$BTC #CryptoCommunity #TradingMindset

113
·
--
ブリッシュ
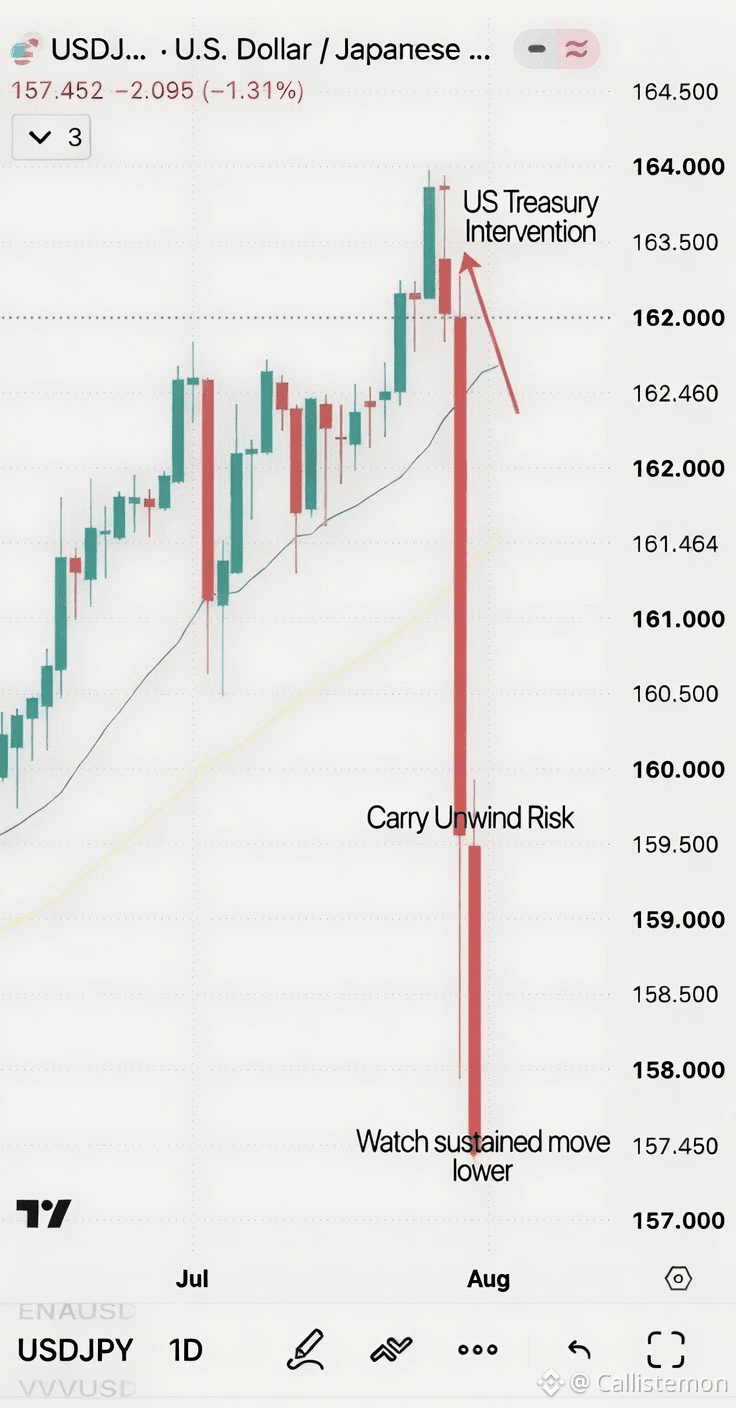
20年以上ぶりの米ドル円介入:その理由と暗号資産への意味
今日起きたのは、一見すると無関係に見えるものの、実はつながっている2つの出来事です。米国の30年国債利回りは5.28%に到達し、同時に米財務省がニューヨーク連銀を通じて円市場で円を買い支える形で直接介入を行いました。これは、日本が木曜日に通貨防衛のため約590億ドルを売却した直後のことです。米国が円市場に直接介入するのは、2十年以上ぶりです。
実際にリスク資産に効くメカニズムはこうです。円安は大部分がキャリートレードによってもたらされてきました。つまり投資家が割安な円を借りて、それをより高利回りの資産(米国株や暗号資産を含む)に投じるという構造です。この取引が利益を生むのは、円が弱い状態であり、金利が現在の水準に保たれている限りに限られます。
円を強めるための突然の、しかも協調的な動き(今日の介入はまさにそれを狙ったもの)によって、キャリートレードの巻き戻しが強制されるリスクがあります。その場合、同じ投資家は融資を返済するために円を買い戻さなければなりません。歴史的に、そのような巻き戻しは、USD/JPY自体の動きの大きさに対して暗号資産にいち早く、しかも強く影響します。直近の明確な例が2024年8月です。
さらに、30年利回りが5.28%という状況下で、長期の資金調達が高くつき成長資産全般に圧力をかけているとすると、同じ方向を向いた逆風が同時に2つ重なることになります。1つではありません。
私見では「すべて売れ」というシグナルではありませんが、「今週は通常の流動性が前提として通用しないかもしれない」というシグナルではあります。USD/JPYを注意深く見てください。円高(下方向への急激かつ持続的な動き)がはっきり出るなら、ただ脅威があるだけではなく、実際にキャリートレードの巻き戻しが進行しているサインです。
※金融助言ではありません。調べてください(dyor)
$BTC #YenIntervention #MacroWatch #CryptoAnalysis
20年以上ぶりの米ドル円介入:その理由と暗号資産への意味
今日起きたのは、一見すると無関係に見えるものの、実はつながっている2つの出来事です。米国の30年国債利回りは5.28%に到達し、同時に米財務省がニューヨーク連銀を通じて円市場で円を買い支える形で直接介入を行いました。これは、日本が木曜日に通貨防衛のため約590億ドルを売却した直後のことです。米国が円市場に直接介入するのは、2十年以上ぶりです。
実際にリスク資産に効くメカニズムはこうです。円安は大部分がキャリートレードによってもたらされてきました。つまり投資家が割安な円を借りて、それをより高利回りの資産(米国株や暗号資産を含む)に投じるという構造です。この取引が利益を生むのは、円が弱い状態であり、金利が現在の水準に保たれている限りに限られます。
円を強めるための突然の、しかも協調的な動き(今日の介入はまさにそれを狙ったもの)によって、キャリートレードの巻き戻しが強制されるリスクがあります。その場合、同じ投資家は融資を返済するために円を買い戻さなければなりません。歴史的に、そのような巻き戻しは、USD/JPY自体の動きの大きさに対して暗号資産にいち早く、しかも強く影響します。直近の明確な例が2024年8月です。
さらに、30年利回りが5.28%という状況下で、長期の資金調達が高くつき成長資産全般に圧力をかけているとすると、同じ方向を向いた逆風が同時に2つ重なることになります。1つではありません。
私見では「すべて売れ」というシグナルではありませんが、「今週は通常の流動性が前提として通用しないかもしれない」というシグナルではあります。USD/JPYを注意深く見てください。円高(下方向への急激かつ持続的な動き)がはっきり出るなら、ただ脅威があるだけではなく、実際にキャリートレードの巻き戻しが進行しているサインです。
※金融助言ではありません。調べてください(dyor)
$BTC #YenIntervention #MacroWatch #CryptoAnalysis
今日起きたのは、一見すると無関係に見えるものの、実はつながっている2つの出来事です。米国の30年国債利回りは5.28%に到達し、同時に米財務省がニューヨーク連銀を通じて円市場で円を買い支える形で直接介入を行いました。これは、日本が木曜日に通貨防衛のため約590億ドルを売却した直後のことです。米国が円市場に直接介入するのは、2十年以上ぶりです。
実際にリスク資産に効くメカニズムはこうです。円安は大部分がキャリートレードによってもたらされてきました。つまり投資家が割安な円を借りて、それをより高利回りの資産(米国株や暗号資産を含む)に投じるという構造です。この取引が利益を生むのは、円が弱い状態であり、金利が現在の水準に保たれている限りに限られます。
円を強めるための突然の、しかも協調的な動き(今日の介入はまさにそれを狙ったもの)によって、キャリートレードの巻き戻しが強制されるリスクがあります。その場合、同じ投資家は融資を返済するために円を買い戻さなければなりません。歴史的に、そのような巻き戻しは、USD/JPY自体の動きの大きさに対して暗号資産にいち早く、しかも強く影響します。直近の明確な例が2024年8月です。
さらに、30年利回りが5.28%という状況下で、長期の資金調達が高くつき成長資産全般に圧力をかけているとすると、同じ方向を向いた逆風が同時に2つ重なることになります。1つではありません。
私見では「すべて売れ」というシグナルではありませんが、「今週は通常の流動性が前提として通用しないかもしれない」というシグナルではあります。USD/JPYを注意深く見てください。円高(下方向への急激かつ持続的な動き)がはっきり出るなら、ただ脅威があるだけではなく、実際にキャリートレードの巻き戻しが進行しているサインです。
※金融助言ではありません。調べてください(dyor)
$BTC #YenIntervention #MacroWatch #CryptoAnalysis
1.4k
ログインして、さらにコンテンツを読む
厳選トピックで世界の暗号資産トレーダーの仲間入り
⚡️ 暗号資産に関する最新かつ有益な情報が見つかります。
💬 世界最大の暗号資産取引所から信頼されています。
👍 認証を受けたクリエイターから、有益なインサイトを得られます。
メール / 電話番号
トレンドトピック
FedMinutesFocusOnOctoberPause
閲覧回数 233,180
1,516人が討論中
🚨 警戒レベル引き上げ ‼️ 次の1時間は無闇に取引しないでください 🚨
皆さん、FOMC議事要旨の発表まで1時間を切りました。
今日すでに大きなボラティリティが見られたことを考えると、発表直前に誰にも無謀な高レバレッジポジションを取ってほしくありません。
私が注目している大きな反応は、ゴールド(XAU)、シルバー(XAG)、BTC、ETHです。さらにSOLのような銘柄や、レバレッジの高い時価総額が中小規模のアルトコインは、BTCの値動きを増幅させる可能性があります。
今夜は特にゴールドとシルバーに注意が必要です。市場はすでに米ドルと米国債利回りに反応しており、両方の貴金属はFRB議事要旨の発表を前に大きな圧力を受けています。
簡単に言うと、
📉タカ派的なFOMC議事要旨 → 米ドル・利回りが上昇する可能性 → BTC、暗号資産、ゴールド、シルバーに下押し圧力
📈ハト派的なFOMC議事要旨 → 米ドル・利回りが落ち着く可能性 → BTC、ゴールド、シルバー、リスク資産が大きく反発する可能性があります。
そして、最初のローソク足が罠になることもあるので忘れないでください。一度急騰してすぐに急落し、両方向で清算が起きてから、本当の方向性が見えてくることもあります。
今はポジションを守り、不要なレバレッジを減らし、最初の値動きにFOMOで飛び乗らないようにしてください。
今夜はまず$XAU 、$XAG 、$BTC を注視しています。これらの動きを見れば、市場がFRBの発表をどう受け止めているか、すぐに分かるでしょう。
時間どおりに皆さんに最新情報をお知らせします。
@Panda Traders をフォローして、今すぐ通知をオンにしてください。
#FedMinutesFocusOnOctoberPause
Panda Traders
·いいね:19件
·閲覧回数 4.4k
BinanceLaunchesBinanceIntelligence
閲覧回数 1.2M
6,688人が討論中
EvernorthDelaysNasdaqDebutToOct12
閲覧回数 26,567
366人が討論中