
TEKT0NIC 1
1.1k 投稿

TEKT0NIC 1
報告
ユーザーをブロック
Passionate about crypto and blockchain | Crypto Enthusiastic | Technical Analysis | Fundamental News
0 フォロー
8 フォロワー
37 いいね
投稿
·
--
翻訳参照
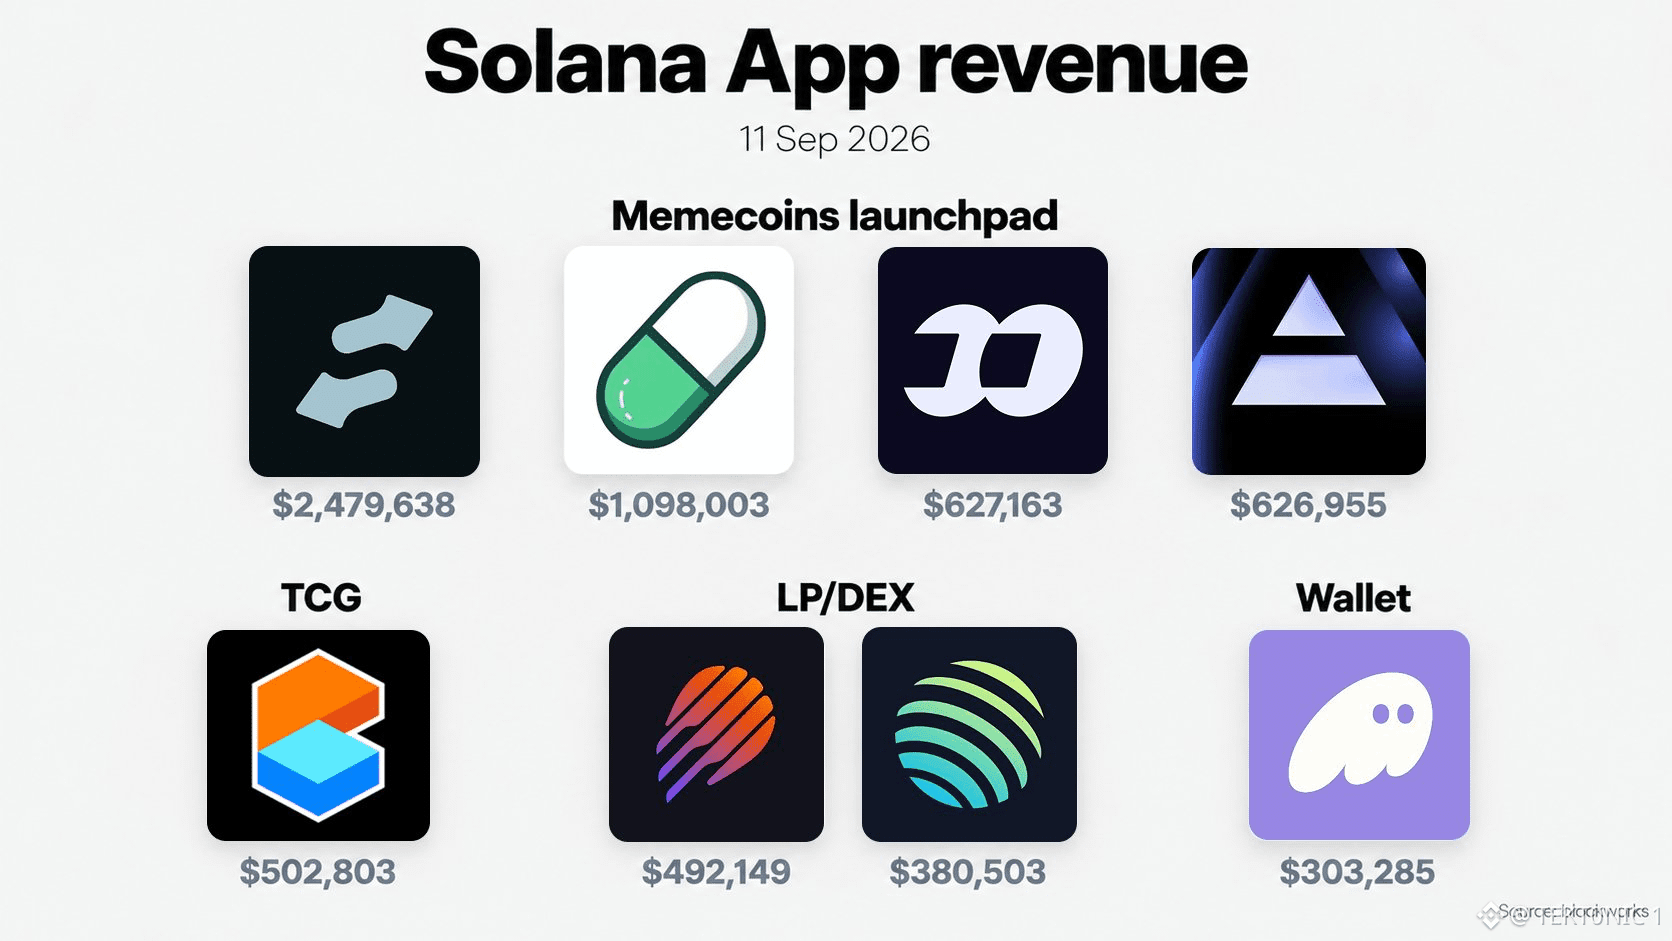
solana apps just hit a new yearly high in daily revenue. around $7.93m was generated over 24 hours, making it the strongest single day for Solana apps so far in 2026. and the money isn’t coming from one app. > $2.48m — memecoin launchpad > $1.10m — memecoin launchpad > $627k — memecoin launchpad > $627k — another launchpad > $503k — TCG > $492k — LP/DEX > $381k — LP/DEX > $303k — wallet Solana apps also generated $143m in August, accounting for roughly 38% of global blockchain app revenue that month. the latest spike shows how much economic activity is still happening directly on Solana. memecoin trading is doing a lot of the heavy lifting, but DEXs, launchpads and wallets are also generating meaningful revenue. $7.93m in one day is a serious number. and Solana is still pushing higher. #BTC Price Analysis# #Bitcoin Price Prediction: What is Bitcoins next move?# $BTC $SOL #Bullish
solana apps just hit a new yearly high in daily revenue. around $7.93m was generated over 24 hours, making it the strongest single day for Solana apps so far in 2026. and the money isn’t coming from one app. > $2.48m — memecoin launchpad > $1.10m — memecoin launchpad > $627k — memecoin launchpad > $627k — another launchpad > $503k — TCG > $492k — LP/DEX > $381k — LP/DEX > $303k — wallet Solana apps also generated $143m in August, accounting for roughly 38% of global blockchain app revenue that month. the latest spike shows how much economic activity is still happening directly on Solana. memecoin trading is doing a lot of the heavy lifting, but DEXs, launchpads and wallets are also generating meaningful revenue. $7.93m in one day is a serious number. and Solana is still pushing higher. #BTC Price Analysis# #Bitcoin Price Prediction: What is Bitcoins next move?# $BTC $SOL #Bullish
1
·
--
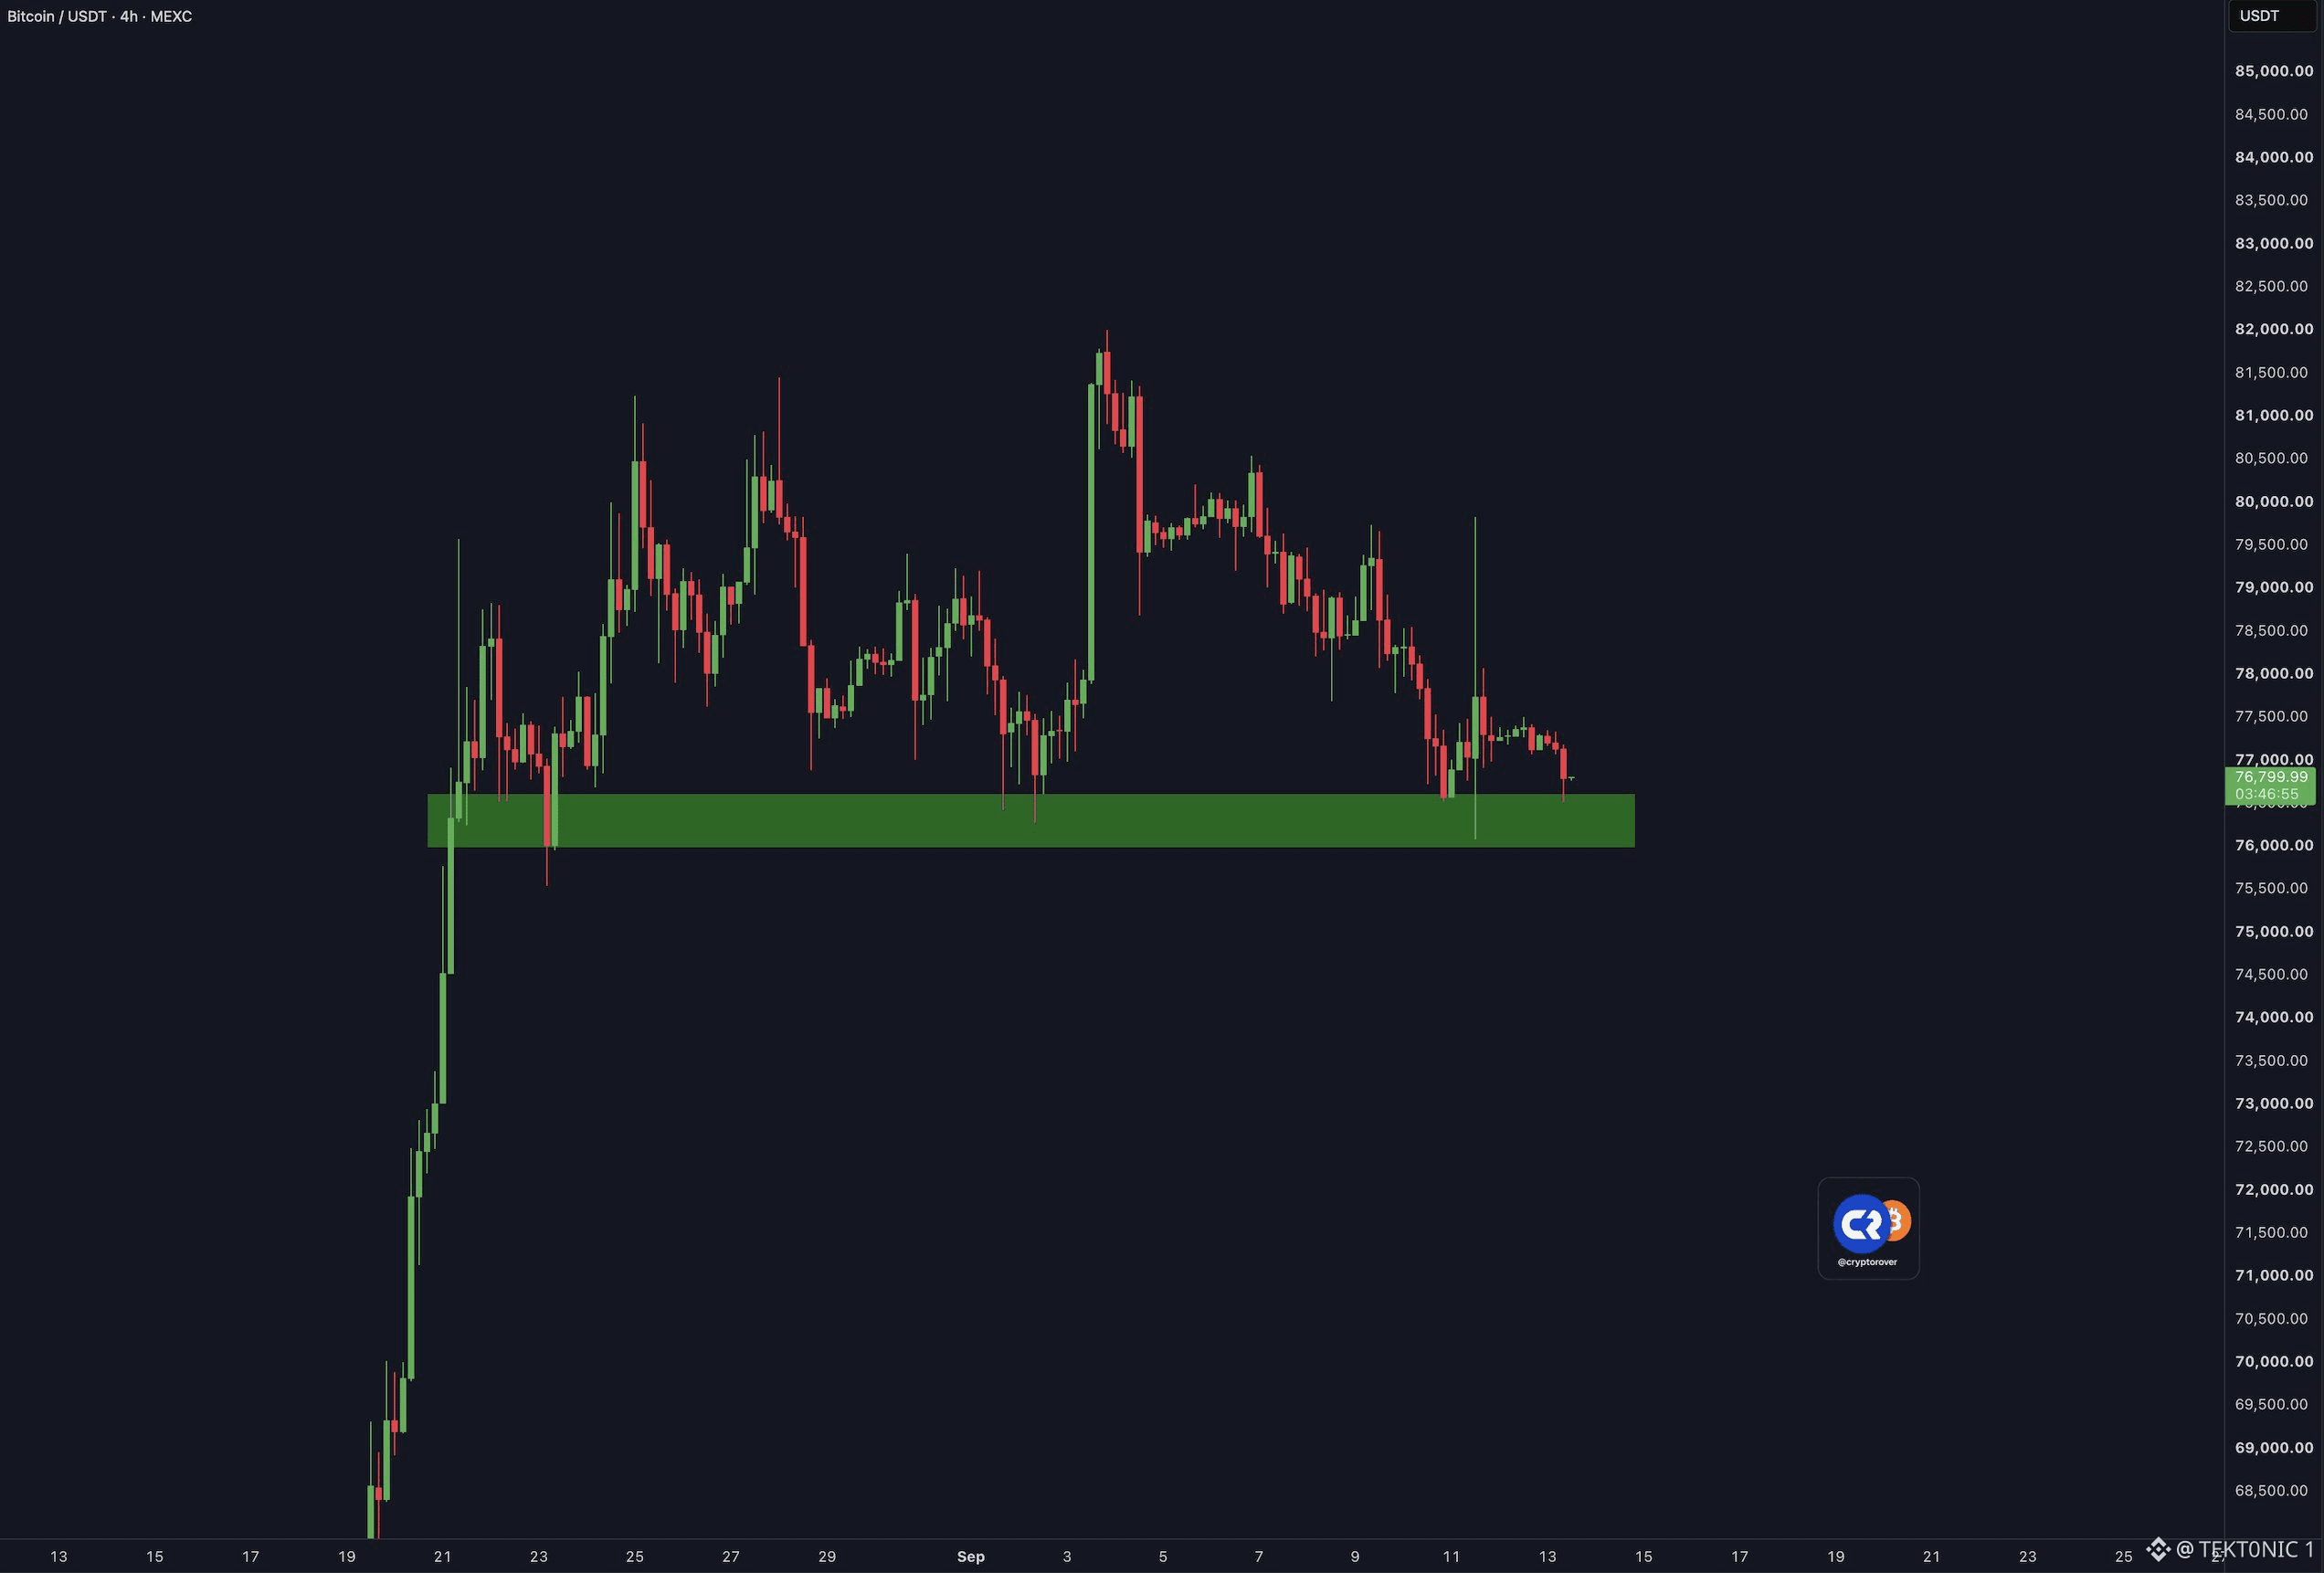
ビットコインは、8月のリバウンドを生んだ「7万6,000ドルの棚」の上に座っている――その箱は最初のラインだ。これを失えば、次の目標はより下になる。4時間足チャートによると、$BTC は約76,800ドルで、8月中旬の高値(6万8,000ドル台)からの急騰以来維持されてきた緑の需要ゾーンの上に位置している。この棚の上のレンジは、約82,000ドル付近で上限に達している。もし76,000ドルが崩れると、この見立てで次に来るのは72,000~74,000ドルだ。 重要ポイント: 現在の価格:約76,800ドル。 支持ボックス:約76,000~76,700ドル(スパイク後のレンジの土台)。 レンジ上限:約82,000ドル。 ボックスが崩れた場合の下値:72,000~74,000ドル。 ここで踏みとどまれば、リバウンドは来週のFOMC(FRB)会合まで維持される。76,000ドルを下回る4時間終値が出れば、「8月の需要は消え、8万ドルはただのテストだった」という見方になる。72,000~74,000ドルはクラッシュ目標ではない。これは、もしこの棚が提供されるなら次に来る棚だ。 76,800ドルのレンジ・サポート上のビットコイン――72K~74Kの突破で開く #BTC Price Analysis# #Bitcoin Price Prediction: ビットコインの次の一手は?# $BTC $ETH
ビットコインは、8月のリバウンドを生んだ「7万6,000ドルの棚」の上に座っている――その箱は最初のラインだ。これを失えば、次の目標はより下になる。4時間足チャートによると、$BTC は約76,800ドルで、8月中旬の高値(6万8,000ドル台)からの急騰以来維持されてきた緑の需要ゾーンの上に位置している。この棚の上のレンジは、約82,000ドル付近で上限に達している。もし76,000ドルが崩れると、この見立てで次に来るのは72,000~74,000ドルだ。 重要ポイント: 現在の価格:約76,800ドル。 支持ボックス:約76,000~76,700ドル(スパイク後のレンジの土台)。 レンジ上限:約82,000ドル。 ボックスが崩れた場合の下値:72,000~74,000ドル。 ここで踏みとどまれば、リバウンドは来週のFOMC(FRB)会合まで維持される。76,000ドルを下回る4時間終値が出れば、「8月の需要は消え、8万ドルはただのテストだった」という見方になる。72,000~74,000ドルはクラッシュ目標ではない。これは、もしこの棚が提供されるなら次に来る棚だ。 76,800ドルのレンジ・サポート上のビットコイン――72K~74Kの突破で開く #BTC Price Analysis# #Bitcoin Price Prediction: ビットコインの次の一手は?# $BTC $ETH
·
--
今週は5日間で5本のマクロ材料が集中 カレンダーは埋まりぎっしり。米連邦準備制度(FRB)の会合が依然として最大の注目点。 9月14〜18日の週次先取りリストによると、月曜はテック/AIの支出カット見出し。火曜は「Clarity Act(明確化法)」に関する上院の採決が予定されている。水曜はFRBの政策金利決定。木曜は米国の住宅指標。金曜は日本のCPIと日銀の決定。 注目ポイント: > 9月14日(月):テック/AIの支出カット。 > 9月15日(火):Clarity Actの上院採決。 > 9月16日(水):FRBの金利決定。 > 9月17日(木):米国の住宅指標。 > 9月18日(金):日本のCPIと日銀の決定。 ビットコインは米CPIが市場予想通りだった後、7万ドル台後半〜中盤に位置している。水曜のFRB声明がタカ派的なら、そのクッションは薄い。据え置き+Clarityの採決という組み合わせは、強気派が望むもの。一方、利上げ+弱い住宅指標という組み合わせは、通常8万ドルを再び手の届かない水準へ押し戻す。 週の予定:Clarity採決(火)、FRB(水)、日銀(金) あなたは水曜のFRB決定に向けてリスクを切り込むのか、それとも5日間まるごと保有し続けるのか? #BTC価格分析# #ビットコイン価格予測:次の動きは?# $BTC $ETH
今週は5日間で5本のマクロ材料が集中 カレンダーは埋まりぎっしり。米連邦準備制度(FRB)の会合が依然として最大の注目点。 9月14〜18日の週次先取りリストによると、月曜はテック/AIの支出カット見出し。火曜は「Clarity Act(明確化法)」に関する上院の採決が予定されている。水曜はFRBの政策金利決定。木曜は米国の住宅指標。金曜は日本のCPIと日銀の決定。 注目ポイント: > 9月14日(月):テック/AIの支出カット。 > 9月15日(火):Clarity Actの上院採決。 > 9月16日(水):FRBの金利決定。 > 9月17日(木):米国の住宅指標。 > 9月18日(金):日本のCPIと日銀の決定。 ビットコインは米CPIが市場予想通りだった後、7万ドル台後半〜中盤に位置している。水曜のFRB声明がタカ派的なら、そのクッションは薄い。据え置き+Clarityの採決という組み合わせは、強気派が望むもの。一方、利上げ+弱い住宅指標という組み合わせは、通常8万ドルを再び手の届かない水準へ押し戻す。 週の予定:Clarity採決(火)、FRB(水)、日銀(金) あなたは水曜のFRB決定に向けてリスクを切り込むのか、それとも5日間まるごと保有し続けるのか? #BTC価格分析# #ビットコイン価格予測:次の動きは?# $BTC $ETH

·
--
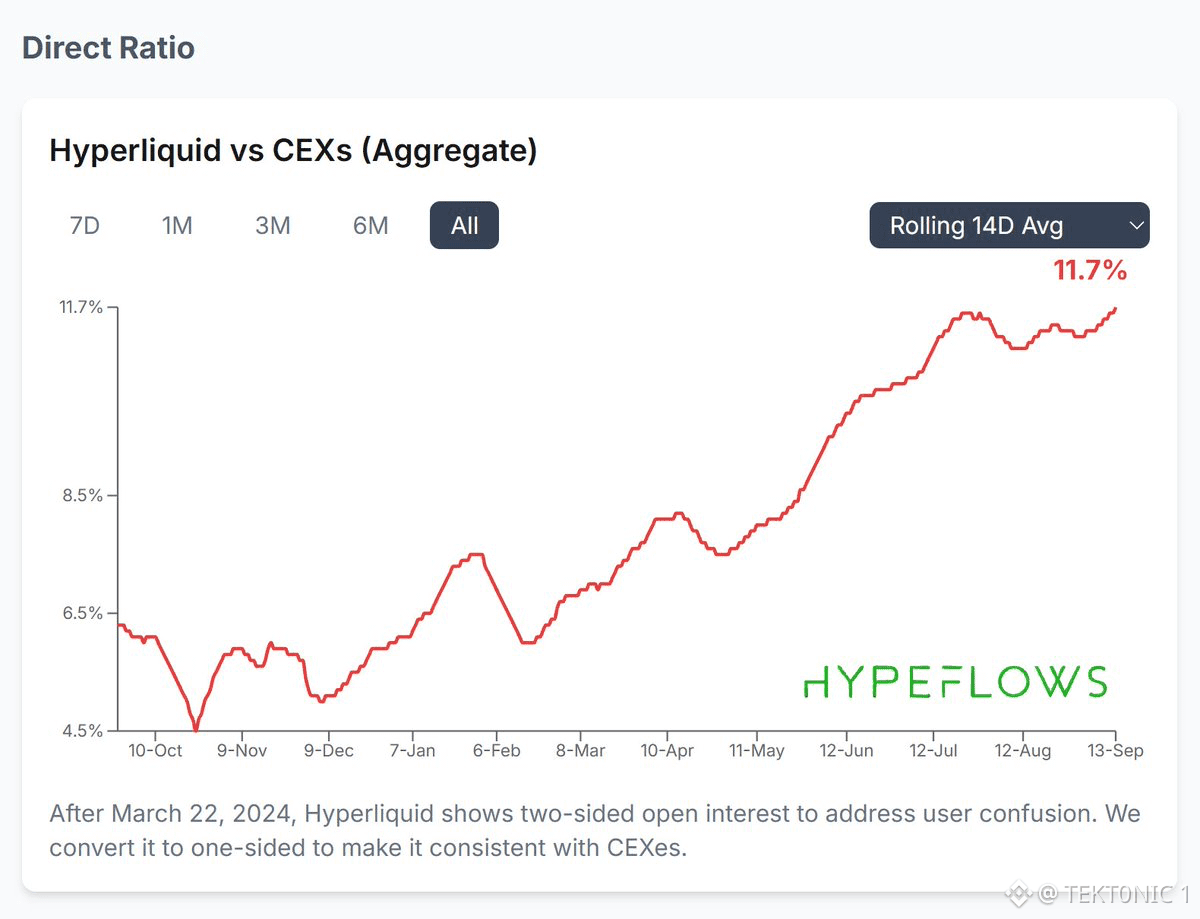
これは、2030年の「Hyperliquid」論に注目する価値があることを示すようなチャートです。主要なCEXに対する、Hyperliquidのパーペチュアル(perp)建玉の比率が新たに過去最高(ATH)となり、11.7%に到達しました。ちなみにこの数字は、今年の前半はまだ6〜7%程度でした。そして、長期的なモデルではさらに強気な見方が出ています。ある研究フレームワークでは、Hyperliquidが2032年までにDEXのperp出来高の約50%に到達すると見ており、強気シナリオでは60%です。より大きな論点はシンプルです:
> オンチェーン上での取引が増える
> Hyperliquidがシェアを奪い続ける
> 新しい市場が、アドレサブル・マーケットを拡大する
HIP-3はすでに暗号資産を超えて、株式・商品・FX・指数へ広がっており、HIP-4では予測市場(Prediction Markets)が追加されます。だから、今日の11.7%は、2030年にどこまで到達し得るかを考えるなら小さく見えるかもしれません。もしHyperliquidがCEXからシェアを奪い続けるなら、早い段階でのポジショニングが重要になります。私は $HYPE には特に注目しています。 #BTC Price Analysis# #HyperLiquid #Altcoin Season# $BTC $HYPE #Bullish
これは、2030年の「Hyperliquid」論に注目する価値があることを示すようなチャートです。主要なCEXに対する、Hyperliquidのパーペチュアル(perp)建玉の比率が新たに過去最高(ATH)となり、11.7%に到達しました。ちなみにこの数字は、今年の前半はまだ6〜7%程度でした。そして、長期的なモデルではさらに強気な見方が出ています。ある研究フレームワークでは、Hyperliquidが2032年までにDEXのperp出来高の約50%に到達すると見ており、強気シナリオでは60%です。より大きな論点はシンプルです:
> オンチェーン上での取引が増える
> Hyperliquidがシェアを奪い続ける
> 新しい市場が、アドレサブル・マーケットを拡大する
HIP-3はすでに暗号資産を超えて、株式・商品・FX・指数へ広がっており、HIP-4では予測市場(Prediction Markets)が追加されます。だから、今日の11.7%は、2030年にどこまで到達し得るかを考えるなら小さく見えるかもしれません。もしHyperliquidがCEXからシェアを奪い続けるなら、早い段階でのポジショニングが重要になります。私は $HYPE には特に注目しています。 #BTC Price Analysis# #HyperLiquid #Altcoin Season# $BTC $HYPE #Bullish
> オンチェーン上での取引が増える
> Hyperliquidがシェアを奪い続ける
> 新しい市場が、アドレサブル・マーケットを拡大する
HIP-3はすでに暗号資産を超えて、株式・商品・FX・指数へ広がっており、HIP-4では予測市場(Prediction Markets)が追加されます。だから、今日の11.7%は、2030年にどこまで到達し得るかを考えるなら小さく見えるかもしれません。もしHyperliquidがCEXからシェアを奪い続けるなら、早い段階でのポジショニングが重要になります。私は $HYPE には特に注目しています。 #BTC Price Analysis# #HyperLiquid #Altcoin Season# $BTC $HYPE #Bullish
25
·
--
翻訳参照
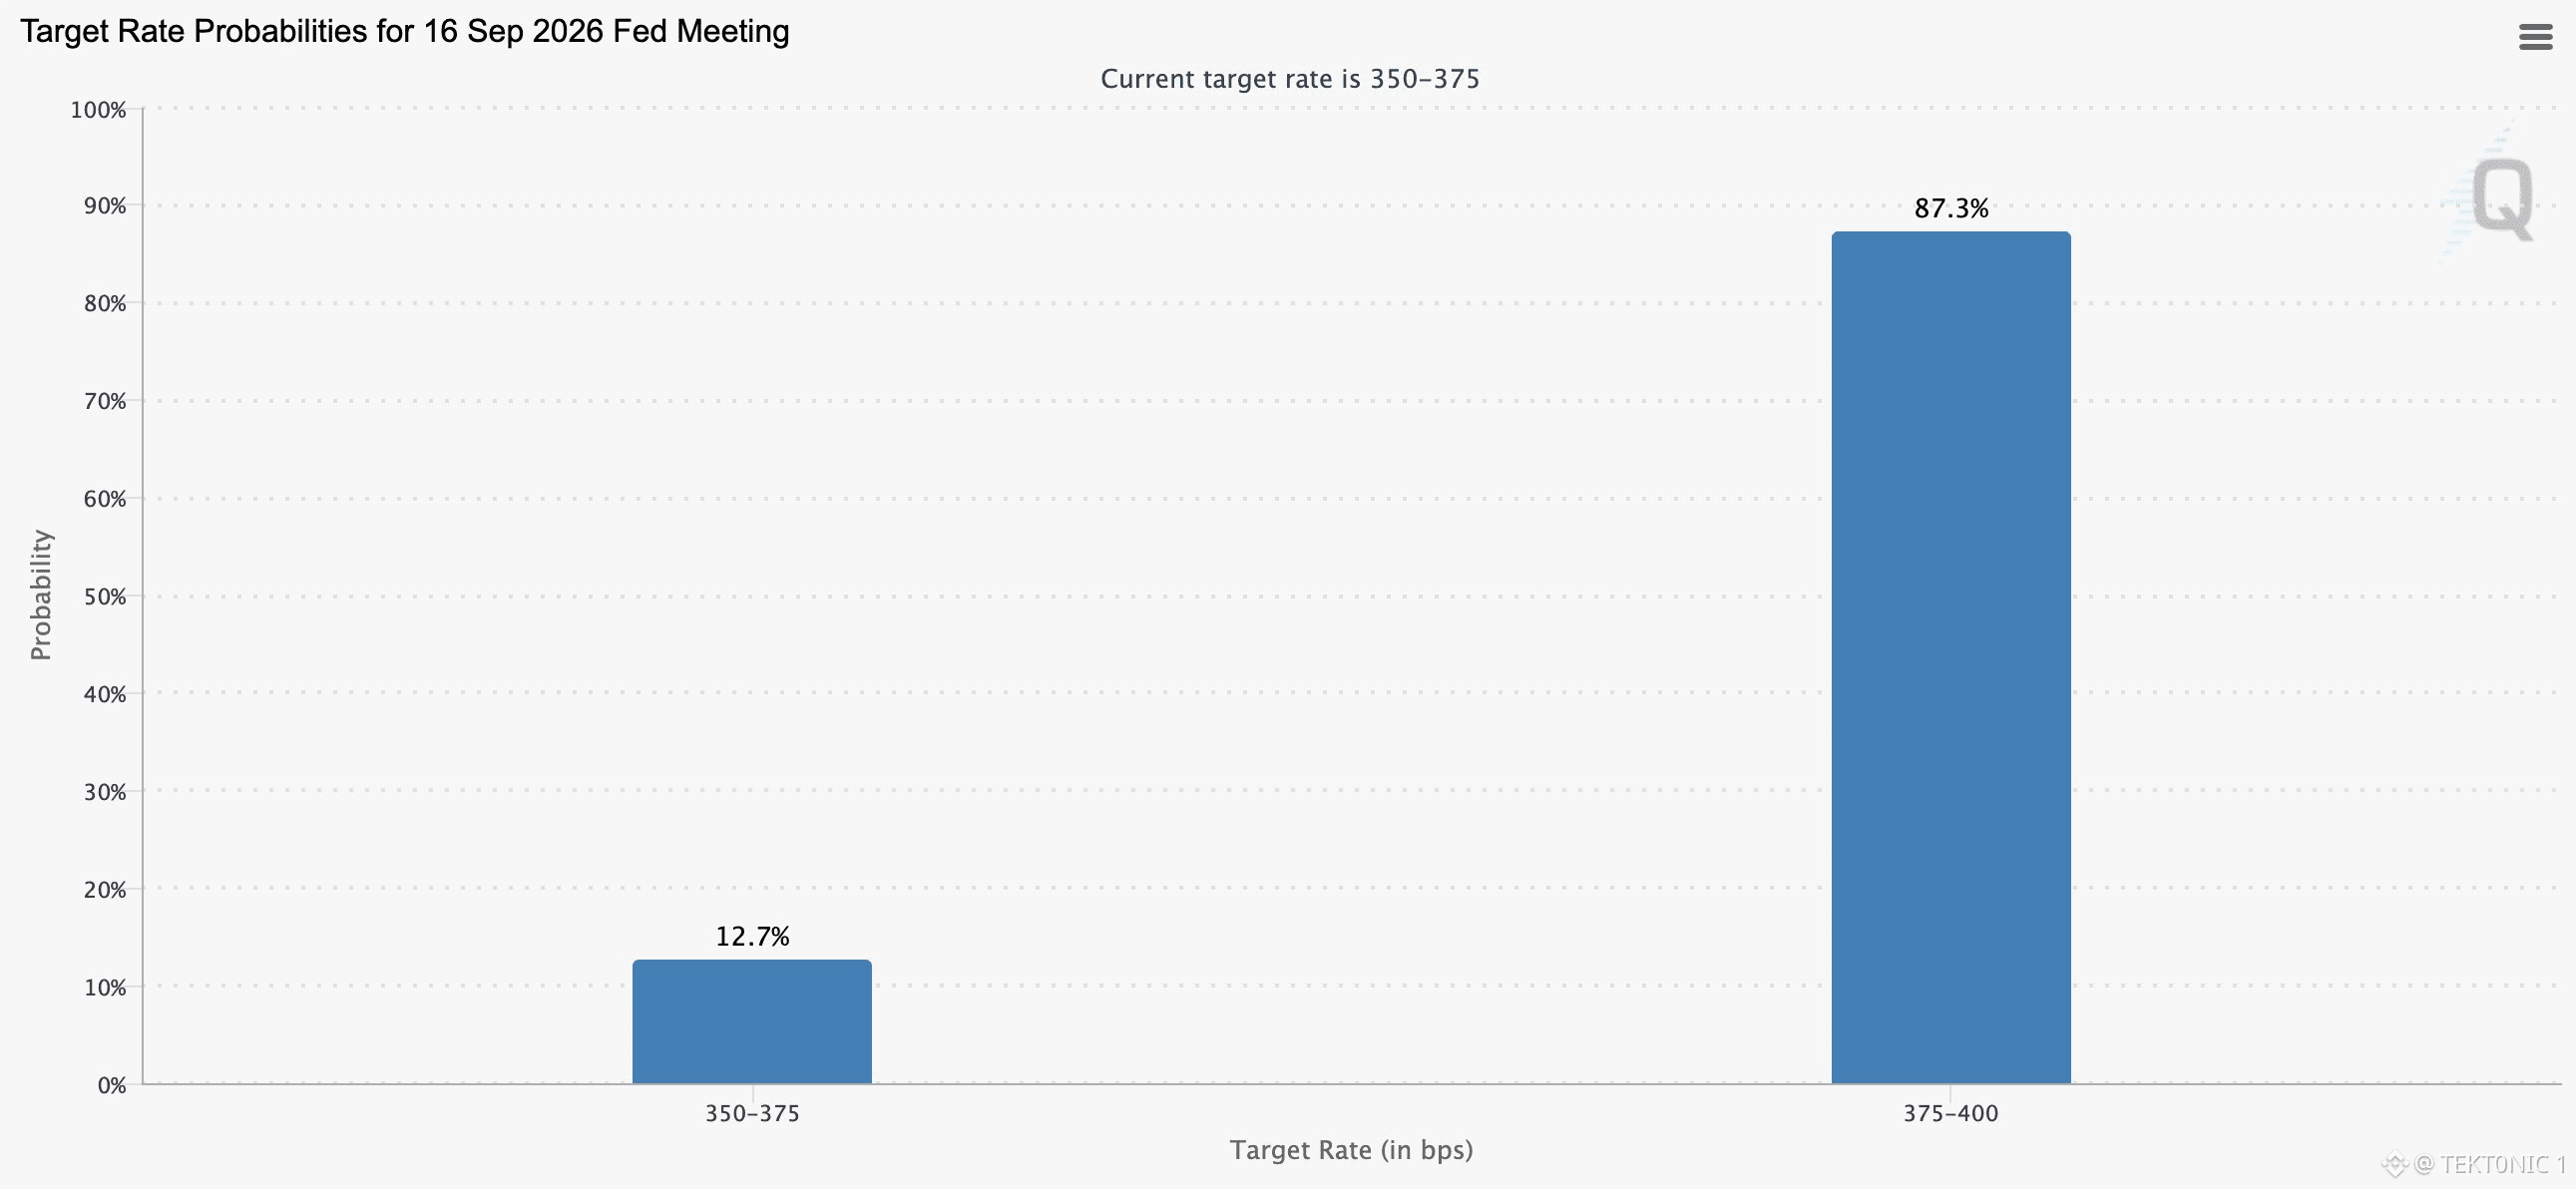
the Fed meeting is September 16. the market is not pricing a hold. current target is 350–375 bps. CME-style odds put 87.3% on 375–400. that is a 25 bp hike. only 12.7% is left on unchanged. three days out, a hike is the base case. that is tighter policy, not easier liquidity. $BTC has already been trading that risk. the hot jobs print pulled rate-cut hopes and sold the bounce. a priced-in hike can still move coins if the statement is hawkish. a hold would be the shock. the catch: 87% is not 100%. if they stay at 350–375, shorts on the hike narrative get squeezed. if they hike and talk higher for longer, the $78,000 failed hold gets harder to reclaim. so the event is not “maybe later.” it is this week. the bid has to live with 375–400 as the default. #BTC Price Analysis# #Bitcoin Price Prediction: What is Bitcoins next move?# $BTC $ETH
the Fed meeting is September 16. the market is not pricing a hold. current target is 350–375 bps. CME-style odds put 87.3% on 375–400. that is a 25 bp hike. only 12.7% is left on unchanged. three days out, a hike is the base case. that is tighter policy, not easier liquidity. $BTC has already been trading that risk. the hot jobs print pulled rate-cut hopes and sold the bounce. a priced-in hike can still move coins if the statement is hawkish. a hold would be the shock. the catch: 87% is not 100%. if they stay at 350–375, shorts on the hike narrative get squeezed. if they hike and talk higher for longer, the $78,000 failed hold gets harder to reclaim. so the event is not “maybe later.” it is this week. the bid has to live with 375–400 as the default. #BTC Price Analysis# #Bitcoin Price Prediction: What is Bitcoins next move?# $BTC $ETH
37
·
--
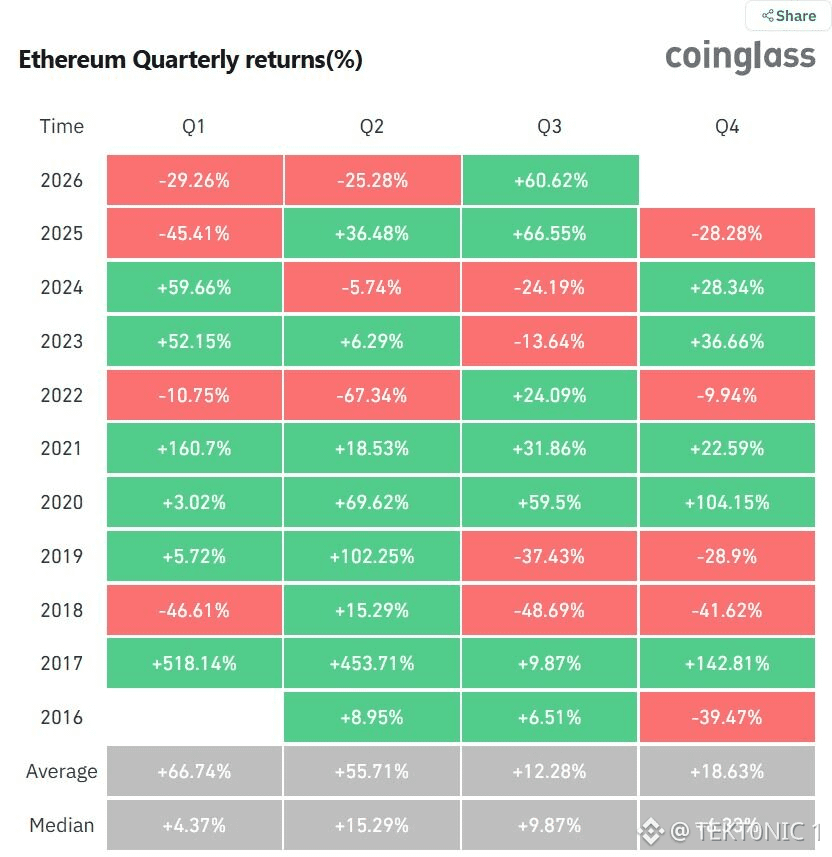
イーサリアムは過去最高記録の中で2番目に好調な第3四半期となっている――7月から9月中旬までにすでに大半の仕事を終えています。CoinGlassの四半期リターンによれば、$ETH は2026年のQ3において現時点で+60.62%と上昇しています。これは、+66.55%の2025年Q3にわずかに及ばず、+59.5%の2020年Q3を上回っています。長期平均のQ3は平均で+12.28%にとどまります。中央値は+9.87%です。主なポイント: > 2026年Q3:+60.62%(進行中)。 > 表にある最良のQ3:2025年は+66.55%。 > 次点:2020年は+59.5%、続いて2021年は+31.86%。 > 2026年Q1とQ2はいずれも赤字(−29.26%と−25.28%)。今回の四半期はそれを覆しました。 2四半期の下落のあとに60%の第3四半期が来るのは、静かな積み上げではなく激しい平均回帰です。Q3にはまだ時間が残っているため、順位は動く可能性があります。ドル建てでこの好調が維持されるかどうかを決める水準は、なお$3,000です。反発を失えば、ここからでもパーセンテージは急速に縮む恐れがあります。 $ETH 2026年Q3:+60.6%、2025年Q3に次ぐ2番目 60%のQ3は、$3,000への追い上げ(キャッチアップ)の取引が始まったと見るべきですか?それとも、すでに手遅れで追いかけにくい四半期だと見るべきですか? #Bitcoin Price Prediction: What is Bitcoins next move?# #BTC Price Analysis# $BTC
イーサリアムは過去最高記録の中で2番目に好調な第3四半期となっている――7月から9月中旬までにすでに大半の仕事を終えています。CoinGlassの四半期リターンによれば、$ETH は2026年のQ3において現時点で+60.62%と上昇しています。これは、+66.55%の2025年Q3にわずかに及ばず、+59.5%の2020年Q3を上回っています。長期平均のQ3は平均で+12.28%にとどまります。中央値は+9.87%です。主なポイント: > 2026年Q3:+60.62%(進行中)。 > 表にある最良のQ3:2025年は+66.55%。 > 次点:2020年は+59.5%、続いて2021年は+31.86%。 > 2026年Q1とQ2はいずれも赤字(−29.26%と−25.28%)。今回の四半期はそれを覆しました。 2四半期の下落のあとに60%の第3四半期が来るのは、静かな積み上げではなく激しい平均回帰です。Q3にはまだ時間が残っているため、順位は動く可能性があります。ドル建てでこの好調が維持されるかどうかを決める水準は、なお$3,000です。反発を失えば、ここからでもパーセンテージは急速に縮む恐れがあります。 $ETH 2026年Q3:+60.6%、2025年Q3に次ぐ2番目 60%のQ3は、$3,000への追い上げ(キャッチアップ)の取引が始まったと見るべきですか?それとも、すでに手遅れで追いかけにくい四半期だと見るべきですか? #Bitcoin Price Prediction: What is Bitcoins next move?# #BTC Price Analysis# $BTC
43
·
--
市場の次の節目の数字は「83,000ドルのビットコイン」と「3,000ドルのイーサ」だ。 これが分岐点だ。自動的に10万ドルや5,000ドルへ向かうチケットではない。 このリバウンドを抑えてきた水準によると、$BTC は依然として 83,000ドル付近の5月高値ゾーンを上抜く必要がある。 $ETH も依然として 3,000ドルを上抜く必要がある。 これらを10万ドルと5,000ドルへのトリガーとして扱っているトレーダーは、それらの壁がレジスタンスからサポートへ反転した場合に、トレンドの全面的な再スタートが起きる価格付けをしている。 重要ポイント: > ビットコイン最初の壁:83,000ドル。 その次の節目の数字:100,000ドル。 > イーサ最初の壁:3,000ドル。 その次の節目の数字:5,000ドル。 > 現在の水準:ビットコインは7万ドル台後半、イーサは約2,500ドル。 > 「反転」とは、その水準の上で維持することを意味し、単発のヒゲで突き抜けることではない。 83,000ドルと3,000ドルが確認ラインだ。 受け入れられた後に人々が書き込むターゲットが10万ドルと5,000ドル。 83,000ドルをもう一度失敗(再び下回る)すれば、ビットコインは依然としてレンジ相場のままだ。 3,000ドルを失敗すれば、イーサはまだ始まっていないキャッチアップ取引のままだ。 水準:83K の $BTC と 3K の $ETH 最初に—100K と 5K のみ それらが維持された後だけ #BTC Price Analysis# #Bitcoin Price Prediction: What is Bitcoins next move?#
市場の次の節目の数字は「83,000ドルのビットコイン」と「3,000ドルのイーサ」だ。 これが分岐点だ。自動的に10万ドルや5,000ドルへ向かうチケットではない。 このリバウンドを抑えてきた水準によると、$BTC は依然として 83,000ドル付近の5月高値ゾーンを上抜く必要がある。 $ETH も依然として 3,000ドルを上抜く必要がある。 これらを10万ドルと5,000ドルへのトリガーとして扱っているトレーダーは、それらの壁がレジスタンスからサポートへ反転した場合に、トレンドの全面的な再スタートが起きる価格付けをしている。 重要ポイント: > ビットコイン最初の壁:83,000ドル。 その次の節目の数字:100,000ドル。 > イーサ最初の壁:3,000ドル。 その次の節目の数字:5,000ドル。 > 現在の水準:ビットコインは7万ドル台後半、イーサは約2,500ドル。 > 「反転」とは、その水準の上で維持することを意味し、単発のヒゲで突き抜けることではない。 83,000ドルと3,000ドルが確認ラインだ。 受け入れられた後に人々が書き込むターゲットが10万ドルと5,000ドル。 83,000ドルをもう一度失敗(再び下回る)すれば、ビットコインは依然としてレンジ相場のままだ。 3,000ドルを失敗すれば、イーサはまだ始まっていないキャッチアップ取引のままだ。 水準:83K の $BTC と 3K の $ETH 最初に—100K と 5K のみ それらが維持された後だけ #BTC Price Analysis# #Bitcoin Price Prediction: What is Bitcoins next move?#
1
·
--
翻訳参照
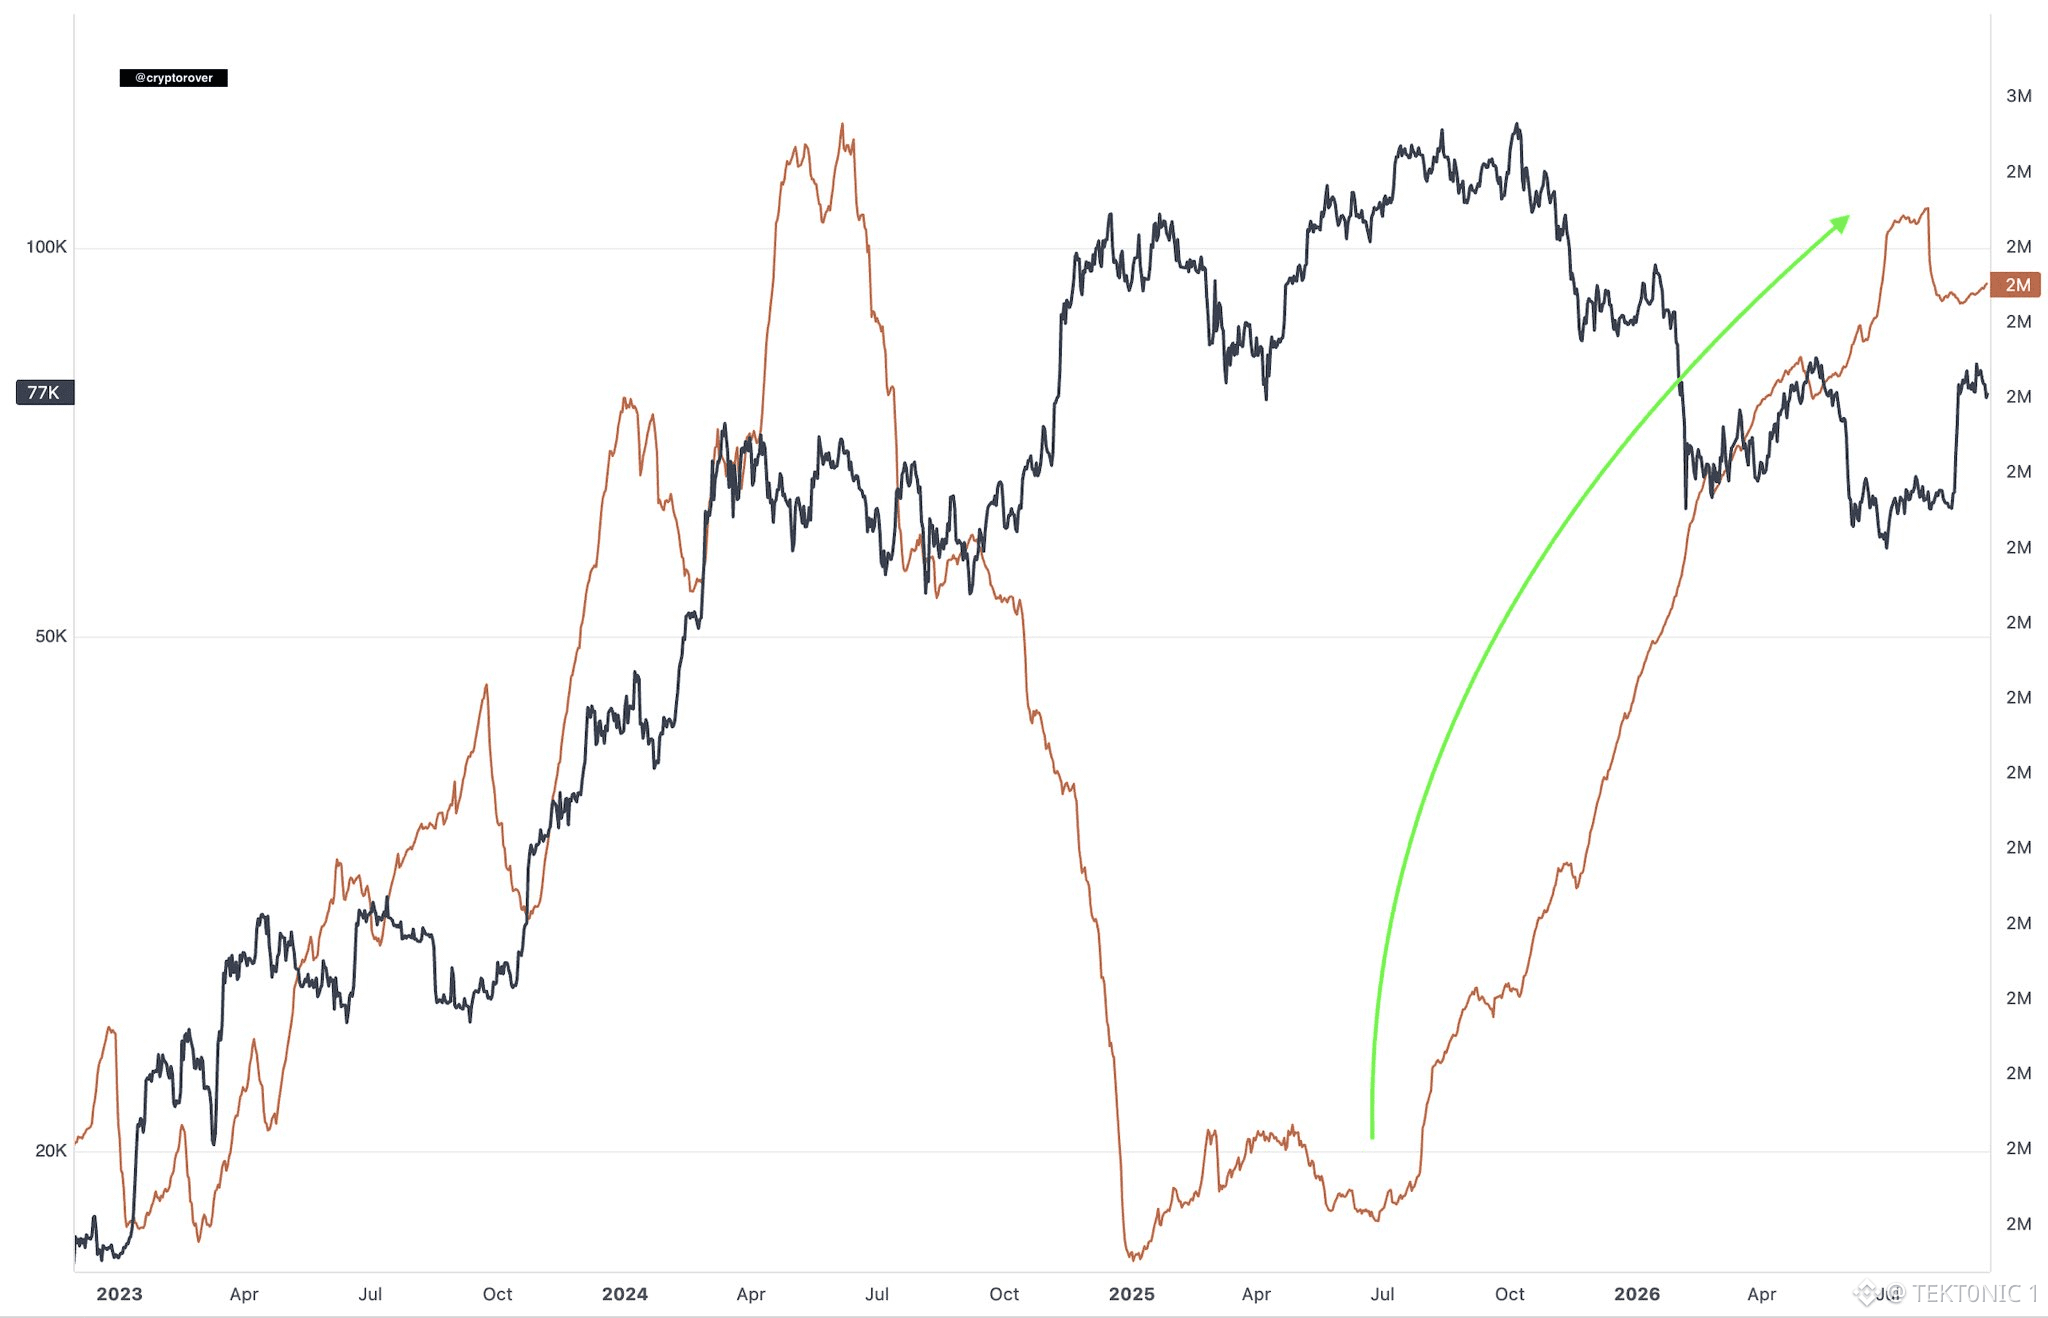
Large-Holder Bitcoin Supply Has Been Rebuilding Into the $77,000 Area The orange line on this overlay is the accumulation side of the tape. Price is the black line. According to the chart, $BTC is near $77,000. The second series — the whale/large-holder cohort on the right-hand scale — collapsed in late 2024, then turned up through 2025 and 2026 and is back near the 2 million mark. That recovery is what the green arrow is marking. Key Details: > Bitcoin price on this view: about $77,000, still below the $100,000 handle and the $126,000 high. > The orange cohort fell hard, then spent more than a year grinding higher. > The latest reading is back around 2 million on that scale. > Price and the cohort are no longer moving in lockstep: holdings rebuilt while price chopped. A rising large-holder line into a $77,000 base is constructive. It is not the same thing as a breakout. Whales can add for months and still sell into $83,000. Confirmation remains a hold of $80,000 and a close through $82,000–$83,000. Whale-Scale Bitcoin Holdings Back Near 2M While Price Sits at $77K #BTC Price Analysis# #Bitcoin Price Prediction: What is Bitcoins next move?# $ETH $BTC
Large-Holder Bitcoin Supply Has Been Rebuilding Into the $77,000 Area The orange line on this overlay is the accumulation side of the tape. Price is the black line. According to the chart, $BTC is near $77,000. The second series — the whale/large-holder cohort on the right-hand scale — collapsed in late 2024, then turned up through 2025 and 2026 and is back near the 2 million mark. That recovery is what the green arrow is marking. Key Details: > Bitcoin price on this view: about $77,000, still below the $100,000 handle and the $126,000 high. > The orange cohort fell hard, then spent more than a year grinding higher. > The latest reading is back around 2 million on that scale. > Price and the cohort are no longer moving in lockstep: holdings rebuilt while price chopped. A rising large-holder line into a $77,000 base is constructive. It is not the same thing as a breakout. Whales can add for months and still sell into $83,000. Confirmation remains a hold of $80,000 and a close through $82,000–$83,000. Whale-Scale Bitcoin Holdings Back Near 2M While Price Sits at $77K #BTC Price Analysis# #Bitcoin Price Prediction: What is Bitcoins next move?# $ETH $BTC
1
·
--
翻訳参照
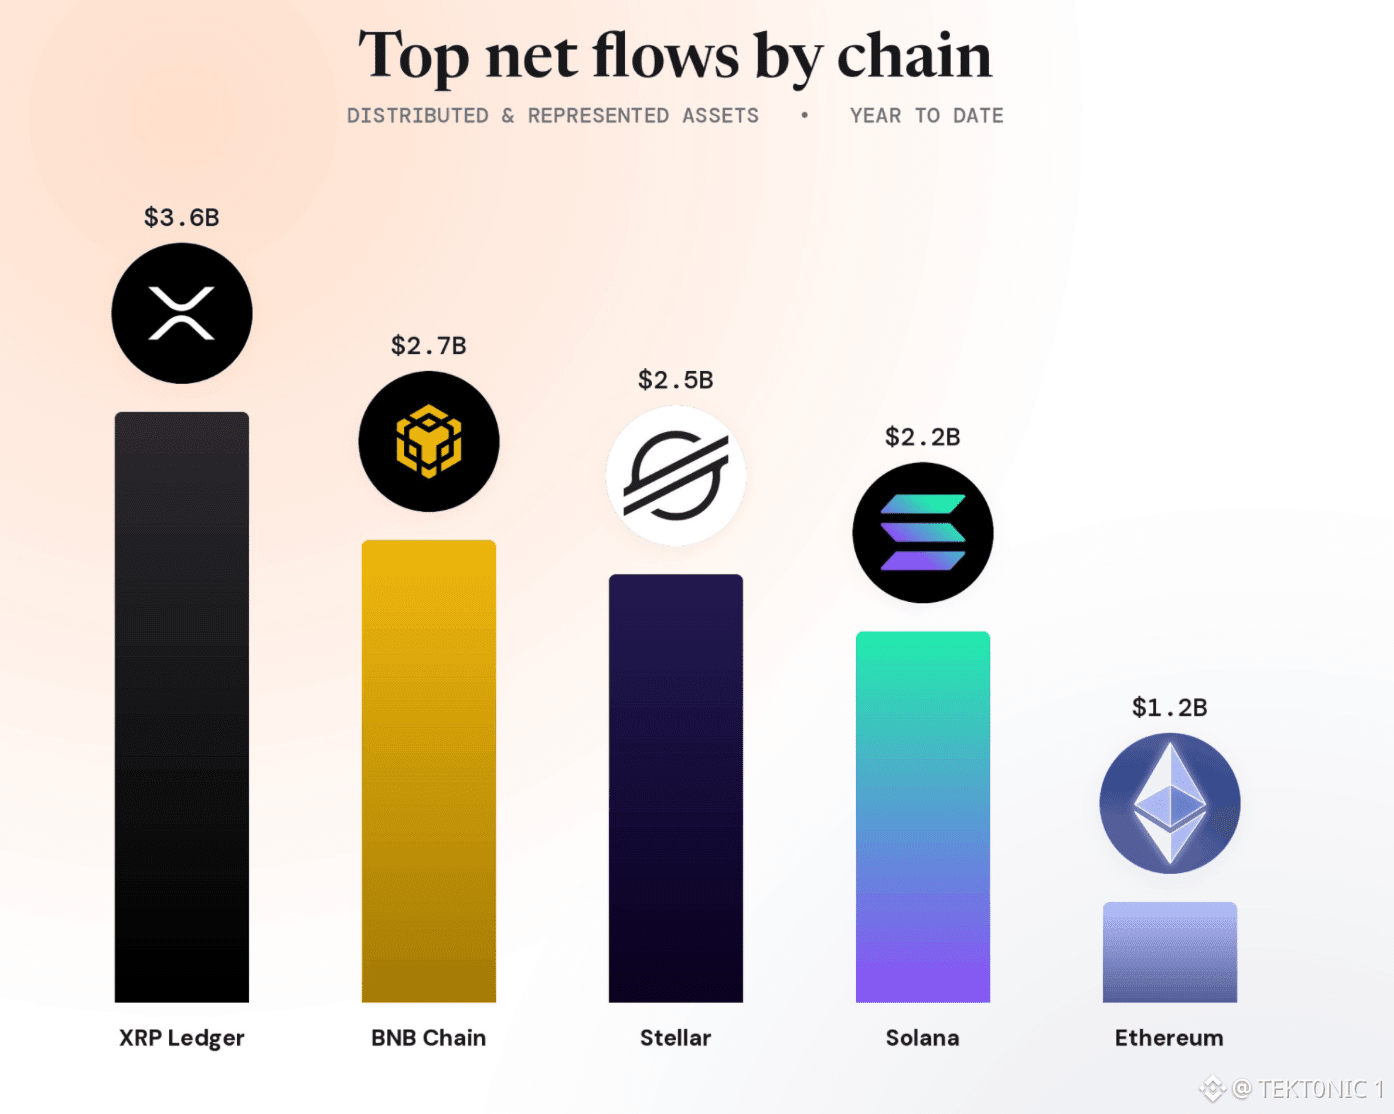
RWA capital is moving across more chains. year to date, the XRP Ledger has attracted around $3.6b in net RWA flows, leading all major chains. here’s how the top 5 look: > XRP Ledger — $3.6b > BNB Chain — $2.7b > Stellar — $2.5b > Solana — $2.2b > Ethereum — $1.2b and the growth isn’t limited to one type of asset. XRPL’s recent inflows have been driven heavily by tokenized commodities and asset-backed credit, while Stellar has crossed $3b in total RWA value with Treasuries, money-market funds, credit and gold all represented on the network. ethereum still has the largest overall RWA base, but the flow data shows capital is spreading across other ecosystems. tokenization is becoming a multi-chain market. and these numbers are starting to show it. #BTC Price Analysis# #Altcoin Season# #RWA $XRP $SOL
RWA capital is moving across more chains. year to date, the XRP Ledger has attracted around $3.6b in net RWA flows, leading all major chains. here’s how the top 5 look: > XRP Ledger — $3.6b > BNB Chain — $2.7b > Stellar — $2.5b > Solana — $2.2b > Ethereum — $1.2b and the growth isn’t limited to one type of asset. XRPL’s recent inflows have been driven heavily by tokenized commodities and asset-backed credit, while Stellar has crossed $3b in total RWA value with Treasuries, money-market funds, credit and gold all represented on the network. ethereum still has the largest overall RWA base, but the flow data shows capital is spreading across other ecosystems. tokenization is becoming a multi-chain market. and these numbers are starting to show it. #BTC Price Analysis# #Altcoin Season# #RWA $XRP $SOL
27
·
--
翻訳参照
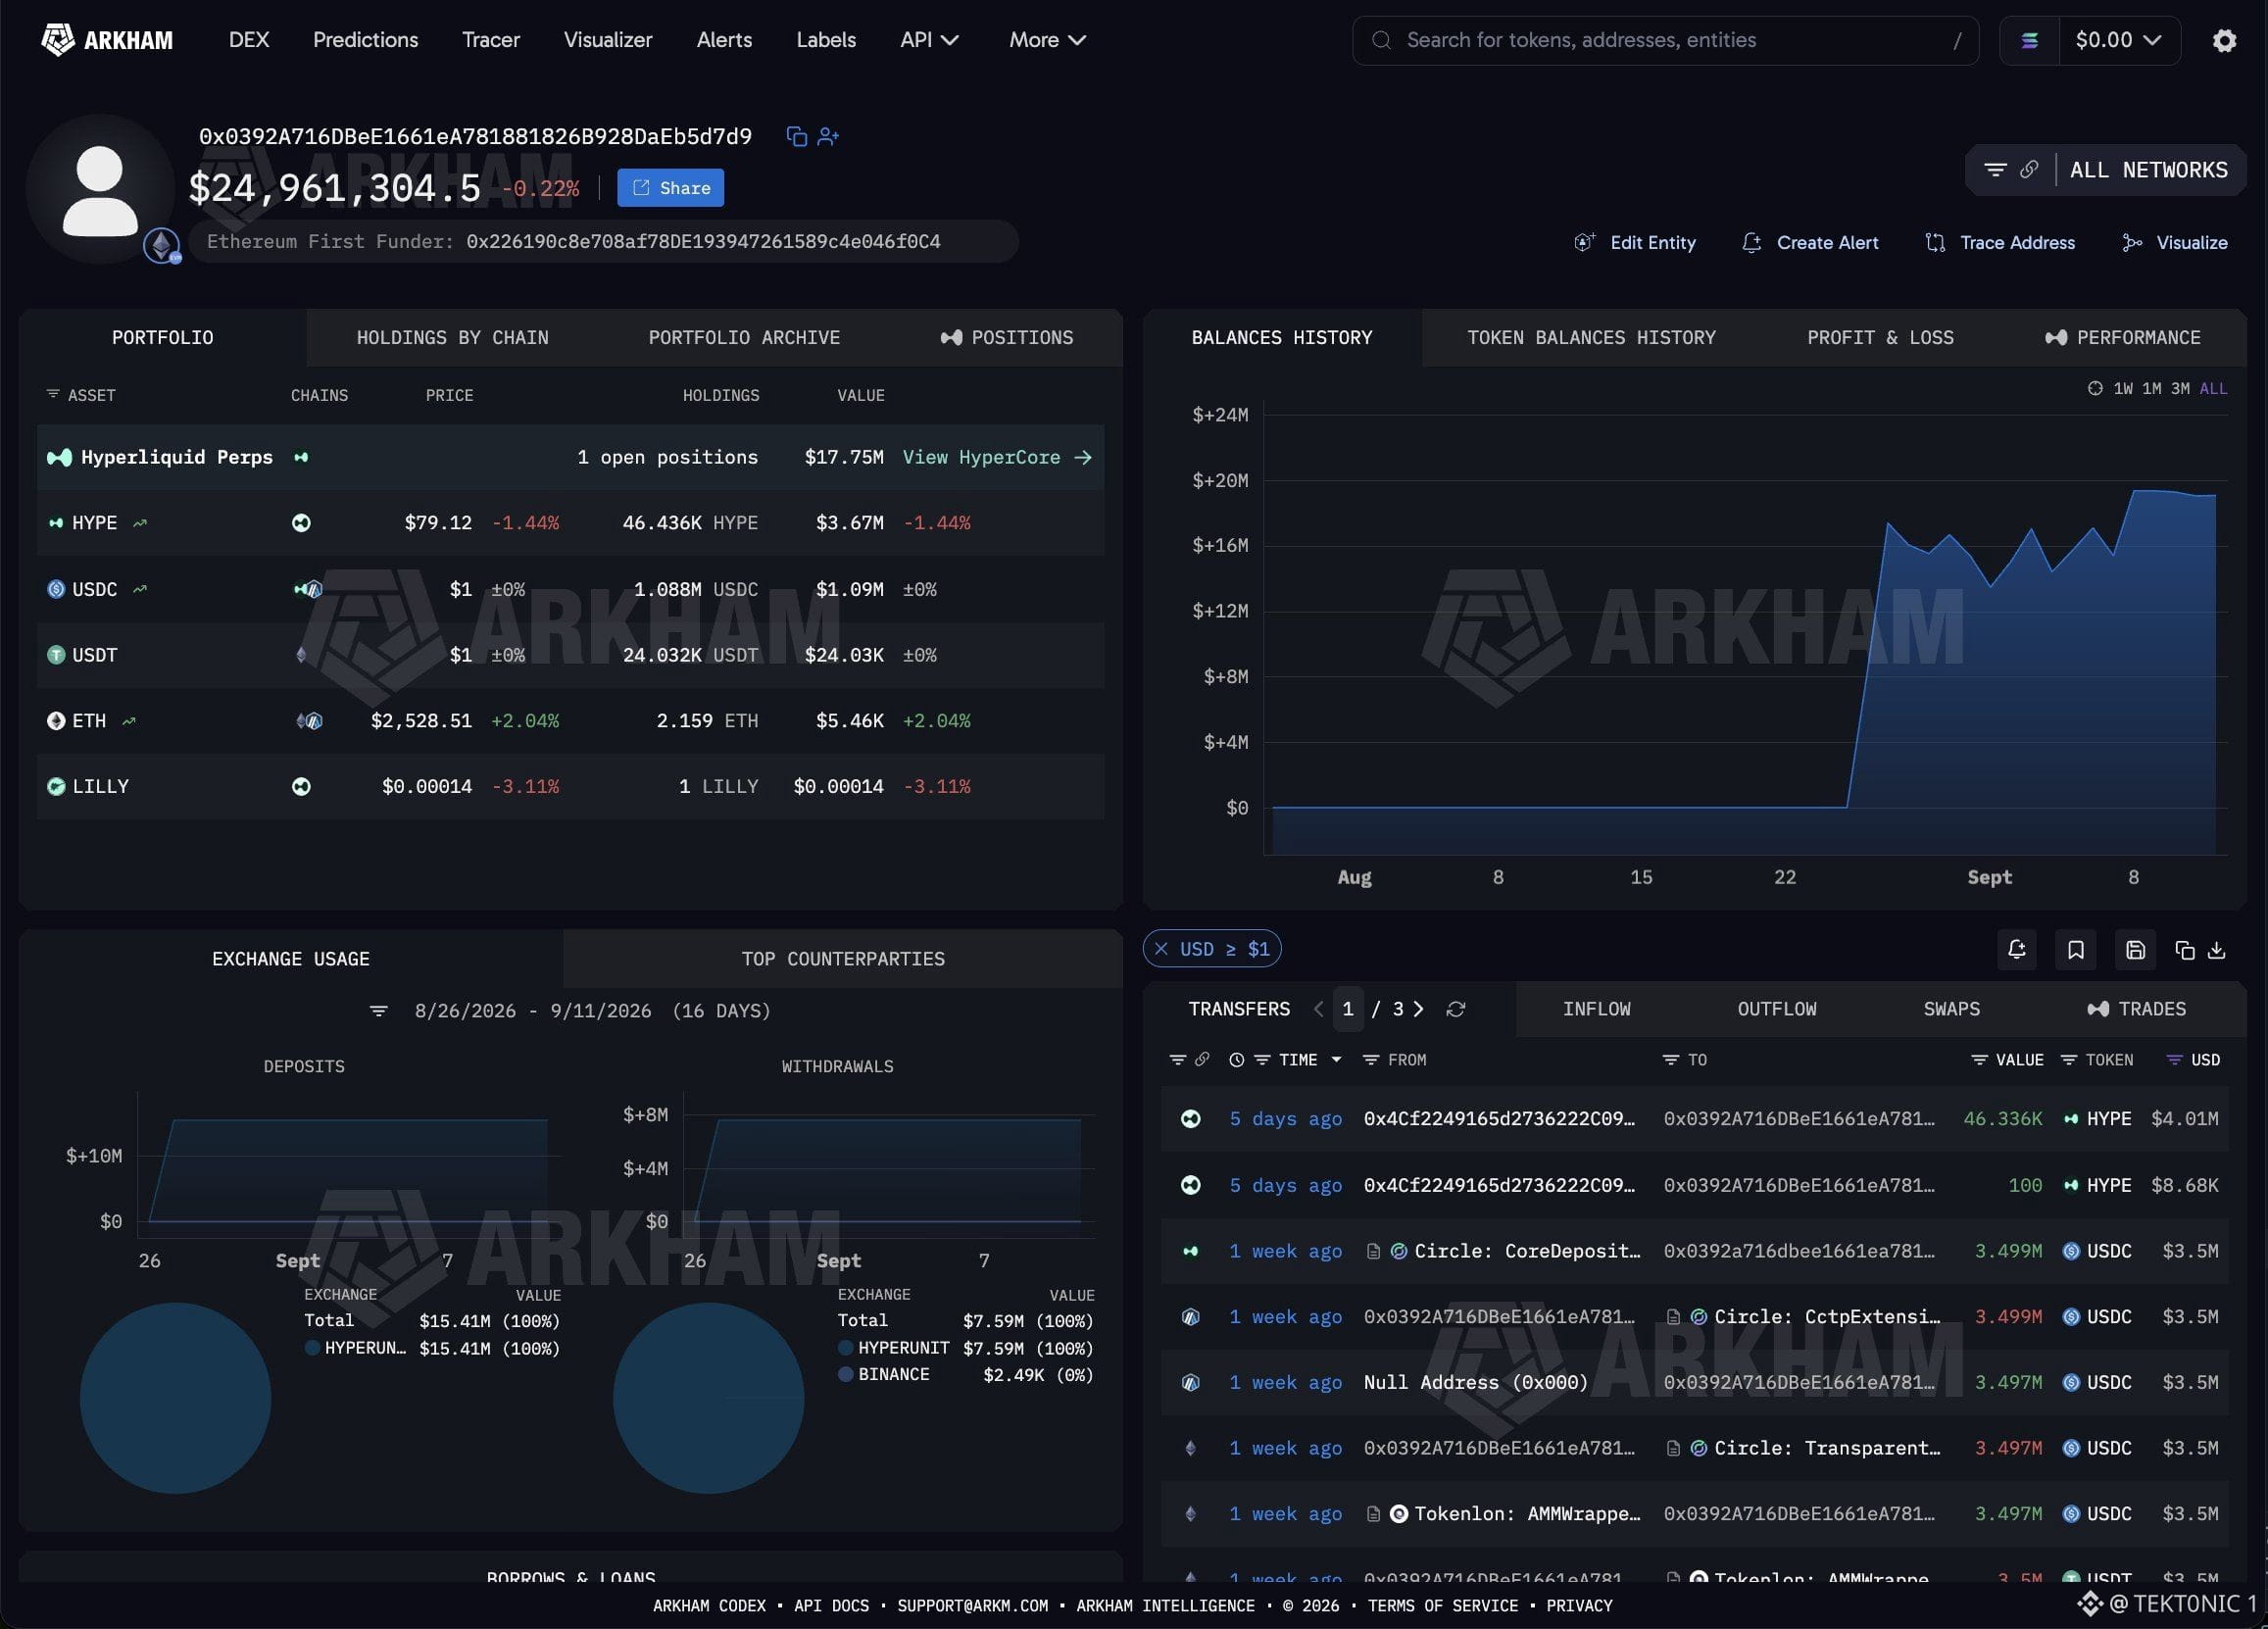
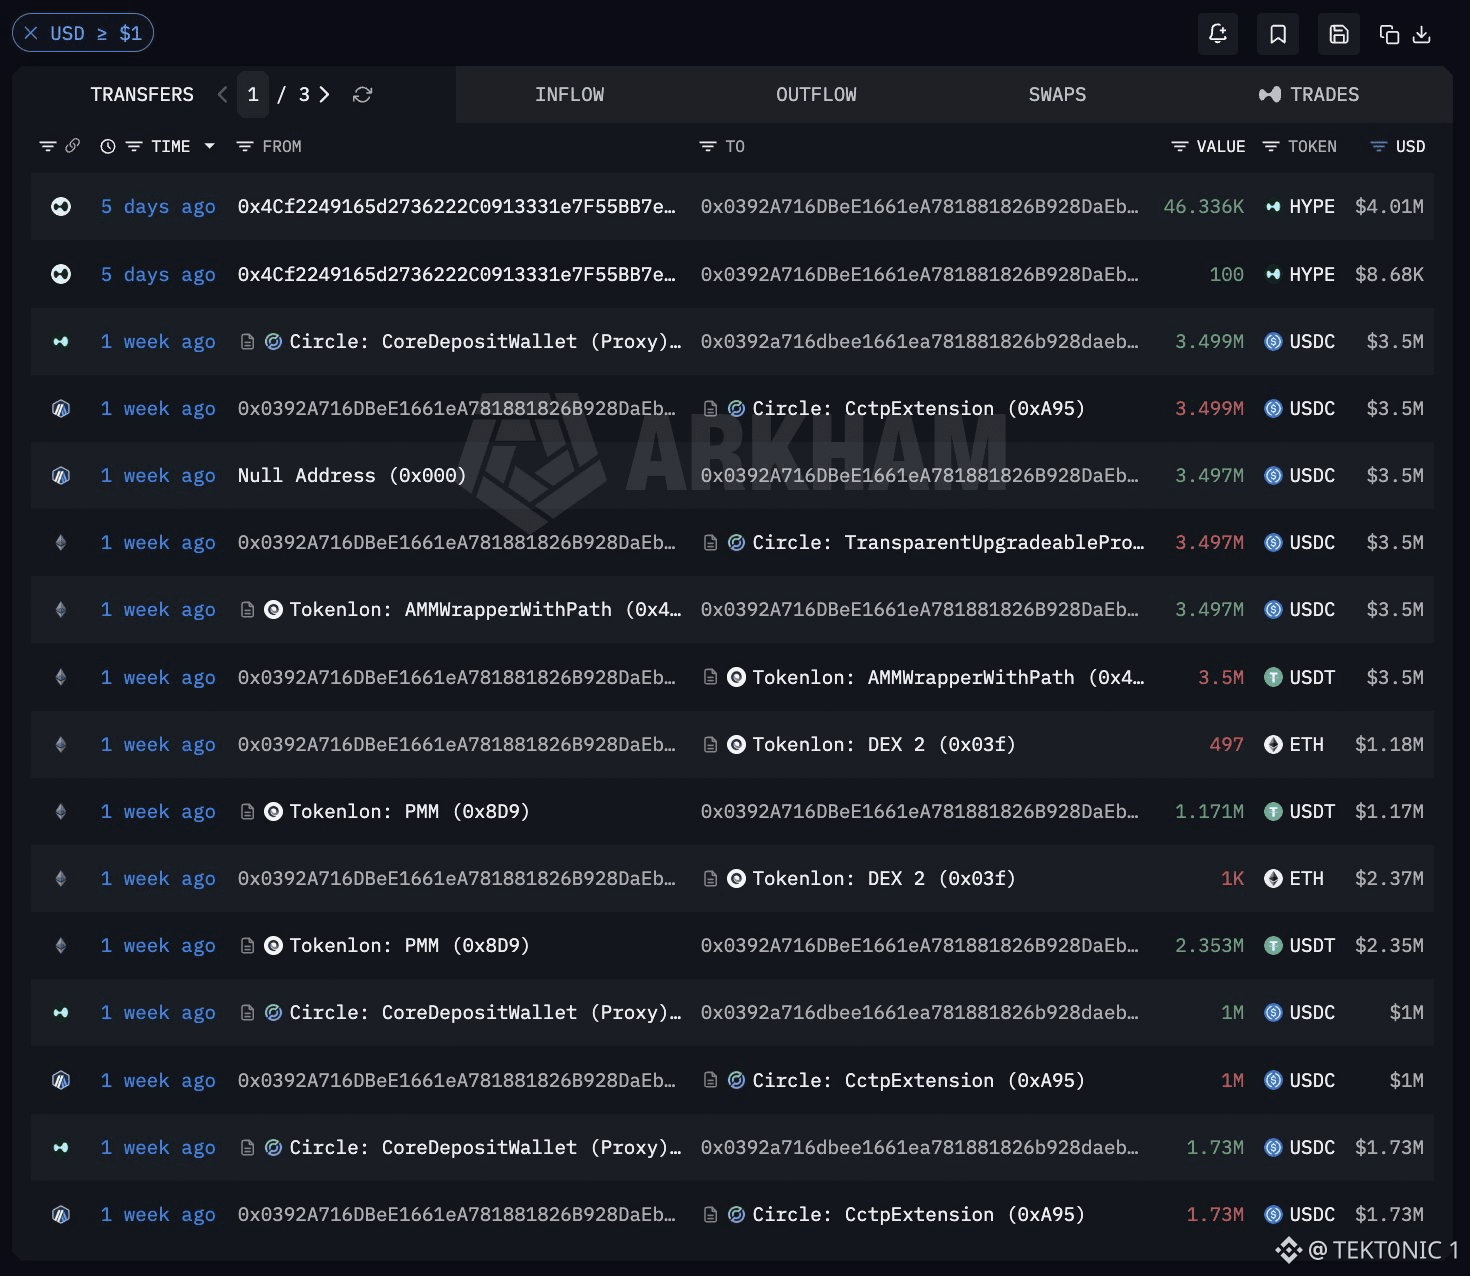
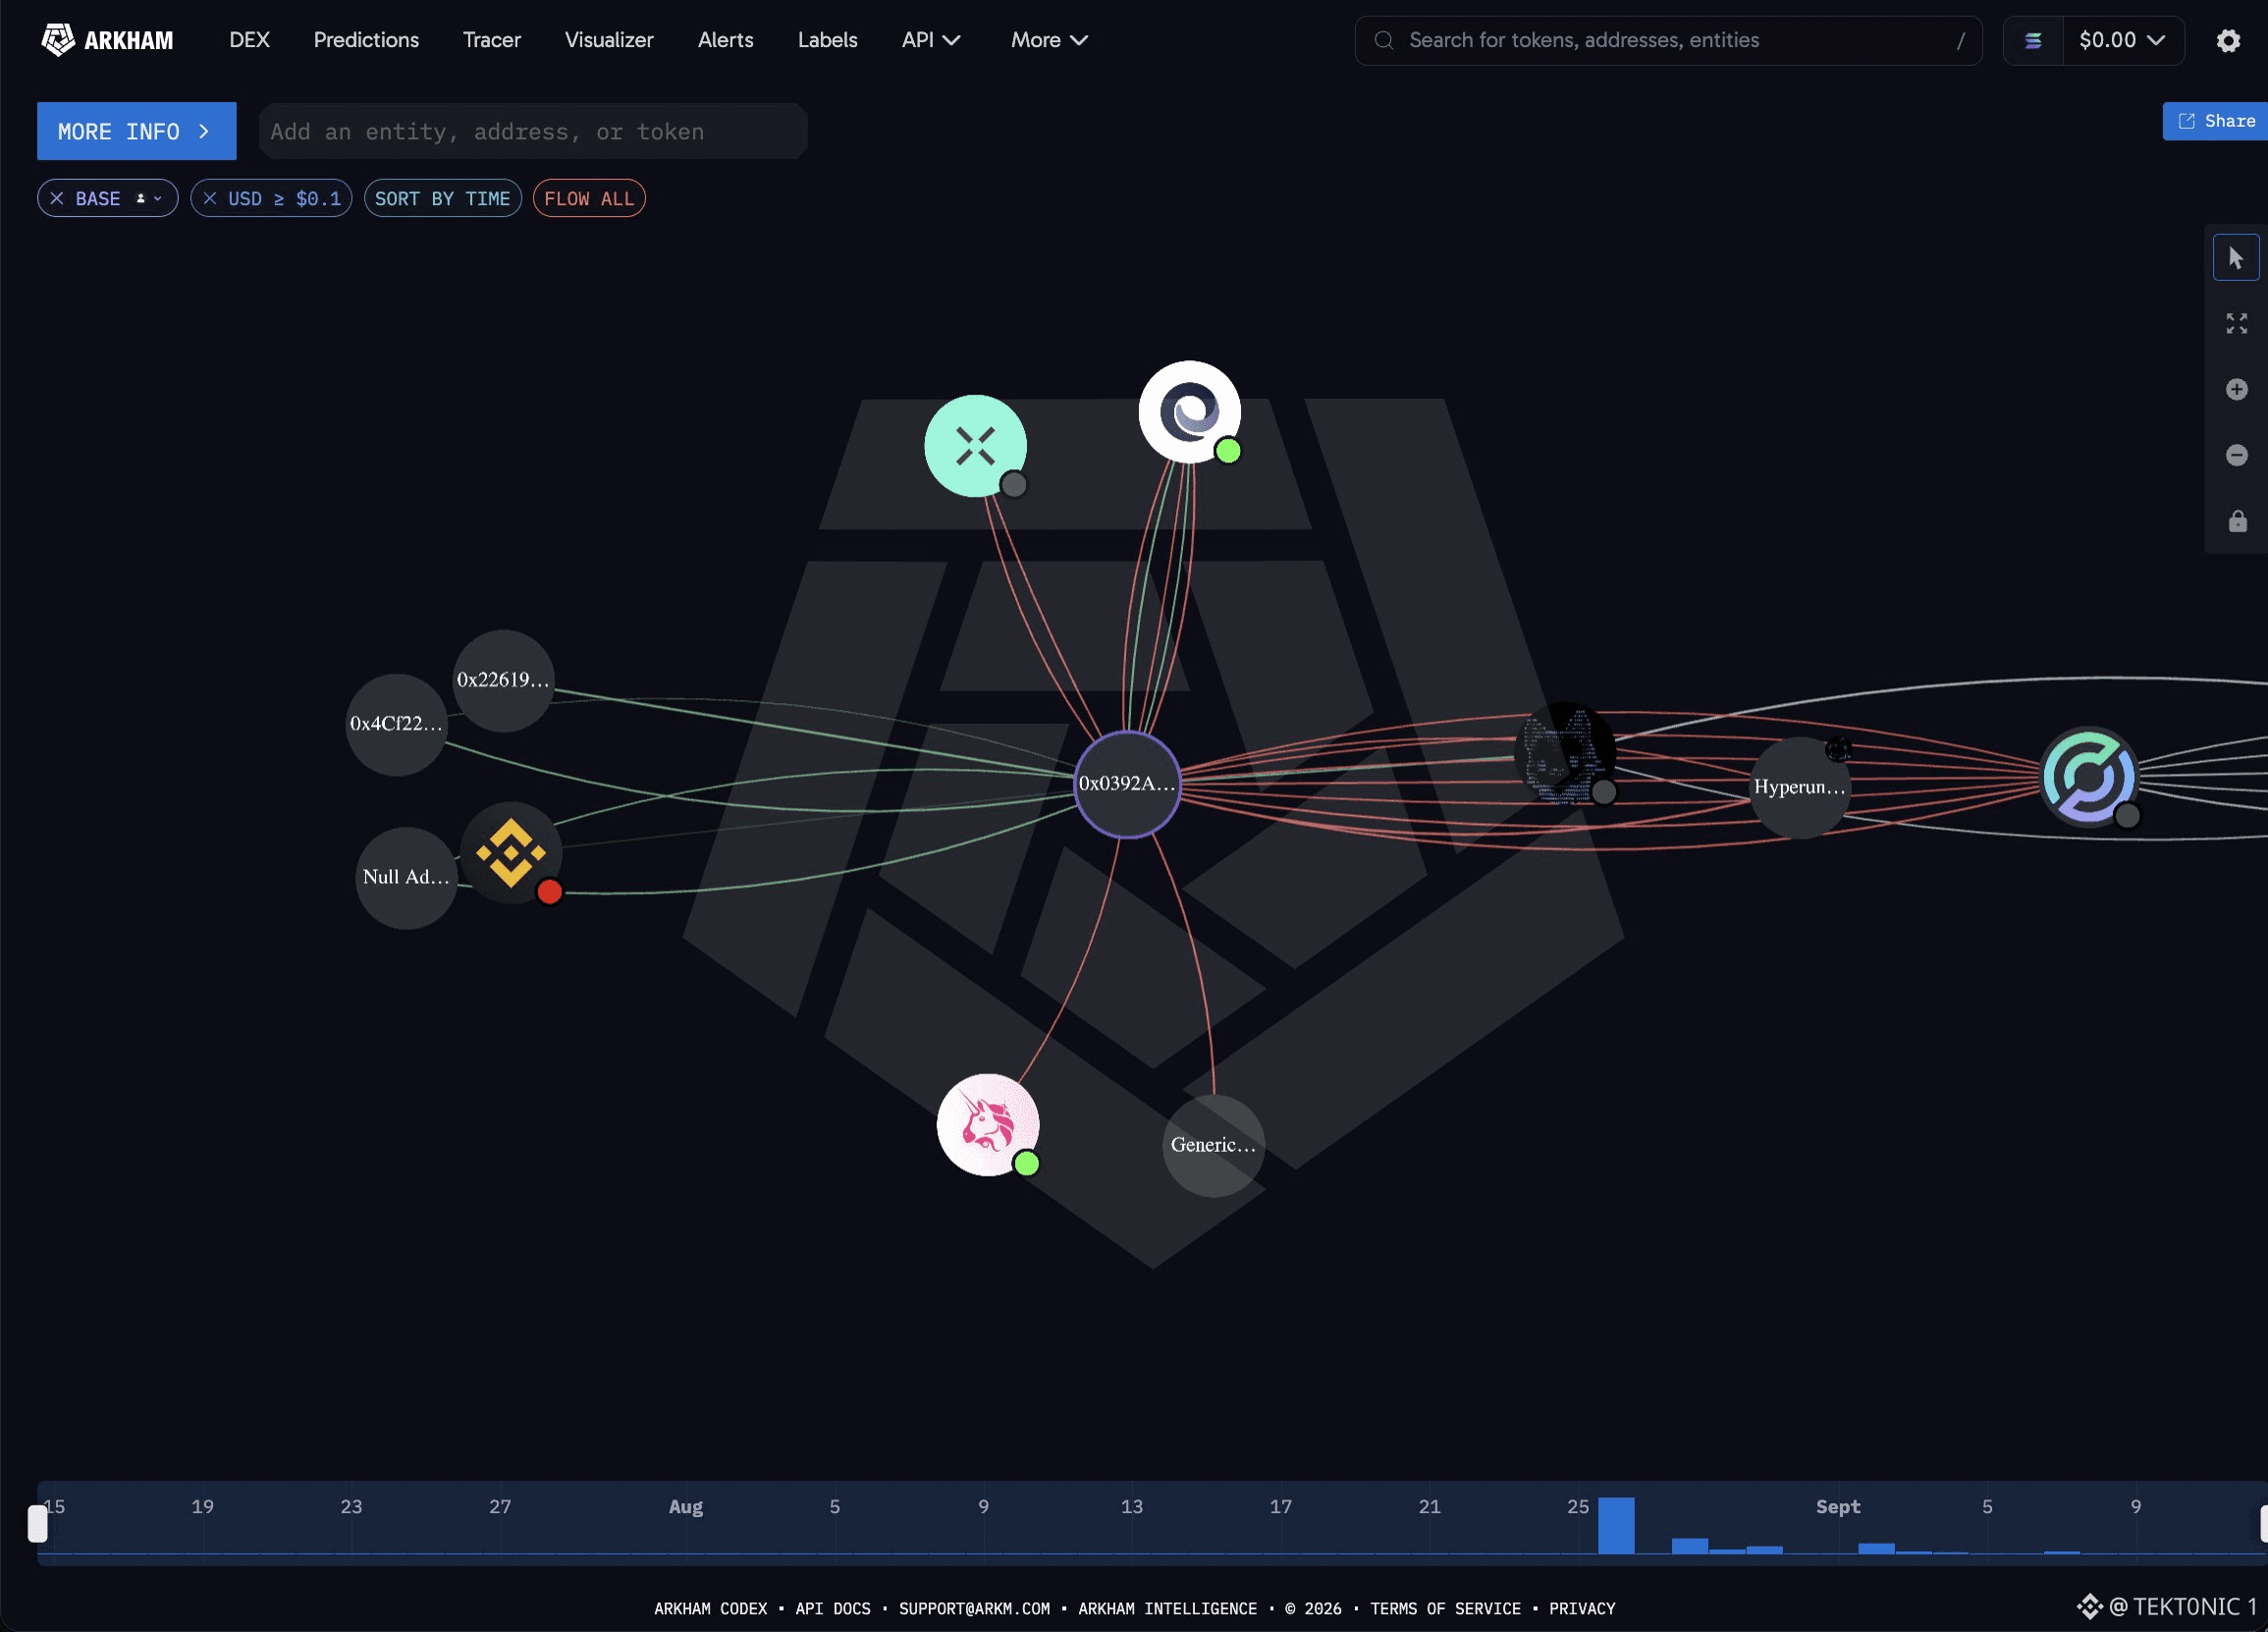
this Hyperliquid wallet is green again on a crowded ETH long. 0x039 funded a fresh address about two weeks ago. Arkham shows the book at $24.96 million now, with one perp position marked at $17.75 million plus 46,436 $HYPE . deposits over the last 16 days were $15.41 million, almost all through Hyperunit. the trade is an 8x $ETH long. entry was $2,486. notional is $114.37 million. ten days ago, when ETH printed $2,372, the account was down about $4.9 million. ETH is back through the entry. unrealized PnL is +$1.98 million. that matters because the same book that looked stopped out below $2,400 is now covering the hole without cutting the size. the catch: this is mark-to-market on 8x. a move back under $2,486 wipes the $1.98 million and puts the $4.9 million drawdown back on the screen. one wallet is not the whole bid. so the long survived the dip. it has not been reduced. $ETH still has to hold the entry for the profit to stick. #BTC Price Analysis# #HyperLiquid #Ethereum $HYPE
this Hyperliquid wallet is green again on a crowded ETH long. 0x039 funded a fresh address about two weeks ago. Arkham shows the book at $24.96 million now, with one perp position marked at $17.75 million plus 46,436 $HYPE . deposits over the last 16 days were $15.41 million, almost all through Hyperunit. the trade is an 8x $ETH long. entry was $2,486. notional is $114.37 million. ten days ago, when ETH printed $2,372, the account was down about $4.9 million. ETH is back through the entry. unrealized PnL is +$1.98 million. that matters because the same book that looked stopped out below $2,400 is now covering the hole without cutting the size. the catch: this is mark-to-market on 8x. a move back under $2,486 wipes the $1.98 million and puts the $4.9 million drawdown back on the screen. one wallet is not the whole bid. so the long survived the dip. it has not been reduced. $ETH still has to hold the entry for the profit to stick. #BTC Price Analysis# #HyperLiquid #Ethereum $HYPE
28
·
--
翻訳参照
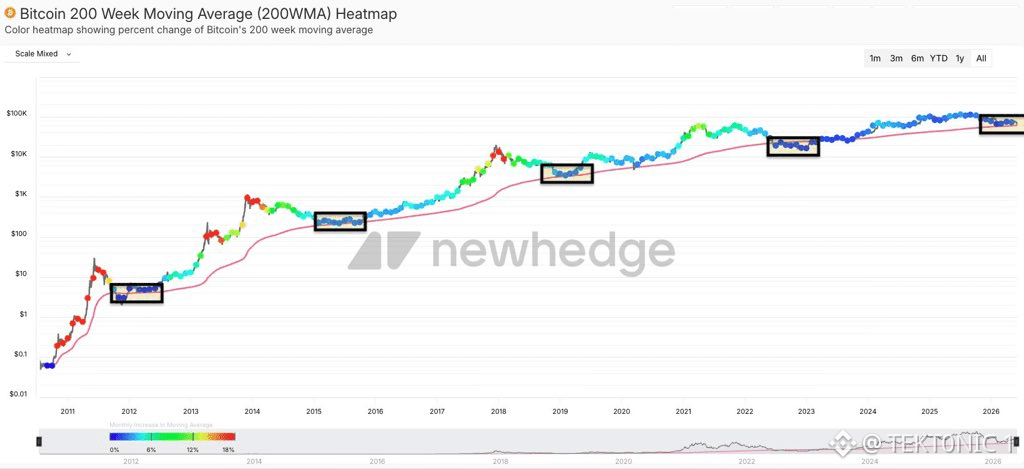
Bitcoin Is Back on Its 200-Week Average — The Line That Has Marked Prior Cycle Floors The long-term mean is holding. That is a support test, not a slogan. According to the Newhedge 200-week moving-average heatmap, $BTC is sitting on the rising 200-week line again in 2026. The same chart boxed similar tags in 2012, 2015, 2019, and 2022. Those prior touches preceded large multi-year advances. Color on the dots is the pace of change in the average itself. Key Details: > The 200-week average is the typical weekly close over about four years. It rises slowly and rarely rolls over. > Price is tagging that line again in the latest boxed zone. > Earlier boxes at the 200-week line lined up with bear-market lows, not tops. > The average is still sloping up, which means the long-term trend has not broken even after the drop from $126,000. “Never bet against the 200-week” has been a useful rule on this chart. It is not a law. The risk is a weekly close that loses the line and stays lost. The opportunity is the same one those older boxes marked: a long-term mean that has so far absorbed every major drawdown. Bitcoin Tagging the 200-Week Average Again — Same Zone That Marked 2015, 2019, and 2022 Lows #BTC Price Analysis# #Bitcoin Price Prediction: What is Bitcoins next move?# $BTC $ETH
Bitcoin Is Back on Its 200-Week Average — The Line That Has Marked Prior Cycle Floors The long-term mean is holding. That is a support test, not a slogan. According to the Newhedge 200-week moving-average heatmap, $BTC is sitting on the rising 200-week line again in 2026. The same chart boxed similar tags in 2012, 2015, 2019, and 2022. Those prior touches preceded large multi-year advances. Color on the dots is the pace of change in the average itself. Key Details: > The 200-week average is the typical weekly close over about four years. It rises slowly and rarely rolls over. > Price is tagging that line again in the latest boxed zone. > Earlier boxes at the 200-week line lined up with bear-market lows, not tops. > The average is still sloping up, which means the long-term trend has not broken even after the drop from $126,000. “Never bet against the 200-week” has been a useful rule on this chart. It is not a law. The risk is a weekly close that loses the line and stays lost. The opportunity is the same one those older boxes marked: a long-term mean that has so far absorbed every major drawdown. Bitcoin Tagging the 200-Week Average Again — Same Zone That Marked 2015, 2019, and 2022 Lows #BTC Price Analysis# #Bitcoin Price Prediction: What is Bitcoins next move?# $BTC $ETH
36
·
--
翻訳参照
the Houthis now sit on the rock that splits Bab el-Mandeb. Perim Island, also called Mayun, fell after Yemeni government forces pulled off. Mocha and Dhubab went in the same two-day push. Perim divides the strait into its two shipping lanes, which is why the island matters more than another coastal town. Q2 flows through Bab el-Mandeb averaged 8.1 million barrels a day, per the EIA, about 8% of global supply. that volume had already jumped after Hormuz tightened and more Gulf crude was sent to Yanbu for the Red Sea route. Kpler had crossings drop from 30 to 15 on Friday. Hormuz traffic is already crushed. the Saudi East-West line that exists to bypass it was hit and shut in the same window. Brent has been trading above $100. two oil chokepoints are now under pressure at once. cargo that leaves one gate still has to clear the other. the catch: seizing Perim is not the same as closing the strait. ships are still moving, just fewer of them. the price is pricing disruption risk, not a confirmed zero-flow print. #BTC Price Analysis# #Bitcoin Price Prediction: What is Bitcoins next move?# $BTC $SOL
the Houthis now sit on the rock that splits Bab el-Mandeb. Perim Island, also called Mayun, fell after Yemeni government forces pulled off. Mocha and Dhubab went in the same two-day push. Perim divides the strait into its two shipping lanes, which is why the island matters more than another coastal town. Q2 flows through Bab el-Mandeb averaged 8.1 million barrels a day, per the EIA, about 8% of global supply. that volume had already jumped after Hormuz tightened and more Gulf crude was sent to Yanbu for the Red Sea route. Kpler had crossings drop from 30 to 15 on Friday. Hormuz traffic is already crushed. the Saudi East-West line that exists to bypass it was hit and shut in the same window. Brent has been trading above $100. two oil chokepoints are now under pressure at once. cargo that leaves one gate still has to clear the other. the catch: seizing Perim is not the same as closing the strait. ships are still moving, just fewer of them. the price is pricing disruption risk, not a confirmed zero-flow print. #BTC Price Analysis# #Bitcoin Price Prediction: What is Bitcoins next move?# $BTC $SOL

43
·
--
グレースケールは、古いZcashの信託を上場商品に変えた――そして銘柄ラインが跳ね上がった。ZCSHは8月25日、スポットの付与型信託としてNYSEアーカで取引を開始した。コインベース・カストディにZECを保有し、CoinDeskのZcashベンチマークに連動、スポンサー手数料は2.50%。9月10日の公表時点で、ファンドには約559,000ZECがあった。上場以降、この商品は11回の取引セッションで約1億7900万ドルを取り込んだ。運用資産(AUM)は現在7億ドルを超えている。この成長率は、約4,000のETPの上位1%に入る。$ZEC自体は同じ期間で59%上昇している。最初の買い注文の一部は身近なところから来ていた。スポンサーと同じグループ内のDCG Internationalが、大口の初期買い手として報じられていた。価格上昇に加えて設定(クレイエーション)もAUMを押し上げるため、順位はフローと、進行中のコイン(価格の動き)という混合だ。とはいえ注意点もある。2.50%の手数料、そして11日というサンプルは「サイクル」ではない。ビットコインのETPは依然としてこの規模を大きく上回っている。もし$ZECが59%の上昇分を取り戻せなければ、AUMの公表値もそれに引っ張られる。つまり、上場は需要を見つけた。次の試験は、トークンの上昇(ラン)が止まった後も、設定が継続するかどうかだ。 #BTC Price Analysis# #Bitcoin Price Prediction: What is Bitcoins next move?# $BTC
グレースケールは、古いZcashの信託を上場商品に変えた――そして銘柄ラインが跳ね上がった。ZCSHは8月25日、スポットの付与型信託としてNYSEアーカで取引を開始した。コインベース・カストディにZECを保有し、CoinDeskのZcashベンチマークに連動、スポンサー手数料は2.50%。9月10日の公表時点で、ファンドには約559,000ZECがあった。上場以降、この商品は11回の取引セッションで約1億7900万ドルを取り込んだ。運用資産(AUM)は現在7億ドルを超えている。この成長率は、約4,000のETPの上位1%に入る。$ZEC自体は同じ期間で59%上昇している。最初の買い注文の一部は身近なところから来ていた。スポンサーと同じグループ内のDCG Internationalが、大口の初期買い手として報じられていた。価格上昇に加えて設定(クレイエーション)もAUMを押し上げるため、順位はフローと、進行中のコイン(価格の動き)という混合だ。とはいえ注意点もある。2.50%の手数料、そして11日というサンプルは「サイクル」ではない。ビットコインのETPは依然としてこの規模を大きく上回っている。もし$ZECが59%の上昇分を取り戻せなければ、AUMの公表値もそれに引っ張られる。つまり、上場は需要を見つけた。次の試験は、トークンの上昇(ラン)が止まった後も、設定が継続するかどうかだ。 #BTC Price Analysis# #Bitcoin Price Prediction: What is Bitcoins next move?# $BTC

12
·
--
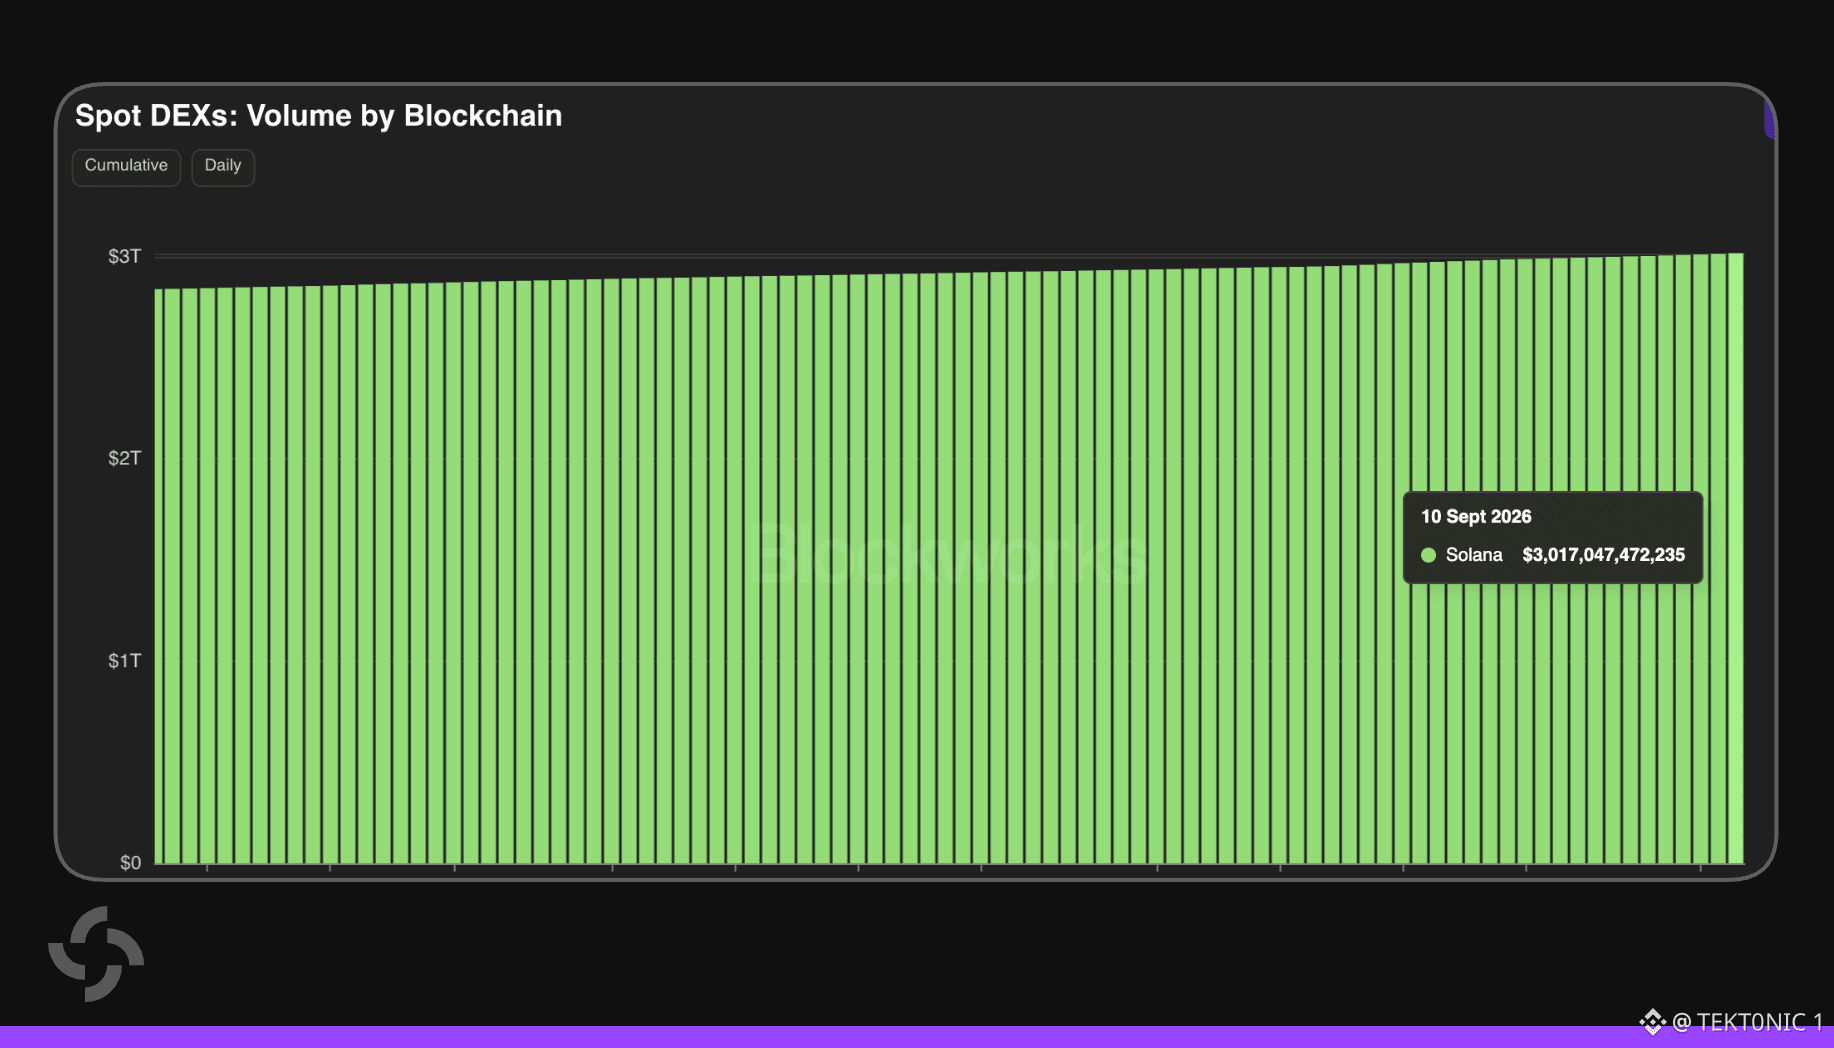
ソラナの累積DEX出来高が3兆ドルを突破 これはチェーン上でのスポットDEX取引におけるライフタイム累計であり、1日だけの数値ではありません。 Blockworksのデータによると、2026年9月10日時点でソラナの累積スポットDEX出来高は3.017兆ドルです。 日々のフローが総量に積み上がり続けるため、累積系列はほぼ直線的に高まってきました。 重要ポイント: > ソラナの累積スポットDEX出来高: 3.017兆ドル。 > 表示日: 2026年9月10日。 > これは全期間の取引量を合算したもので、閑散日でも増えていきます。 > DEX出来高は取引(トレード)を数えます。ユニークユーザー数や純増資金を意味するものではありません。 3兆ドルは規模の目安です。これは、ソラナが長い間オンチェーンのスポット取引におけるデフォルトの“安価な場”になっていたことを示しています。 ただし、それだけでは「来月の方が前月より強い」とは言えません。 エンジンがまだ加速しているかを知りたいなら、日次の出来高とアプリ収益を見てください。 ソラナDEX出来高: 9月10日時点で累積3.02兆ドル #BTC Price Analysis# #Bitcoin Price Prediction: What is Bitcoins next move?# $BTC $SOL #Bullish
ソラナの累積DEX出来高が3兆ドルを突破 これはチェーン上でのスポットDEX取引におけるライフタイム累計であり、1日だけの数値ではありません。 Blockworksのデータによると、2026年9月10日時点でソラナの累積スポットDEX出来高は3.017兆ドルです。 日々のフローが総量に積み上がり続けるため、累積系列はほぼ直線的に高まってきました。 重要ポイント: > ソラナの累積スポットDEX出来高: 3.017兆ドル。 > 表示日: 2026年9月10日。 > これは全期間の取引量を合算したもので、閑散日でも増えていきます。 > DEX出来高は取引(トレード)を数えます。ユニークユーザー数や純増資金を意味するものではありません。 3兆ドルは規模の目安です。これは、ソラナが長い間オンチェーンのスポット取引におけるデフォルトの“安価な場”になっていたことを示しています。 ただし、それだけでは「来月の方が前月より強い」とは言えません。 エンジンがまだ加速しているかを知りたいなら、日次の出来高とアプリ収益を見てください。 ソラナDEX出来高: 9月10日時点で累積3.02兆ドル #BTC Price Analysis# #Bitcoin Price Prediction: What is Bitcoins next move?# $BTC $SOL #Bullish
·
--
翻訳参照
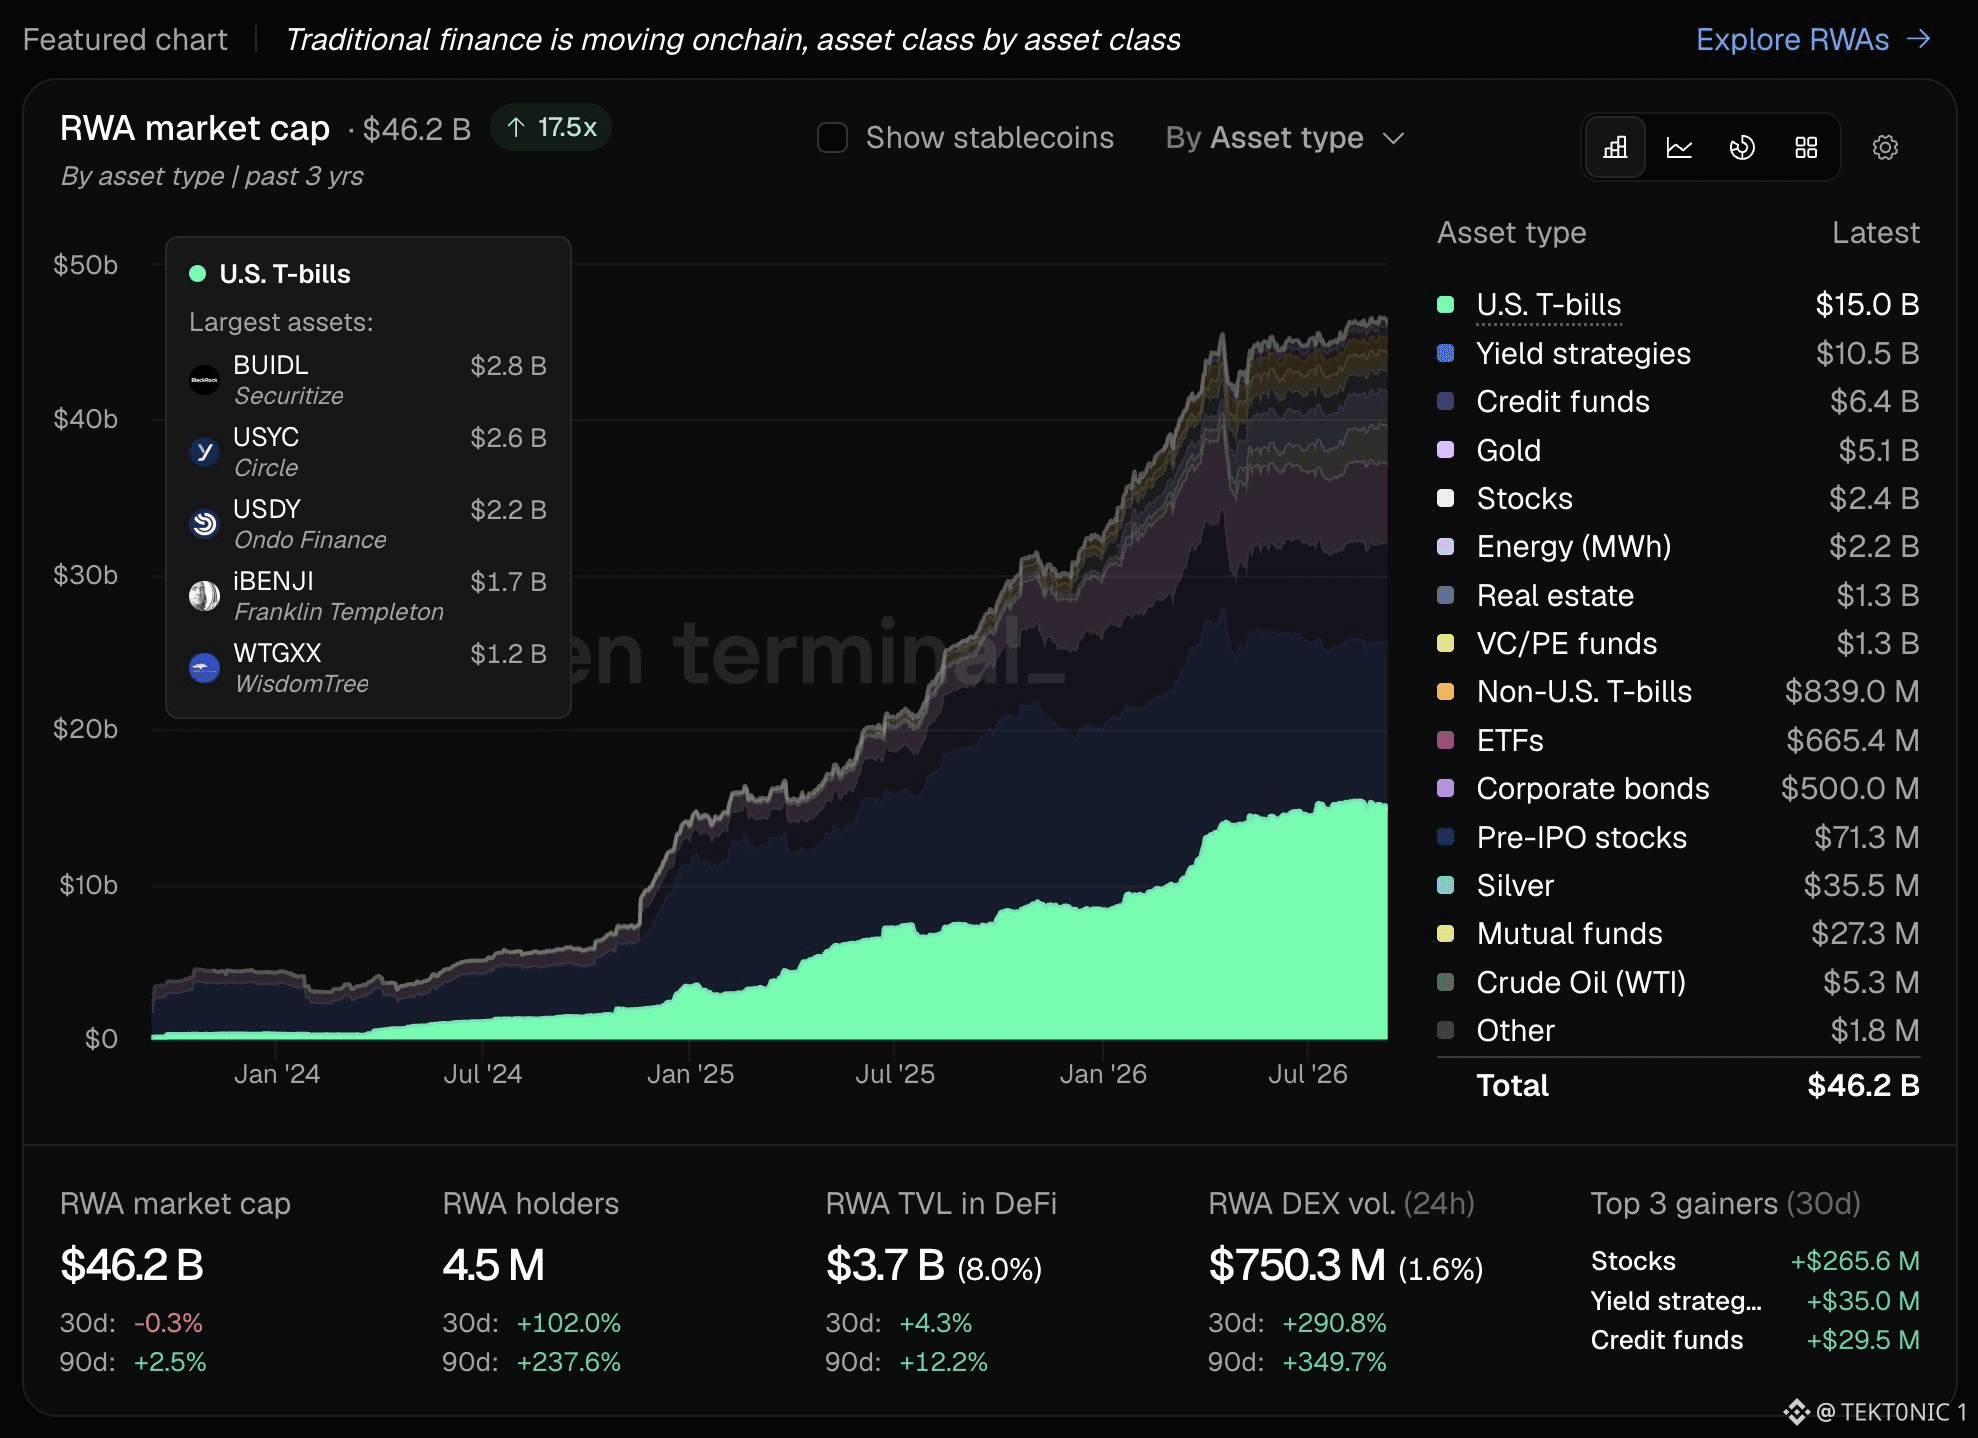
onchain RWAs just printed $46.2 billion. Token Terminal has the market at 17.5x over three years, with stablecoins switched off. U.S. T-bills remain the largest sleeve at $15.0 billion. that is not the whole book. yield strategies are $10.5B, credit funds $6.4B, gold $5.1B, stocks $2.4B and energy $2.2B. five funds dominate the T-bill sleeve. BUIDL is $2.8B, Circle’s USYC $2.6B, Ondo’s USDY $2.2B, Franklin’s iBENJI $1.7B and WisdomTree’s WTGXX $1.2B. together they hold $10.5 billion, or 70% of tokenized T-bills. holders are now 4.5 million, up 102% over 30 days and 238% over 90 days. 24-hour RWA DEX volume is $750 million. stocks led the last 30 days, adding $266 million. most of this growth is issuance. tradfi paper is being tokenized and marked onchain. DeFi use is still light: only $3.7 billion, or 8% of the stack, is deployed in protocols. the market is real. it is also tight. T-bills lead, five funds control that sleeve, and the rest of RWAs are still smaller. #BTC Price Analysis# #Bitcoin Price Prediction: What is Bitcoins next move?# #RWA $BTC $XRP
onchain RWAs just printed $46.2 billion. Token Terminal has the market at 17.5x over three years, with stablecoins switched off. U.S. T-bills remain the largest sleeve at $15.0 billion. that is not the whole book. yield strategies are $10.5B, credit funds $6.4B, gold $5.1B, stocks $2.4B and energy $2.2B. five funds dominate the T-bill sleeve. BUIDL is $2.8B, Circle’s USYC $2.6B, Ondo’s USDY $2.2B, Franklin’s iBENJI $1.7B and WisdomTree’s WTGXX $1.2B. together they hold $10.5 billion, or 70% of tokenized T-bills. holders are now 4.5 million, up 102% over 30 days and 238% over 90 days. 24-hour RWA DEX volume is $750 million. stocks led the last 30 days, adding $266 million. most of this growth is issuance. tradfi paper is being tokenized and marked onchain. DeFi use is still light: only $3.7 billion, or 8% of the stack, is deployed in protocols. the market is real. it is also tight. T-bills lead, five funds control that sleeve, and the rest of RWAs are still smaller. #BTC Price Analysis# #Bitcoin Price Prediction: What is Bitcoins next move?# #RWA $BTC $XRP
19
·
--
翻訳参照
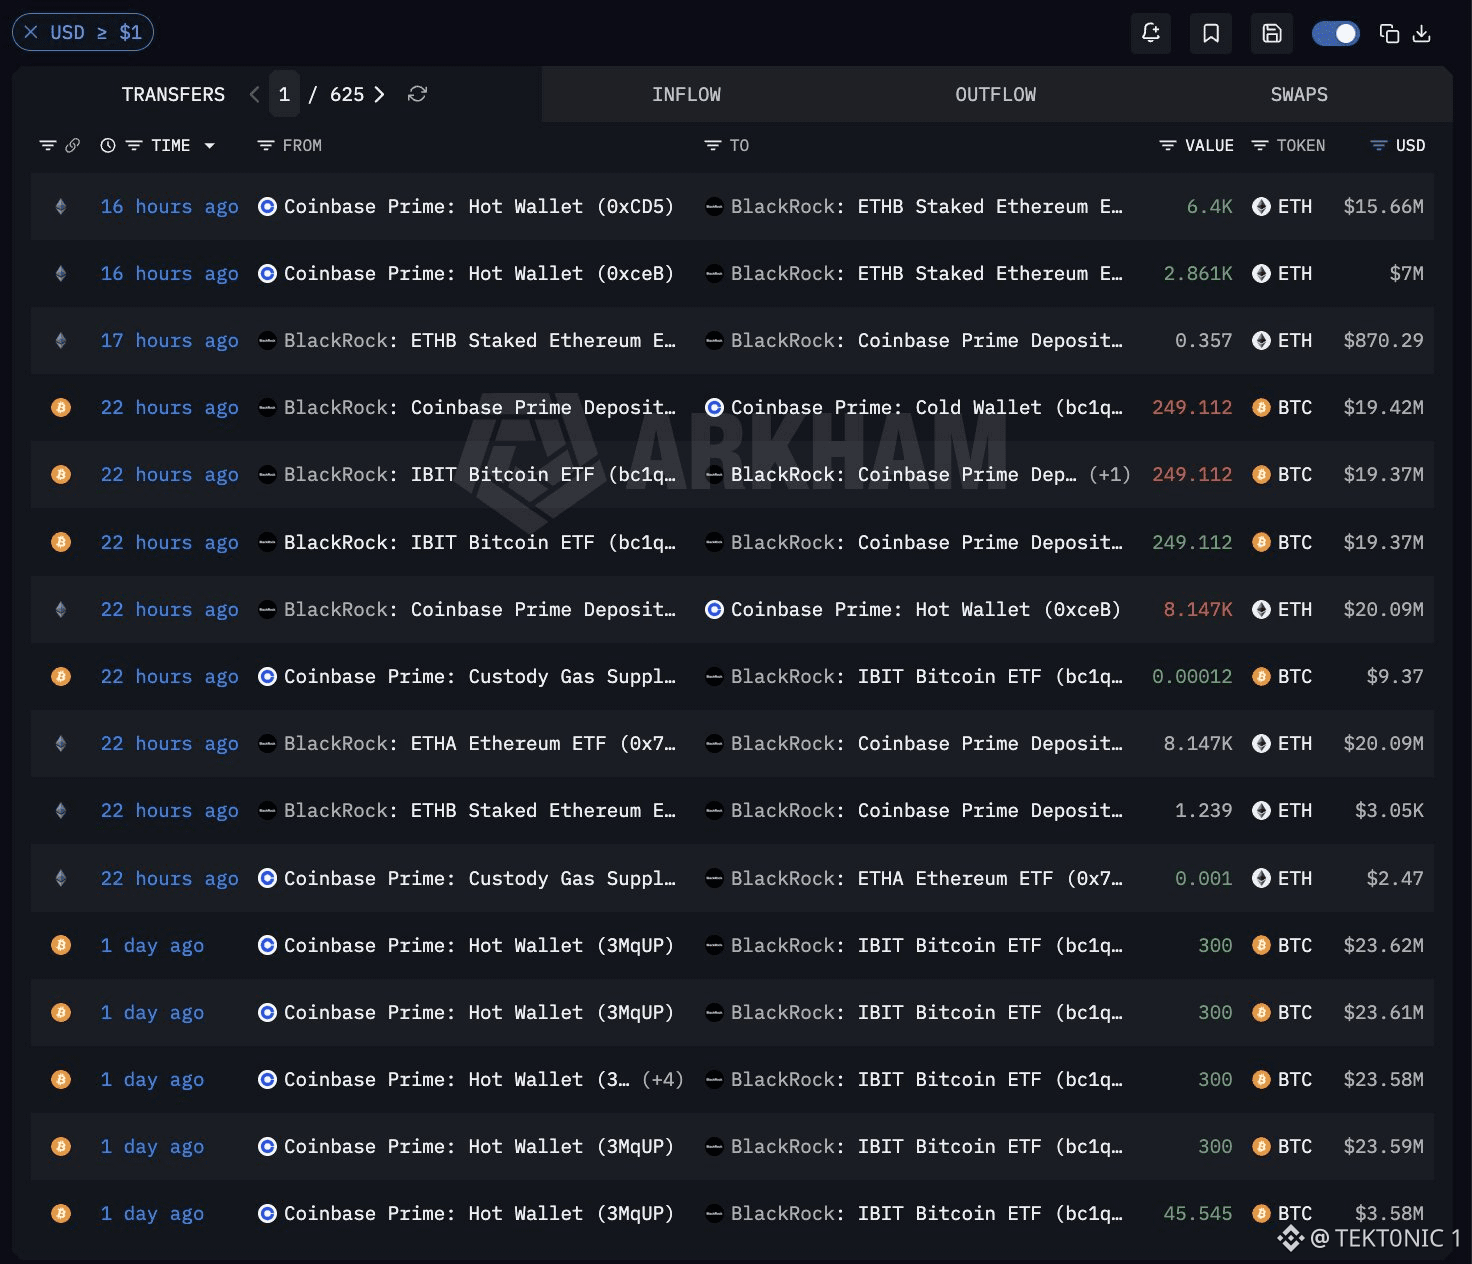
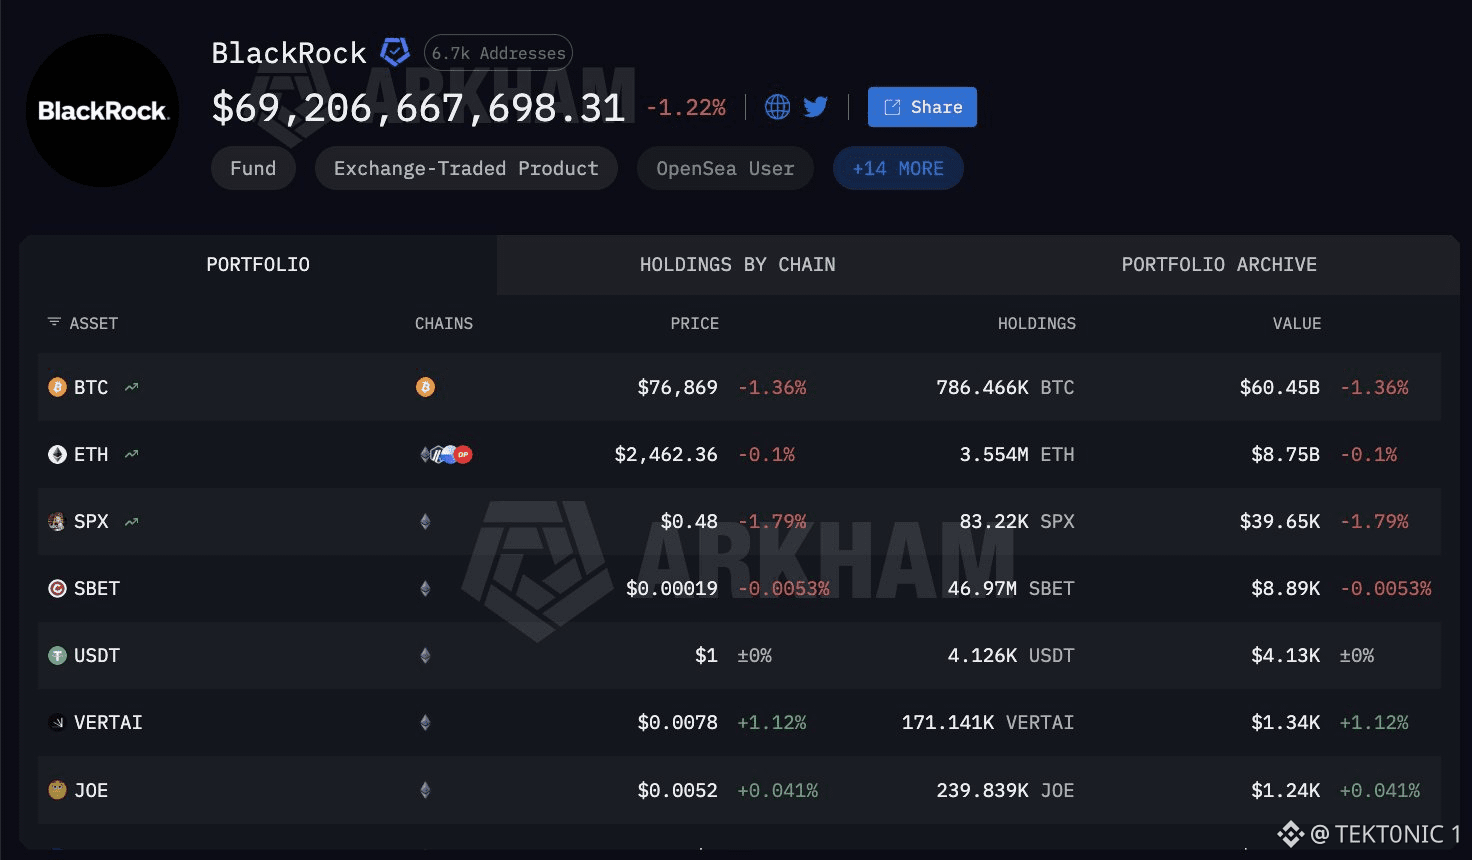
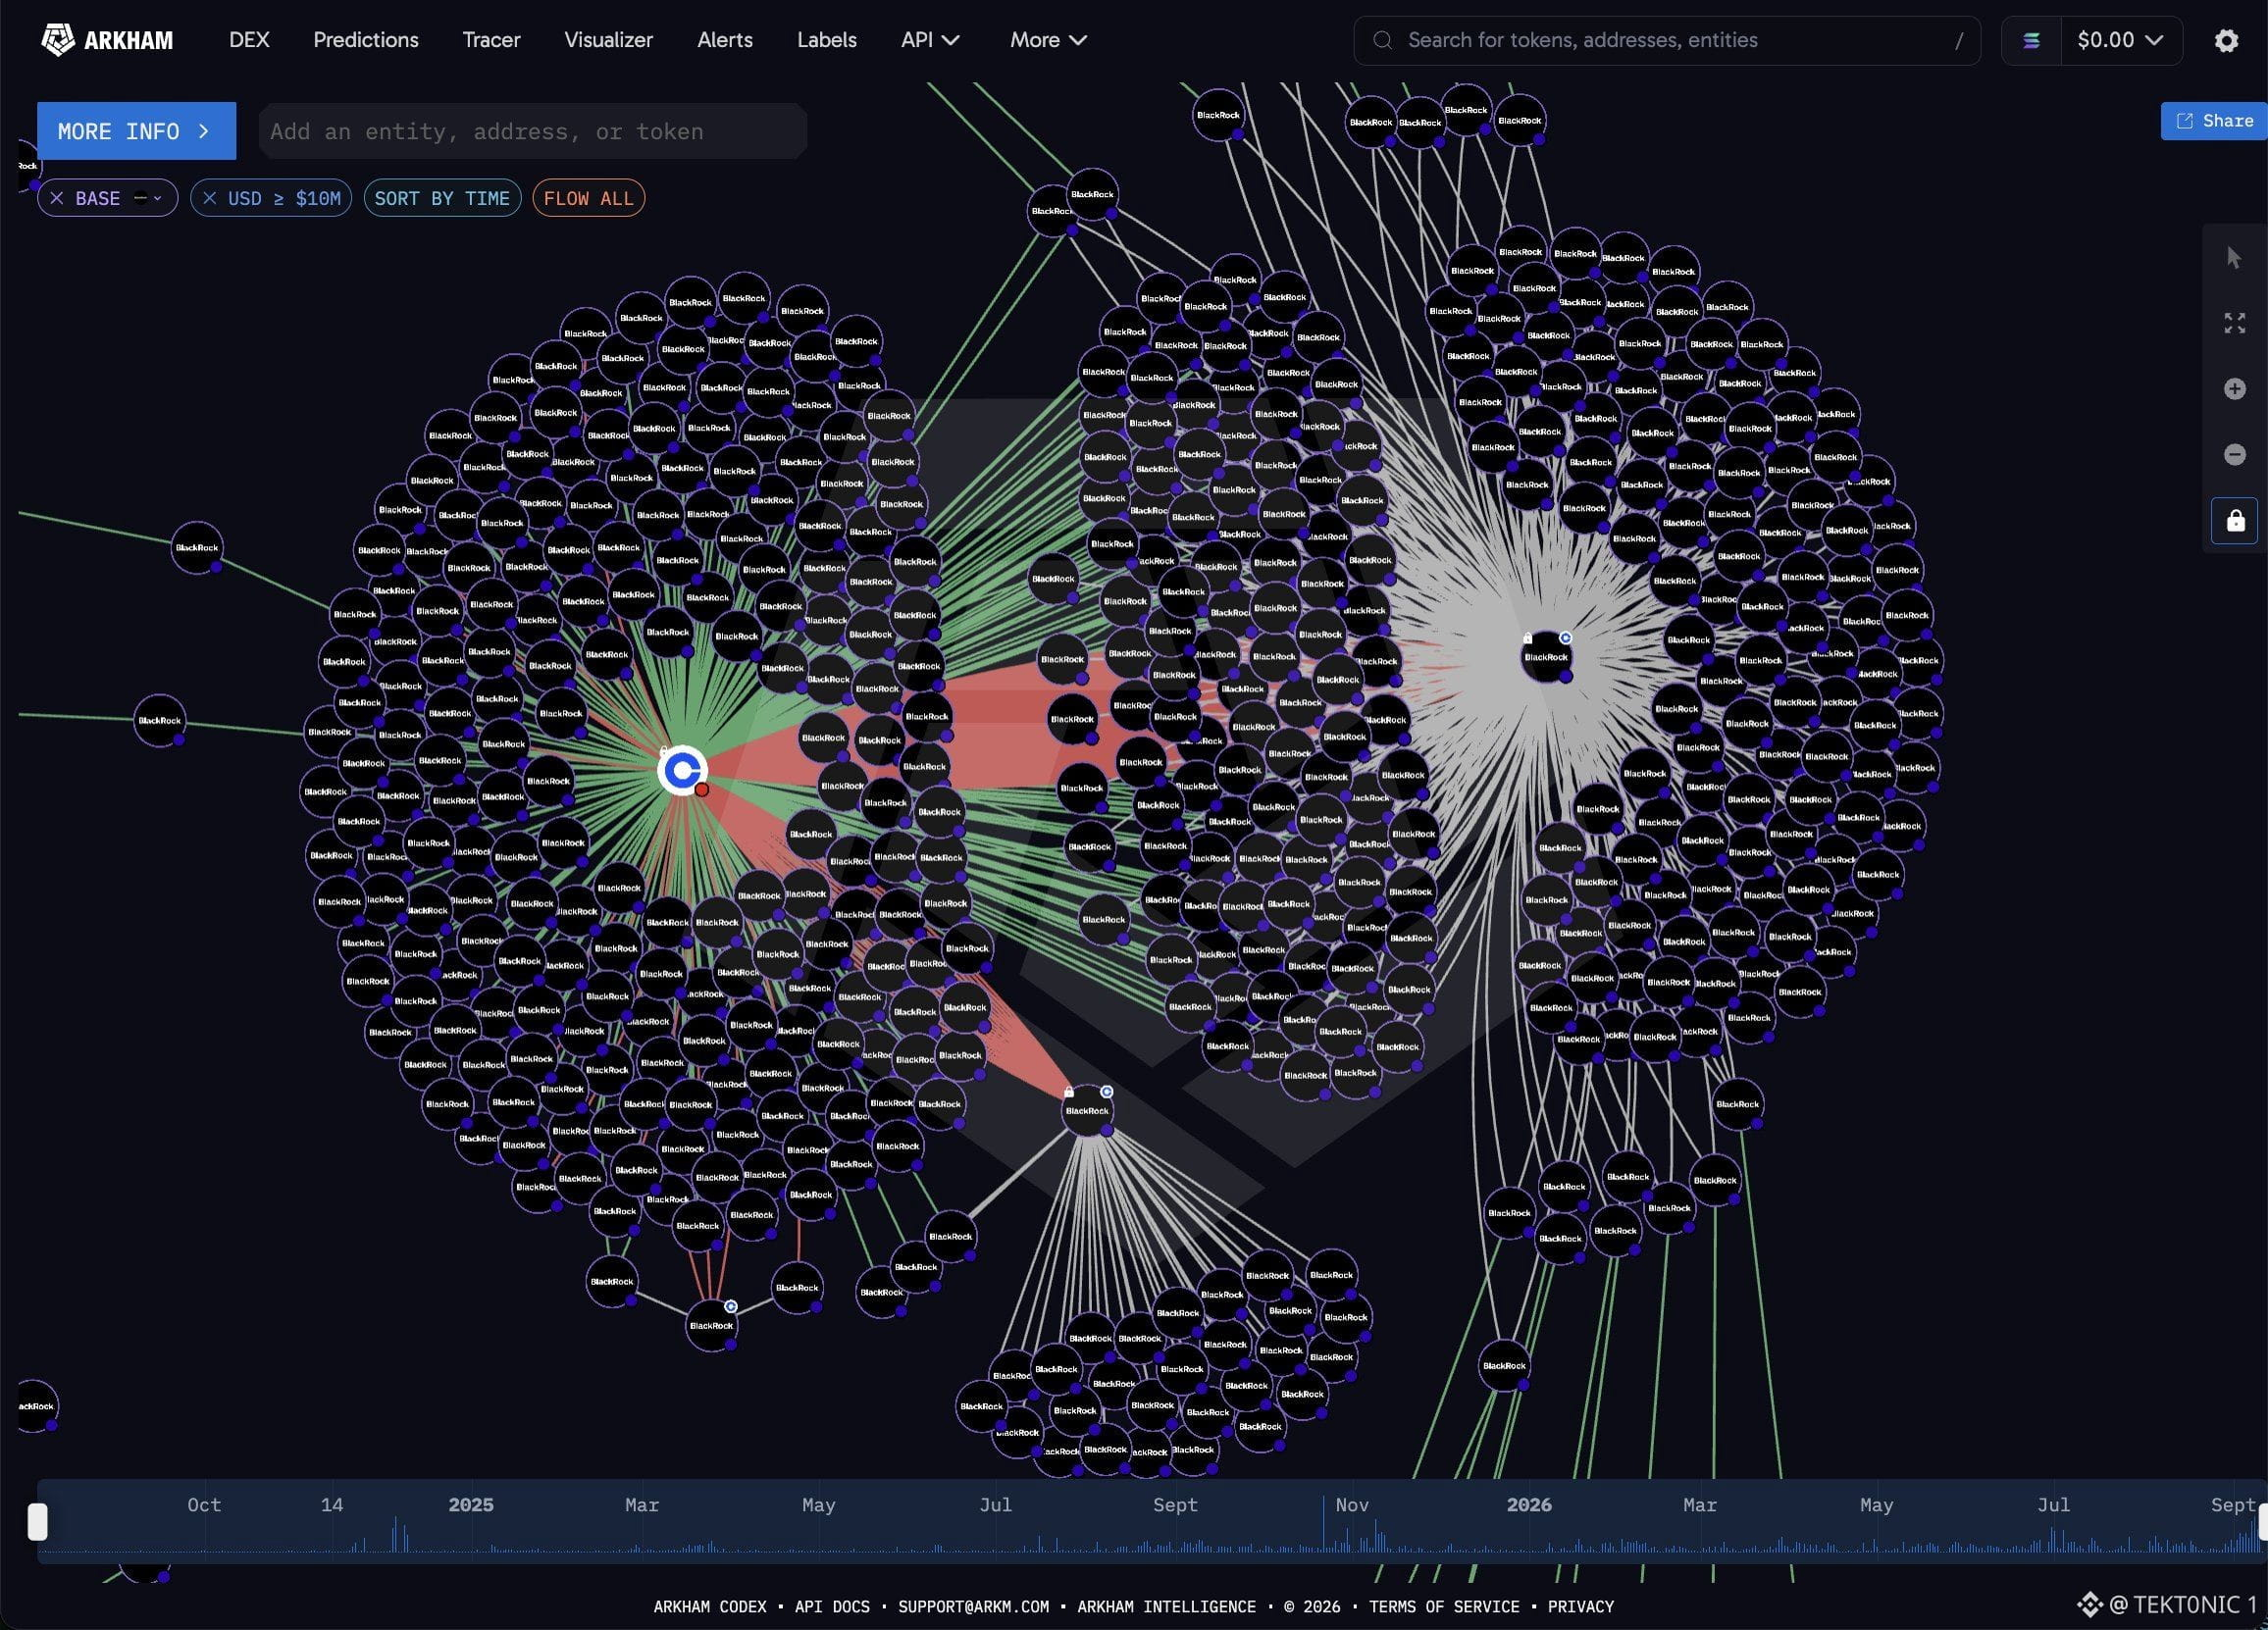
BlackRock’s ETHB Has Taken In $251 Million of Ether in 20 Straight Days One Ether product is buying. The others on the same day were not. According to the latest flow print, BlackRock’s ETHB bought $13.9 million of $ETH yesterday. Sister fund ETHA and Fidelity’s FETH both posted outflows. Over the last 20 trading days ETHB has added $251.4 million of Ether and has not recorded a single outflow day. Key Details: > ETHB yesterday: +$13.9 million. > ETHB over 20 sessions: +$251.4 million, no down days. > ETHA and FETH: outflows on the same day ETHB was green. > This is client demand into one BlackRock Ether share class, not a firm-wide call to sell Bitcoin. Twenty green days in one $ETH product is a real bid. It is not proof Wall Street has rotated out of Bitcoin. IBIT was still taking in hundreds of millions of $BTC earlier this month. The cleaner read is that ETH exposure is being added through ETHB while other Ether funds stay mixed. BlackRock ETHB: +$13.9M Yesterday, +$251M Over 20 Days, Zero Outflow Sessions Do you read a 20-day ETHB streak as Ether catching a bid, or as one share class filling while ETHA and FETH leak? #BTC Price Analysis# #Bitcoin Price Prediction: What is Bitcoins next move?# #Ethereum $BTC
BlackRock’s ETHB Has Taken In $251 Million of Ether in 20 Straight Days One Ether product is buying. The others on the same day were not. According to the latest flow print, BlackRock’s ETHB bought $13.9 million of $ETH yesterday. Sister fund ETHA and Fidelity’s FETH both posted outflows. Over the last 20 trading days ETHB has added $251.4 million of Ether and has not recorded a single outflow day. Key Details: > ETHB yesterday: +$13.9 million. > ETHB over 20 sessions: +$251.4 million, no down days. > ETHA and FETH: outflows on the same day ETHB was green. > This is client demand into one BlackRock Ether share class, not a firm-wide call to sell Bitcoin. Twenty green days in one $ETH product is a real bid. It is not proof Wall Street has rotated out of Bitcoin. IBIT was still taking in hundreds of millions of $BTC earlier this month. The cleaner read is that ETH exposure is being added through ETHB while other Ether funds stay mixed. BlackRock ETHB: +$13.9M Yesterday, +$251M Over 20 Days, Zero Outflow Sessions Do you read a 20-day ETHB streak as Ether catching a bid, or as one share class filling while ETHA and FETH leak? #BTC Price Analysis# #Bitcoin Price Prediction: What is Bitcoins next move?# #Ethereum $BTC
·
--
翻訳参照
About $1.5 Billion of Tokenized Assets Are Now Posted as Lending Collateral A wallet balance only shows the fund is held. Collateral shows it is being used. According to the latest lending-market tally, roughly $1.5 billion of tokenized real-world assets is working as collateral today — posted into protocols so someone can borrow against it. The Spiko EU T-bill example on Morpho is a small piece of that: collateral supplied has climbed above $2 million, with debt borrowed tracking just under that line since the April ramp. Key Details: > Tokenized assets used as lending collateral: about $1.5 billion. > Holding a tokenized fund in a wallet is custody. Posting it on Morpho or another market is financing. > Spiko EU T-bills on Morpho: collateral above $2 million, borrow a step below, flat since July. > The gap between the red and blue lines is unused collateral — supply that is posted but not fully drawn. $1.5 billion is still small next to crypto-native collateral. It is the first clean signal that tokenized T-bills and similar paper are leaving the “just sitting there” bucket. Watch whether that $1.5 billion figure keeps rising, not only whether more funds get issued. $1.5B Tokenized Assets Live as Lending Collateral — Spiko T-Bills on Morpho Above $2M #BTC Price Analysis# #Bitcoin Price Prediction: What is Bitcoins next move?# $BTC $XRP
About $1.5 Billion of Tokenized Assets Are Now Posted as Lending Collateral A wallet balance only shows the fund is held. Collateral shows it is being used. According to the latest lending-market tally, roughly $1.5 billion of tokenized real-world assets is working as collateral today — posted into protocols so someone can borrow against it. The Spiko EU T-bill example on Morpho is a small piece of that: collateral supplied has climbed above $2 million, with debt borrowed tracking just under that line since the April ramp. Key Details: > Tokenized assets used as lending collateral: about $1.5 billion. > Holding a tokenized fund in a wallet is custody. Posting it on Morpho or another market is financing. > Spiko EU T-bills on Morpho: collateral above $2 million, borrow a step below, flat since July. > The gap between the red and blue lines is unused collateral — supply that is posted but not fully drawn. $1.5 billion is still small next to crypto-native collateral. It is the first clean signal that tokenized T-bills and similar paper are leaving the “just sitting there” bucket. Watch whether that $1.5 billion figure keeps rising, not only whether more funds get issued. $1.5B Tokenized Assets Live as Lending Collateral — Spiko T-Bills on Morpho Above $2M #BTC Price Analysis# #Bitcoin Price Prediction: What is Bitcoins next move?# $BTC $XRP

·
--
Binanceはちょうど強い$ETHの買い(bid)を確認しました。5分足のETHUSDTチャートでは、価格が$2,433から$2,666まで上昇しました。現在はおよそ$2,603で推移しています。BinanceのUSDT累積ボリュームデルタは、そのスパイクで+7,425万を記録しました。これはメインペアにおける強気の積極的な成行買いです。セッションの安値は$2,433で、高値は$2,666でした。価格はすでに$2,550を回復しています。$2,550を上回る週足終値が、$3,000に向けた上昇を見守る節目です。ここが重要なのは、価格とともにCVDが上昇していることから、その上げが買いによるものであり、フローのない薄いスクイーズだけではないということです。注意点は、$3,000は目標であって約定(fill)ではない点です。同じ時間帯の他の$ETHペアはまちまちで、−1,658万の表示を含むものもありました。強いBinanceのインパルスは、週足の足が確定する前に失速することがあります。だからこそ、この買いは出現しました。とはいえ、週足終値が維持される必要があります。 #BTC Price Analysis# #Bitcoin Price Prediction: What is Bitcoins next move?# $BTC
Binanceはちょうど強い$ETHの買い(bid)を確認しました。5分足のETHUSDTチャートでは、価格が$2,433から$2,666まで上昇しました。現在はおよそ$2,603で推移しています。BinanceのUSDT累積ボリュームデルタは、そのスパイクで+7,425万を記録しました。これはメインペアにおける強気の積極的な成行買いです。セッションの安値は$2,433で、高値は$2,666でした。価格はすでに$2,550を回復しています。$2,550を上回る週足終値が、$3,000に向けた上昇を見守る節目です。ここが重要なのは、価格とともにCVDが上昇していることから、その上げが買いによるものであり、フローのない薄いスクイーズだけではないということです。注意点は、$3,000は目標であって約定(fill)ではない点です。同じ時間帯の他の$ETHペアはまちまちで、−1,658万の表示を含むものもありました。強いBinanceのインパルスは、週足の足が確定する前に失速することがあります。だからこそ、この買いは出現しました。とはいえ、週足終値が維持される必要があります。 #BTC Price Analysis# #Bitcoin Price Prediction: What is Bitcoins next move?# $BTC

·
--
翻訳参照
Kalshi Puts a 41% Chance on $HYPE Finishing 2026 at $100 or Higher The crowd’s base case is still a four-digit year-end. It is not a lock. According to Kalshi’s “HYPE price at the end of the year?” market, “$100 or above” is the leading bucket at 41%. HYPE is trading near $80, so that contract is asking whether it can add about 25% and hold it into December. The next listed bands are $85–$89 at 14%, $45–$49 at 12%, and $50–$54 at 10%. Key Details: > Year-end $100 or above: 41%. > $85–$89: 14%. > $45–$49: 12%. > $50–$54: 10%. Spot is near $80, so $100 is the nearest round-number target above the market. 41% is the most popular outcome on this board, not a majority. Add the mid-80s bucket and you get a decent cluster above today’s price. The lower bands show a real minority still pricing a fade back into the $45–$55 zone. CryptoRank’s new Prediction section now tracks these kinds of target probabilities in one place. $HYPE Year-End: 41% Odds of $100+, With $80 Spot #Bitcoin Price Prediction: What is Bitcoins next move?# #BTC Price Analysis# $BTC
Kalshi Puts a 41% Chance on $HYPE Finishing 2026 at $100 or Higher The crowd’s base case is still a four-digit year-end. It is not a lock. According to Kalshi’s “HYPE price at the end of the year?” market, “$100 or above” is the leading bucket at 41%. HYPE is trading near $80, so that contract is asking whether it can add about 25% and hold it into December. The next listed bands are $85–$89 at 14%, $45–$49 at 12%, and $50–$54 at 10%. Key Details: > Year-end $100 or above: 41%. > $85–$89: 14%. > $45–$49: 12%. > $50–$54: 10%. Spot is near $80, so $100 is the nearest round-number target above the market. 41% is the most popular outcome on this board, not a majority. Add the mid-80s bucket and you get a decent cluster above today’s price. The lower bands show a real minority still pricing a fade back into the $45–$55 zone. CryptoRank’s new Prediction section now tracks these kinds of target probabilities in one place. $HYPE Year-End: 41% Odds of $100+, With $80 Spot #Bitcoin Price Prediction: What is Bitcoins next move?# #BTC Price Analysis# $BTC

1
·
--
翻訳参照
UniCredit Weighs Crypto Custody and Brokerage Italy’s second-largest bank is looking at building the pipes to hold and trade digital assets, not just wrap them in a structured note. Bloomberg reported on September 11 that UniCredit is evaluating technology partners for custody and brokerage infrastructure. Talks are early. No final decision has been made. The work under review also includes tokenized investment products, fixed-income securities, stablecoin use, and client crypto exposure. That would be a step beyond what the bank has already done. It has sold professional clients a product linked to BlackRock’s IBIT, issued Italy’s first tokenized minibond on a public blockchain, joined the Qivalis group working on a euro stablecoin, and this week took a minority stake in German platform VC Trade. The move fits a wider European bank shift under MiCA. Custody and brokerage matter more than another one-off tokenized bond, because they are how client assets actually sit on the balance sheet of a large lender. This is still a review, not a launch. The signal is that a major Italian bank is now shopping for the infrastructure, not dismissing the category. #BTC Price Analysis# #Bitcoin Price Prediction: What is Bitcoins next move?# $BTC $XRP
UniCredit Weighs Crypto Custody and Brokerage Italy’s second-largest bank is looking at building the pipes to hold and trade digital assets, not just wrap them in a structured note. Bloomberg reported on September 11 that UniCredit is evaluating technology partners for custody and brokerage infrastructure. Talks are early. No final decision has been made. The work under review also includes tokenized investment products, fixed-income securities, stablecoin use, and client crypto exposure. That would be a step beyond what the bank has already done. It has sold professional clients a product linked to BlackRock’s IBIT, issued Italy’s first tokenized minibond on a public blockchain, joined the Qivalis group working on a euro stablecoin, and this week took a minority stake in German platform VC Trade. The move fits a wider European bank shift under MiCA. Custody and brokerage matter more than another one-off tokenized bond, because they are how client assets actually sit on the balance sheet of a large lender. This is still a review, not a launch. The signal is that a major Italian bank is now shopping for the infrastructure, not dismissing the category. #BTC Price Analysis# #Bitcoin Price Prediction: What is Bitcoins next move?# $BTC $XRP

ログインして、さらにコンテンツを読む
厳選トピックで世界の暗号資産トレーダーの仲間入り
⚡️ 暗号資産に関する最新かつ有益な情報が見つかります。
💬 世界最大の暗号資産取引所から信頼されています。
👍 認証を受けたクリエイターから、有益なインサイトを得られます。
メール / 電話番号
トレンドトピック
BitcoinCrosses$78000
閲覧回数 182
34人が討論中
$BTC 至急 最新情報 🚨 大きなチャンス‼️短期下落📉に備えよう
BTCは予想通りリバウンドしています。さらに、今回のリバウンドは78,000まで伸びる可能性があるため、エントリーは最大78,000まで拡大できます。
ストップロス:79,200
目標 🎯
TP1:77,150
TP2:76,450
TP3:75,750
TP4:75,000
$SOL と $ETH はビットコインに追随します。そして予測通り投げ売り(ダンプ)へ 🔥
常にDYOR(自己調査)して、1回の取引に全額を入れないでください
ここでショート 👇
#SECReceivesGrayscaleLitecoinTrustETFFiling #ClarityActFacesProceduralVoteSept15 #US10YearTreasuryYieldNears5%
Panda Traders
·いいね:13件
·閲覧回数 5.8k
AnthropicCEOCallsForAISlowdown
閲覧回数 133,038
2,244人が討論中
RevolutDataLeakReportedlyPostedAttackersThreatenDailyReleases
閲覧回数 1,270
47人が討論中