
Steve Cryptoo 1
369 投稿

Steve Cryptoo 1
報告
ユーザーをブロック
Crypto Advisor| Chart Analyst| Web3 Guru|
0 フォロー
3 フォロワー
18 いいね
投稿
翻訳参照
BITCOIN UNDER HEAVY SELLING PRESSURE — BEARS ARE IN CONTROL
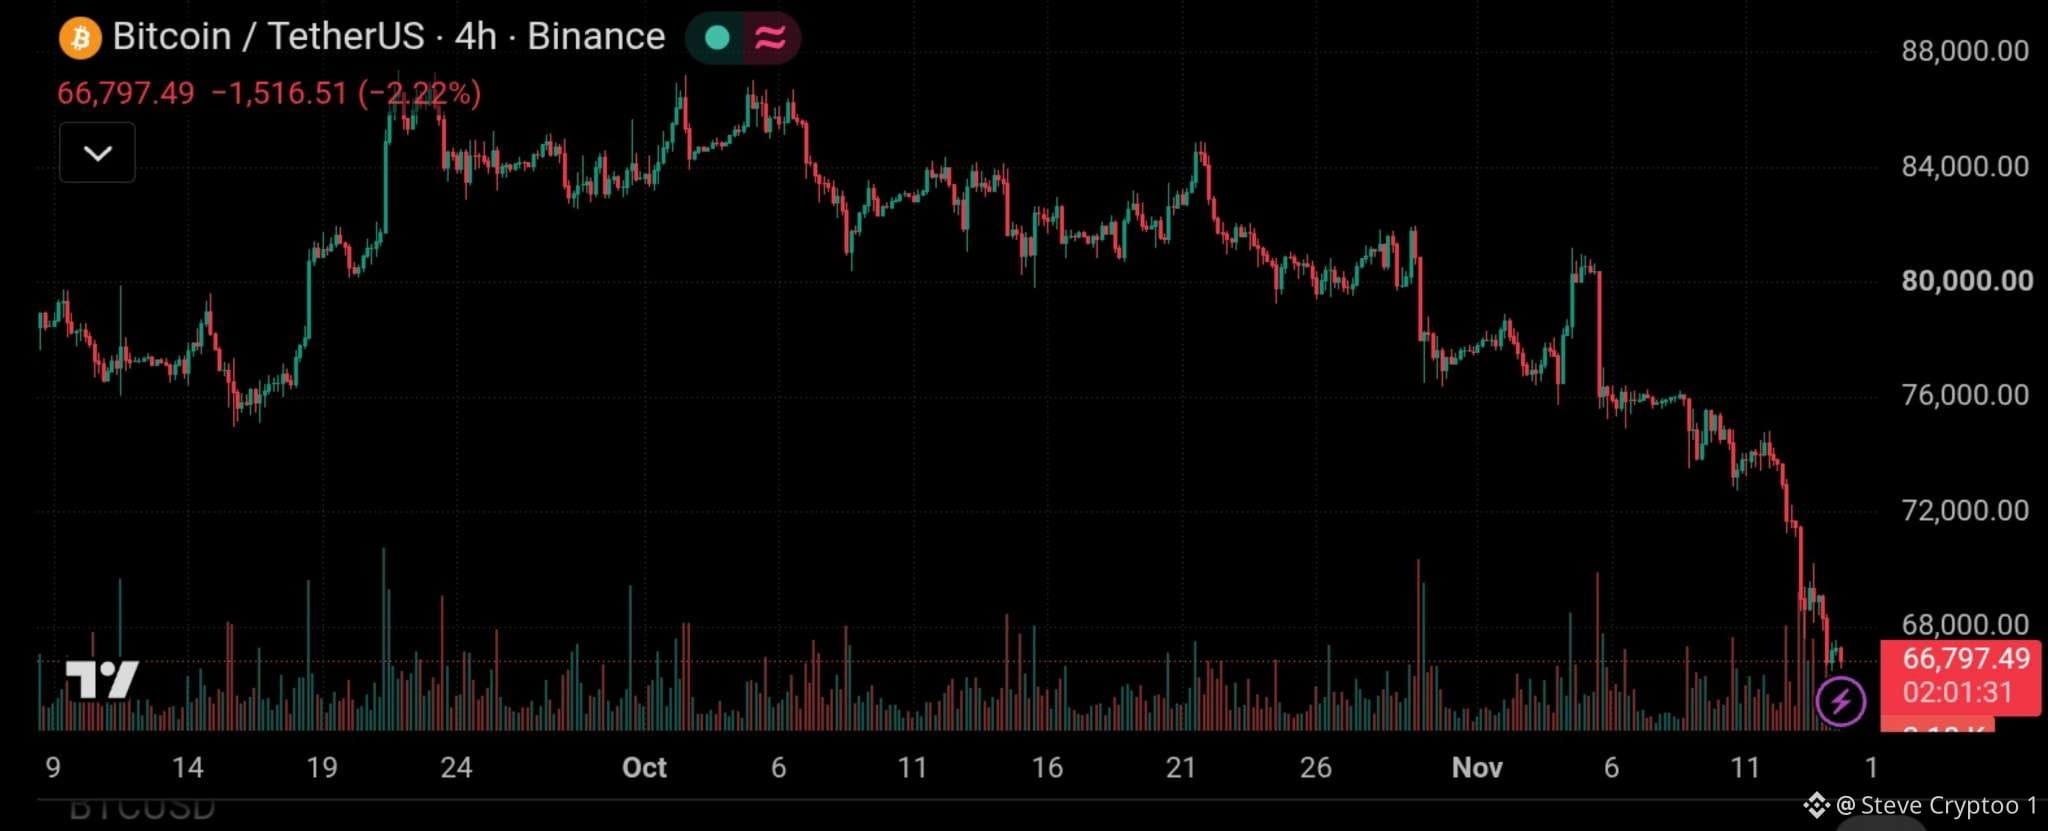
$BTC has taken another sharp hit, dropping to around $66,797 on the 4H chart, down approximately 2.22% at the time of the screenshot.
The technical picture is becoming increasingly bearish.
📉 What the chart tells us:
• BTC continues forming lower highs and lower lows.
• The $72,000 support zone has already given way.
• Price has now slipped below the important $68,000 level.
• Selling volume has increased during the latest breakdown, showing strong bearish pressure.
Key levels to watch:
🔴 Resistance: $68,000 – $72,000
🔴 Next resistance: $76,000
🟢 Immediate area to monitor: $66,000 – $65,000
What comes next?
Bulls need to reclaim $68K and establish support above it to improve the short-term outlook. Otherwise, further downside remains a possibility.
The broader market pressure is also significant, with ETF outflows, heavy liquidations and macroeconomic uncertainty weighing on sentiment.
#Bitcoin #BTC #CryptoMarket
BITCOIN UNDER HEAVY SELLING PRESSURE — BEARS ARE IN CONTROL
$BTC has taken another sharp hit, dropping to around $66,797 on the 4H chart, down approximately 2.22% at the time of the screenshot.
The technical picture is becoming increasingly bearish.
📉 What the chart tells us:
• BTC continues forming lower highs and lower lows.
• The $72,000 support zone has already given way.
• Price has now slipped below the important $68,000 level.
• Selling volume has increased during the latest breakdown, showing strong bearish pressure.
Key levels to watch:
🔴 Resistance: $68,000 – $72,000
🔴 Next resistance: $76,000
🟢 Immediate area to monitor: $66,000 – $65,000
What comes next?
Bulls need to reclaim $68K and establish support above it to improve the short-term outlook. Otherwise, further downside remains a possibility.
The broader market pressure is also significant, with ETF outflows, heavy liquidations and macroeconomic uncertainty weighing on sentiment.
#Bitcoin #BTC #CryptoMarket
$BTC has taken another sharp hit, dropping to around $66,797 on the 4H chart, down approximately 2.22% at the time of the screenshot.
The technical picture is becoming increasingly bearish.
📉 What the chart tells us:
• BTC continues forming lower highs and lower lows.
• The $72,000 support zone has already given way.
• Price has now slipped below the important $68,000 level.
• Selling volume has increased during the latest breakdown, showing strong bearish pressure.
Key levels to watch:
🔴 Resistance: $68,000 – $72,000
🔴 Next resistance: $76,000
🟢 Immediate area to monitor: $66,000 – $65,000
What comes next?
Bulls need to reclaim $68K and establish support above it to improve the short-term outlook. Otherwise, further downside remains a possibility.
The broader market pressure is also significant, with ETF outflows, heavy liquidations and macroeconomic uncertainty weighing on sentiment.
#Bitcoin #BTC #CryptoMarket
66
翻訳参照
RLUSD JUST FLIPPED PYUSD!
Ripple is gaining ground in the stablecoin market.
According to DefiLlama, Ripple’s $RLUSD has overtaken PayPal’s $PYUSD to become the 7th-largest stablecoin by market capitalization.
Here's where they stand:
🔹 $RLUSD : $2.70B
🔹 $PYUSD: $2.63B
The gap is relatively small, but the milestone is significant.
Ripple continues to strengthen its position in the stablecoin space, showing how competition is heating up among major financial players.
Stablecoin adoption is growing, and the race is far from over. 👀
#Ripple #Stablecoins #PYUSD
RLUSD JUST FLIPPED PYUSD!
Ripple is gaining ground in the stablecoin market.
According to DefiLlama, Ripple’s $RLUSD has overtaken PayPal’s $PYUSD to become the 7th-largest stablecoin by market capitalization.
Here's where they stand:
🔹 $RLUSD : $2.70B
🔹 $PYUSD: $2.63B
The gap is relatively small, but the milestone is significant.
Ripple continues to strengthen its position in the stablecoin space, showing how competition is heating up among major financial players.
Stablecoin adoption is growing, and the race is far from over. 👀
#Ripple #Stablecoins #PYUSD
Ripple is gaining ground in the stablecoin market.
According to DefiLlama, Ripple’s $RLUSD has overtaken PayPal’s $PYUSD to become the 7th-largest stablecoin by market capitalization.
Here's where they stand:
🔹 $RLUSD : $2.70B
🔹 $PYUSD: $2.63B
The gap is relatively small, but the milestone is significant.
Ripple continues to strengthen its position in the stablecoin space, showing how competition is heating up among major financial players.
Stablecoin adoption is growing, and the race is far from over. 👀
#Ripple #Stablecoins #PYUSD

67
翻訳参照
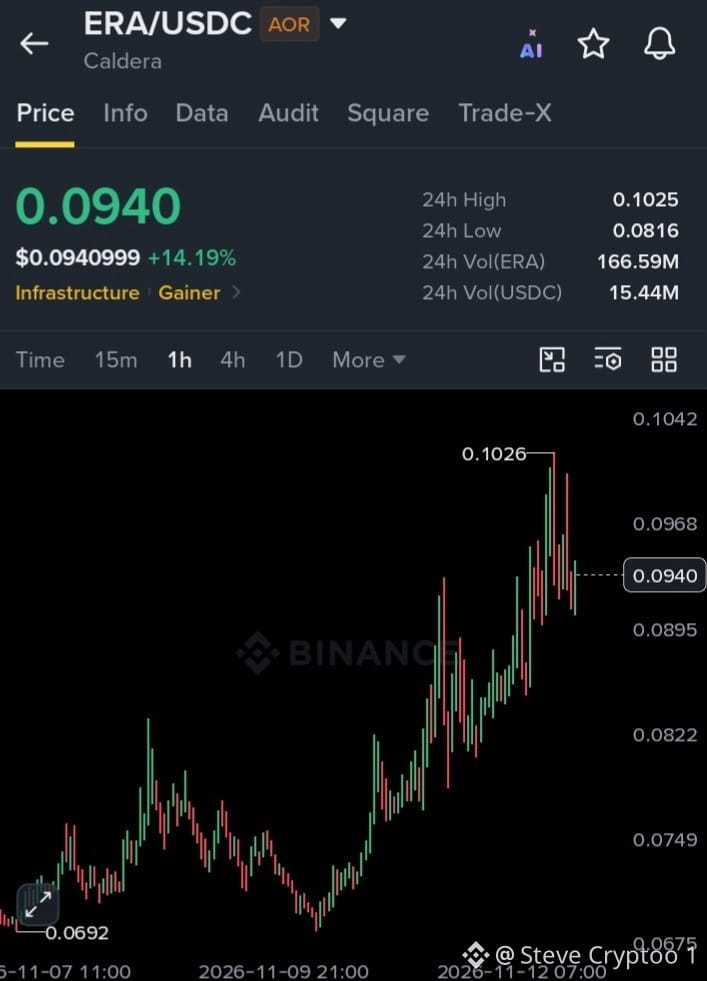
$ERA IS SHOWING SERIOUS BULLISH MOMENTUM! Can Caldera push toward $0.11?
$ERA /USDC is gaining strength, currently trading around $0.0940, up 14.19% in 24 hours.
The 1H chart is showing a clear recovery structure, with higher highs and higher lows.
Buyers are still active, but the next resistance zone will be important.
📊 Key Technical Levels:
🟢 Upside Targets:
TP1: $0.0980
TP2: $0.1025
TP3: $0.1060
TP4: $0.1120
🔴 Important Support Zones:
Support 1: $0.0895
Support 2: $0.0822
Major support: $0.0749
What to Watch Next:
$0.0968 is the first important resistance to watch. A strong 1H close above this level could bring another attempt at $0.1025.
A confirmed breakout above $0.1025 could open the door toward $0.1060 and potentially $0.1120.
#BTC Price Analysis# #Macro Insights#
$ERA IS SHOWING SERIOUS BULLISH MOMENTUM! Can Caldera push toward $0.11?
$ERA /USDC is gaining strength, currently trading around $0.0940, up 14.19% in 24 hours.
The 1H chart is showing a clear recovery structure, with higher highs and higher lows.
Buyers are still active, but the next resistance zone will be important.
📊 Key Technical Levels:
🟢 Upside Targets:
TP1: $0.0980
TP2: $0.1025
TP3: $0.1060
TP4: $0.1120
🔴 Important Support Zones:
Support 1: $0.0895
Support 2: $0.0822
Major support: $0.0749
What to Watch Next:
$0.0968 is the first important resistance to watch. A strong 1H close above this level could bring another attempt at $0.1025.
A confirmed breakout above $0.1025 could open the door toward $0.1060 and potentially $0.1120.
#BTC Price Analysis# #Macro Insights#
$ERA /USDC is gaining strength, currently trading around $0.0940, up 14.19% in 24 hours.
The 1H chart is showing a clear recovery structure, with higher highs and higher lows.
Buyers are still active, but the next resistance zone will be important.
📊 Key Technical Levels:
🟢 Upside Targets:
TP1: $0.0980
TP2: $0.1025
TP3: $0.1060
TP4: $0.1120
🔴 Important Support Zones:
Support 1: $0.0895
Support 2: $0.0822
Major support: $0.0749
What to Watch Next:
$0.0968 is the first important resistance to watch. A strong 1H close above this level could bring another attempt at $0.1025.
A confirmed breakout above $0.1025 could open the door toward $0.1060 and potentially $0.1120.
#BTC Price Analysis# #Macro Insights#
56
翻訳参照
$BTC has seen it all, but history keeps teaching the same lesson: volatility is part of the journey. 🟠
Look at Bitcoin’s price on November 11 over the years:
2016: $715 2017: $6,350 2018: $6,375 2019: $8,750 2020: $15,700 2021: $64,900 2022: $17,000 2023: $37,000 2024: $88,000 2025: $103,000 2026: $74,000
Now look at the bigger picture.
Bitcoin has experienced major corrections, painful bear markets, and periods when confidence was low. Yet it has continued to evolve through multiple market cycles.
What about the current chart?
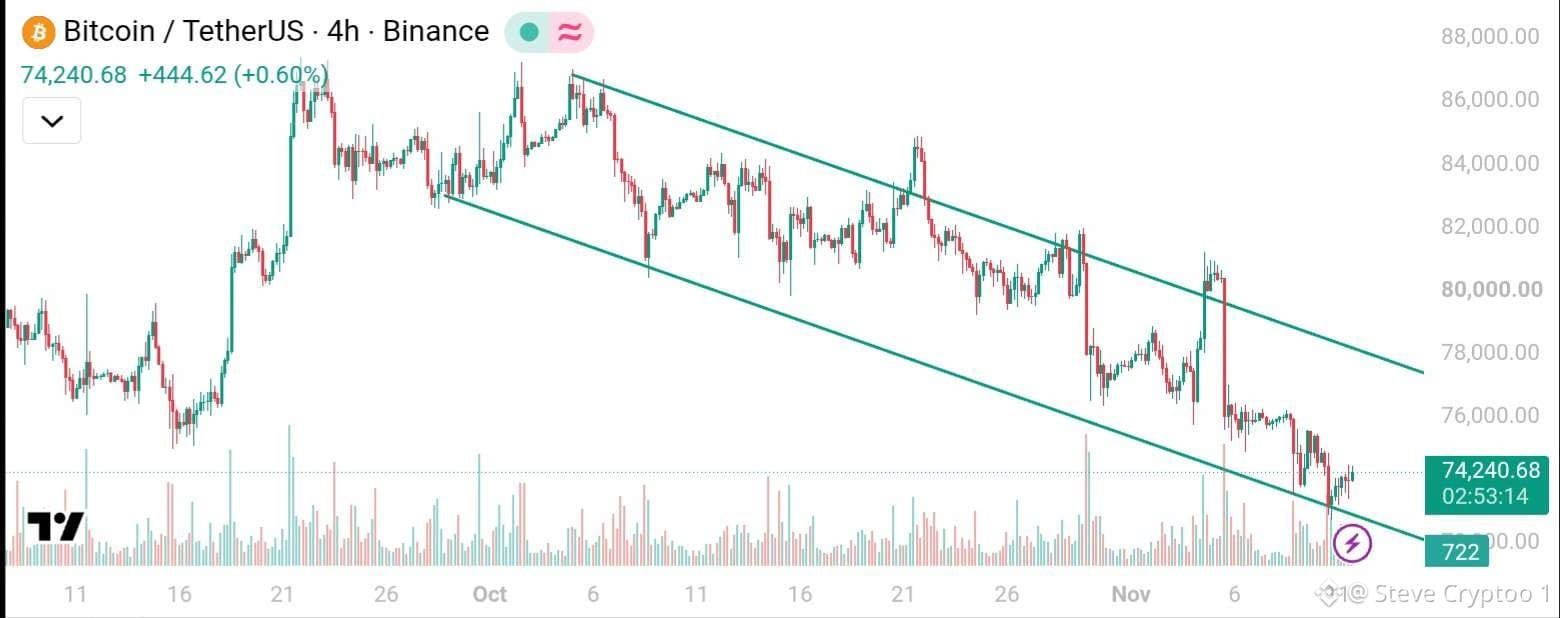
BTC is trading around $74K on the 4H timeframe, moving inside a descending channel. Price is approaching the lower boundary, making this an important technical area to watch.
A sustained bounce could offer a recovery opportunity, while a breakdown may open the door to further downside.
The key is confirmation, not assumptions.
Markets move in cycles. Patience and perspective matter.
Don't let short-term volatility erase the bigger picture.
#BTC Price Analysis# #Macro Insights#
$BTC has seen it all, but history keeps teaching the same lesson: volatility is part of the journey. 🟠
Look at Bitcoin’s price on November 11 over the years:
2016: $715 2017: $6,350 2018: $6,375 2019: $8,750 2020: $15,700 2021: $64,900 2022: $17,000 2023: $37,000 2024: $88,000 2025: $103,000 2026: $74,000
Now look at the bigger picture.
Bitcoin has experienced major corrections, painful bear markets, and periods when confidence was low. Yet it has continued to evolve through multiple market cycles.
What about the current chart?
BTC is trading around $74K on the 4H timeframe, moving inside a descending channel. Price is approaching the lower boundary, making this an important technical area to watch.
A sustained bounce could offer a recovery opportunity, while a breakdown may open the door to further downside.
The key is confirmation, not assumptions.
Markets move in cycles. Patience and perspective matter.
Don't let short-term volatility erase the bigger picture.
#BTC Price Analysis# #Macro Insights#
Look at Bitcoin’s price on November 11 over the years:
2016: $715 2017: $6,350 2018: $6,375 2019: $8,750 2020: $15,700 2021: $64,900 2022: $17,000 2023: $37,000 2024: $88,000 2025: $103,000 2026: $74,000
Now look at the bigger picture.
Bitcoin has experienced major corrections, painful bear markets, and periods when confidence was low. Yet it has continued to evolve through multiple market cycles.
What about the current chart?
BTC is trading around $74K on the 4H timeframe, moving inside a descending channel. Price is approaching the lower boundary, making this an important technical area to watch.
A sustained bounce could offer a recovery opportunity, while a breakdown may open the door to further downside.
The key is confirmation, not assumptions.
Markets move in cycles. Patience and perspective matter.
Don't let short-term volatility erase the bigger picture.
#BTC Price Analysis# #Macro Insights#
76
翻訳参照
$XRP THE DIP IS GETTING INTERESTING 👀
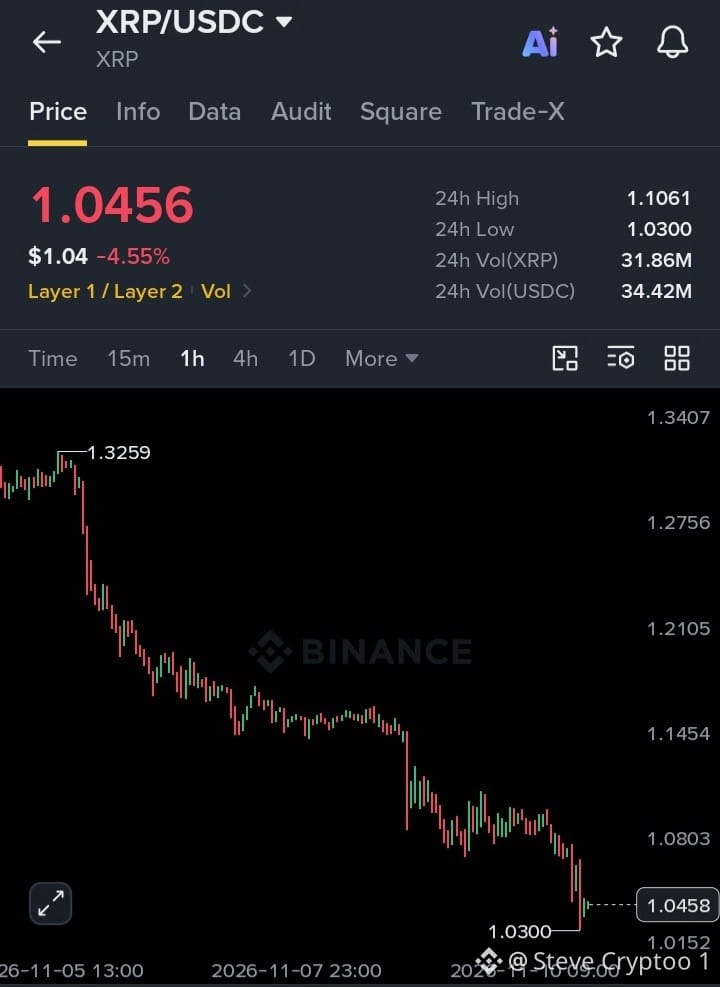
$XRP is showing a significant pullback, but the current zone deserves attention.
On the 1H chart, XRP has dropped from around $1.3259 to a recent low of $1.0300, putting strong selling pressure on the market.
Here's what I'm watching:
🔹 Key Support: $1.0300 — critical zone for buyers to defend.
🔹 Immediate Resistance: $1.0800 — reclaiming this level could be the first sign of improving momentum.
🔹 Next Resistance: $1.1450 — an important level for a stronger recovery attempt.
🔹 Major Resistance: $1.2100.
My Take:
This could be an interesting dip-buying zone, but catching a falling market without confirmation is risky.
#BTC Price Analysis# #Macro Insights#
$XRP THE DIP IS GETTING INTERESTING 👀
$XRP is showing a significant pullback, but the current zone deserves attention.
On the 1H chart, XRP has dropped from around $1.3259 to a recent low of $1.0300, putting strong selling pressure on the market.
Here's what I'm watching:
🔹 Key Support: $1.0300 — critical zone for buyers to defend.
🔹 Immediate Resistance: $1.0800 — reclaiming this level could be the first sign of improving momentum.
🔹 Next Resistance: $1.1450 — an important level for a stronger recovery attempt.
🔹 Major Resistance: $1.2100.
My Take:
This could be an interesting dip-buying zone, but catching a falling market without confirmation is risky.
#BTC Price Analysis# #Macro Insights#
$XRP is showing a significant pullback, but the current zone deserves attention.
On the 1H chart, XRP has dropped from around $1.3259 to a recent low of $1.0300, putting strong selling pressure on the market.
Here's what I'm watching:
🔹 Key Support: $1.0300 — critical zone for buyers to defend.
🔹 Immediate Resistance: $1.0800 — reclaiming this level could be the first sign of improving momentum.
🔹 Next Resistance: $1.1450 — an important level for a stronger recovery attempt.
🔹 Major Resistance: $1.2100.
My Take:
This could be an interesting dip-buying zone, but catching a falling market without confirmation is risky.
#BTC Price Analysis# #Macro Insights#
76
ビットコインは見慣れた週足パターンを繰り返しています。次の大きなブレイクアウトが近づいているのでしょうか?
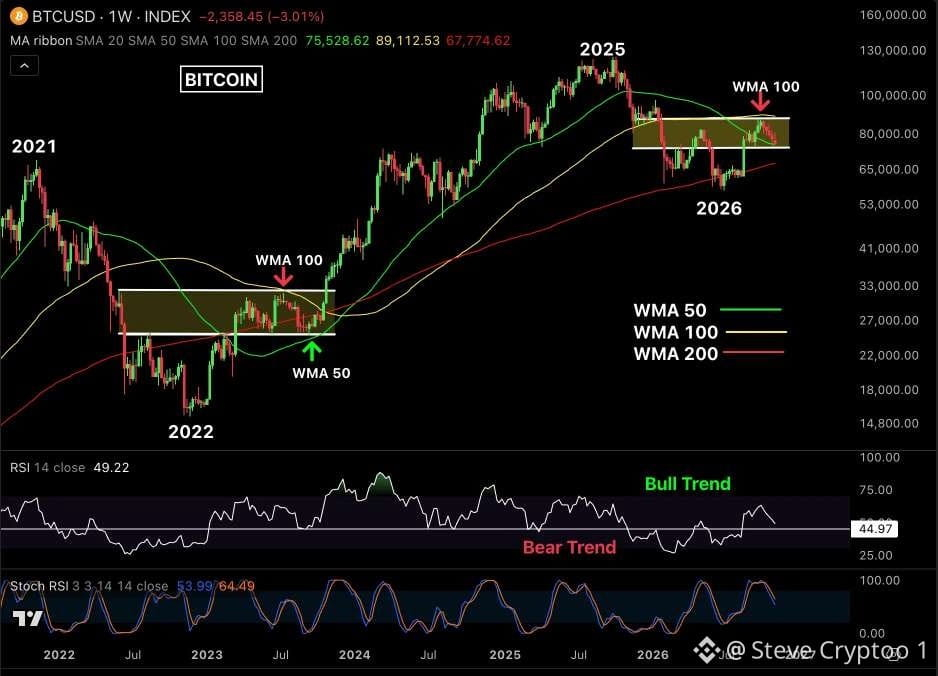
現在の $BTC のチャートは、ビットコインが週足MA 50と週足MA 100の間で持ち合った後、力強い上昇に転じた2023年とよく似ています。
そして2026年、同様のパターンが形成されつつあります。
週足MA 100付近の87,400ドルで上値を抑えられた後、ビットコインは再び重要なレンジ内で取引されています。
注目すべき重要水準:
🟢 サポート • 週足MA 50:75,500ドル • 週足MA 200:67,800ドル
🔴 レジスタンス • 直近:82,000ドル • 主要:87,400ドル(週足MA 100)
モメンタムの確認:
• RSIが50付近にあり、モメンタムは中立を示しています
• ストキャスティクスRSIは弱含んでおり、短期的な下落の可能性を示唆しています。
• 週足MA 100を上回る動きが続けば、強気の見通しが強まるでしょう。
私の見解:
2023年との比較は興味深いものの、過去のパターンが繰り返されるとは限りません。
ビットコインは重要なサポート水準を維持し、週足の終値で確認したうえで週足MA 100を再び上回る必要があります。
ブレイクアウトに成功すれば、さらなる大幅上昇への道が開ける可能性があります。一方、サポートを割り込めば、強気のチャート構造は弱まるでしょう。
大切なのは焦らないことです。次の方向性は週足ローソク足で確認しましょう。
#BTC価格分析# #マクロ経済の洞察#
ビットコインは見慣れた週足パターンを繰り返しています。次の大きなブレイクアウトが近づいているのでしょうか?
現在の $BTC のチャートは、ビットコインが週足MA 50と週足MA 100の間で持ち合った後、力強い上昇に転じた2023年とよく似ています。
そして2026年、同様のパターンが形成されつつあります。
週足MA 100付近の87,400ドルで上値を抑えられた後、ビットコインは再び重要なレンジ内で取引されています。
注目すべき重要水準:
🟢 サポート • 週足MA 50:75,500ドル • 週足MA 200:67,800ドル
🔴 レジスタンス • 直近:82,000ドル • 主要:87,400ドル(週足MA 100)
モメンタムの確認:
• RSIが50付近にあり、モメンタムは中立を示しています
• ストキャスティクスRSIは弱含んでおり、短期的な下落の可能性を示唆しています。
• 週足MA 100を上回る動きが続けば、強気の見通しが強まるでしょう。
私の見解:
2023年との比較は興味深いものの、過去のパターンが繰り返されるとは限りません。
ビットコインは重要なサポート水準を維持し、週足の終値で確認したうえで週足MA 100を再び上回る必要があります。
ブレイクアウトに成功すれば、さらなる大幅上昇への道が開ける可能性があります。一方、サポートを割り込めば、強気のチャート構造は弱まるでしょう。
大切なのは焦らないことです。次の方向性は週足ローソク足で確認しましょう。
#BTC価格分析# #マクロ経済の洞察#
現在の $BTC のチャートは、ビットコインが週足MA 50と週足MA 100の間で持ち合った後、力強い上昇に転じた2023年とよく似ています。
そして2026年、同様のパターンが形成されつつあります。
週足MA 100付近の87,400ドルで上値を抑えられた後、ビットコインは再び重要なレンジ内で取引されています。
注目すべき重要水準:
🟢 サポート • 週足MA 50:75,500ドル • 週足MA 200:67,800ドル
🔴 レジスタンス • 直近:82,000ドル • 主要:87,400ドル(週足MA 100)
モメンタムの確認:
• RSIが50付近にあり、モメンタムは中立を示しています
• ストキャスティクスRSIは弱含んでおり、短期的な下落の可能性を示唆しています。
• 週足MA 100を上回る動きが続けば、強気の見通しが強まるでしょう。
私の見解:
2023年との比較は興味深いものの、過去のパターンが繰り返されるとは限りません。
ビットコインは重要なサポート水準を維持し、週足の終値で確認したうえで週足MA 100を再び上回る必要があります。
ブレイクアウトに成功すれば、さらなる大幅上昇への道が開ける可能性があります。一方、サポートを割り込めば、強気のチャート構造は弱まるでしょう。
大切なのは焦らないことです。次の方向性は週足ローソク足で確認しましょう。
#BTC価格分析# #マクロ経済の洞察#
55
暗号資産市場は不確実性に満ちており、予測市場は変化する市場の見通しを追う興味深い方法を提供します。
@polymarket は、主要な暗号資産をめぐる重要な問いに注目しています。
₿ $BTC — ビットコインは市場の主導的地位を維持できるでしょうか?
ETH — イーサリアムは勢いを取り戻せるでしょうか?
$DOGE — ドージコインは再び注目を集められるでしょうか?
✕ $XRP — XRPは市場での存在感をさらに高められるでしょうか?
各資産にはそれぞれ異なる物語がありますが、市場心理、流動性、今後の展開は引き続き重要な要素となるでしょう。
興味深いのは、次に何が起きるかを予測することだけではなく、市場がそう予想する理由を理解することです。
#Polymarket #BTC価格分析# #マクロの洞察#
暗号資産市場は不確実性に満ちており、予測市場は変化する市場の見通しを追う興味深い方法を提供します。
@polymarket は、主要な暗号資産をめぐる重要な問いに注目しています。
₿ $BTC — ビットコインは市場の主導的地位を維持できるでしょうか?
ETH — イーサリアムは勢いを取り戻せるでしょうか?
$DOGE — ドージコインは再び注目を集められるでしょうか?
✕ $XRP — XRPは市場での存在感をさらに高められるでしょうか?
各資産にはそれぞれ異なる物語がありますが、市場心理、流動性、今後の展開は引き続き重要な要素となるでしょう。
興味深いのは、次に何が起きるかを予測することだけではなく、市場がそう予想する理由を理解することです。
#Polymarket #BTC価格分析# #マクロの洞察#
@polymarket は、主要な暗号資産をめぐる重要な問いに注目しています。
₿ $BTC — ビットコインは市場の主導的地位を維持できるでしょうか?
ETH — イーサリアムは勢いを取り戻せるでしょうか?
$DOGE — ドージコインは再び注目を集められるでしょうか?
✕ $XRP — XRPは市場での存在感をさらに高められるでしょうか?
各資産にはそれぞれ異なる物語がありますが、市場心理、流動性、今後の展開は引き続き重要な要素となるでしょう。
興味深いのは、次に何が起きるかを予測することだけではなく、市場がそう予想する理由を理解することです。
#Polymarket #BTC価格分析# #マクロの洞察#

71
$RUNE、強い上昇モメンタムを示す | 重要なレジスタンスが目前
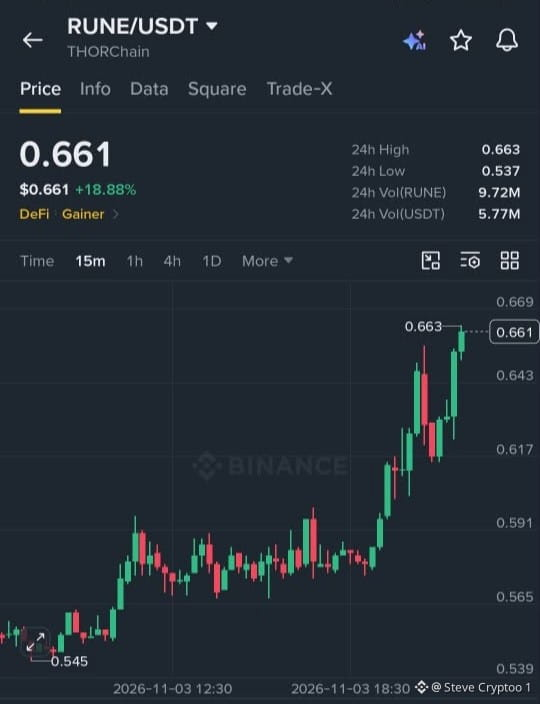
$RUNEは目覚ましい値動きを見せており、15分足チャートでは現在、約$0.661(+18.88%)で取引されています。
重要なテクニカル水準:
🔹 レジスタンス:$0.663–$0.669
🔹 サポート1:$0.643
🔹 サポート2:$0.617
🔹 主要サポート:$0.591
次の展開は?
強い出来高を伴って$0.663–$0.669を明確に上抜ければ、さらなる上昇への道が開ける可能性があります。
私の見解:モメンタムは明らかに買い手優勢ですが、確認が重要です。レジスタンスゾーンを注意深く見守りましょう。
#BTC価格分析# #マクロインサイト#
$RUNE、強い上昇モメンタムを示す | 重要なレジスタンスが目前
$RUNEは目覚ましい値動きを見せており、15分足チャートでは現在、約$0.661(+18.88%)で取引されています。
重要なテクニカル水準:
🔹 レジスタンス:$0.663–$0.669
🔹 サポート1:$0.643
🔹 サポート2:$0.617
🔹 主要サポート:$0.591
次の展開は?
強い出来高を伴って$0.663–$0.669を明確に上抜ければ、さらなる上昇への道が開ける可能性があります。
私の見解:モメンタムは明らかに買い手優勢ですが、確認が重要です。レジスタンスゾーンを注意深く見守りましょう。
#BTC価格分析# #マクロインサイト#
$RUNEは目覚ましい値動きを見せており、15分足チャートでは現在、約$0.661(+18.88%)で取引されています。
重要なテクニカル水準:
🔹 レジスタンス:$0.663–$0.669
🔹 サポート1:$0.643
🔹 サポート2:$0.617
🔹 主要サポート:$0.591
次の展開は?
強い出来高を伴って$0.663–$0.669を明確に上抜ければ、さらなる上昇への道が開ける可能性があります。
私の見解:モメンタムは明らかに買い手優勢ですが、確認が重要です。レジスタンスゾーンを注意深く見守りましょう。
#BTC価格分析# #マクロインサイト#
73
市場が先行きを読みにくい状況が続くなか、大口投資家が動いています。
Strategyはさらに811 $BTC(6,550万ドル相当)を追加し、保有総数は849,327 $BTCという驚異的な規模に達しました。
一方、Metaplanetは10月14日から31日にかけて、252億7,000万円で9,645万株を買い戻しました。
大きな動きが2つ。明らかなことは、企業のビットコイン戦略が引き続き注目の的だということです。
機関投資家の動向に注目です。
#Bitcoin #Metaplanet #Strategy
市場が先行きを読みにくい状況が続くなか、大口投資家が動いています。
Strategyはさらに811 $BTC(6,550万ドル相当)を追加し、保有総数は849,327 $BTCという驚異的な規模に達しました。
一方、Metaplanetは10月14日から31日にかけて、252億7,000万円で9,645万株を買い戻しました。
大きな動きが2つ。明らかなことは、企業のビットコイン戦略が引き続き注目の的だということです。
機関投資家の動向に注目です。
#Bitcoin #Metaplanet #Strategy
Strategyはさらに811 $BTC(6,550万ドル相当)を追加し、保有総数は849,327 $BTCという驚異的な規模に達しました。
一方、Metaplanetは10月14日から31日にかけて、252億7,000万円で9,645万株を買い戻しました。
大きな動きが2つ。明らかなことは、企業のビットコイン戦略が引き続き注目の的だということです。
機関投資家の動向に注目です。
#Bitcoin #Metaplanet #Strategy


53
$ZAMA — 強気派が主導権を取り戻しつつある!
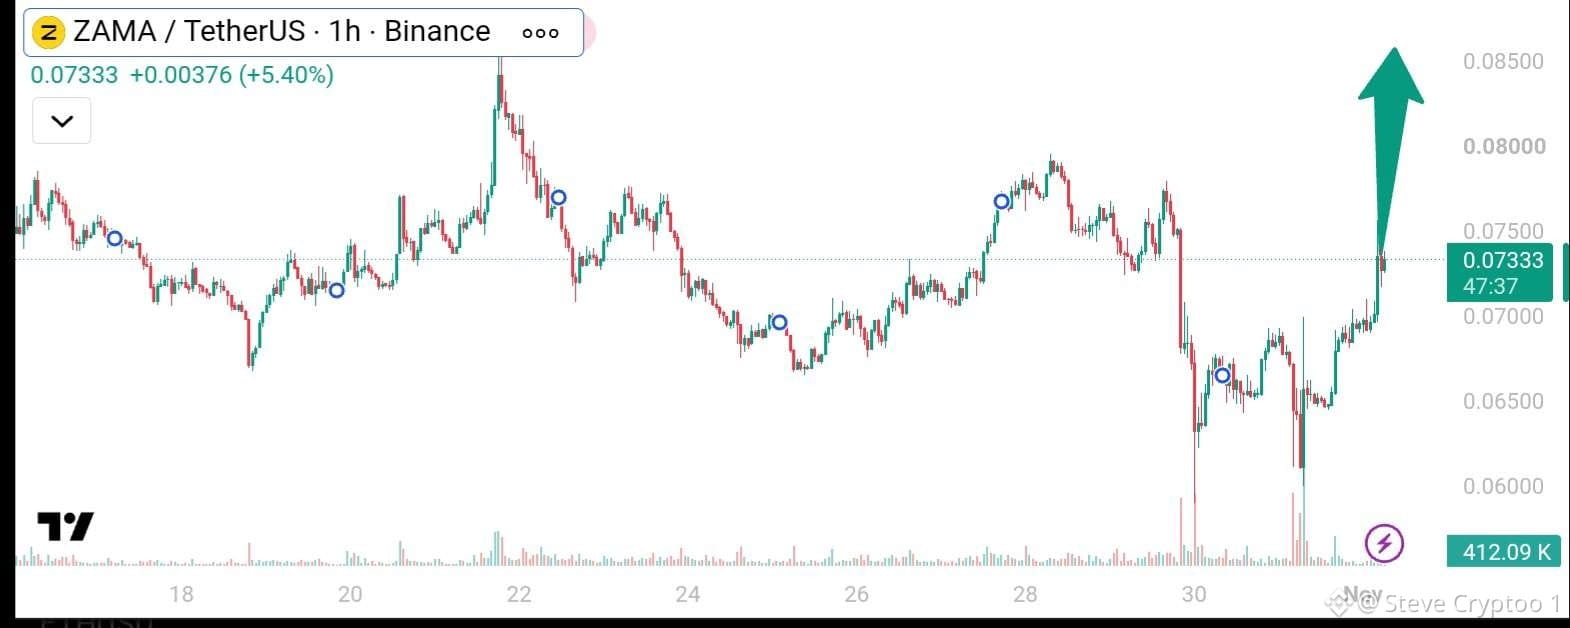
ZAMAは1時間足チャートで力強い回復を見せており、$0.061~$0.065のサポートゾーンから反発した後、現在は約$0.0733(+5.40%)で取引されています。
主なテクニカル水準:
直近のサポート:$0.070~$0.071
主要サポート:$0.065~$0.067
レジスタンス:$0.075~$0.078
上値目標:$0.080~$0.085
市場の見通し:買い手は徐々に勢いを取り戻しており、直近の回復は短期的なセンチメントの改善を示唆しています。
出来高の増加を伴って、1時間足のローソク足が$0.075~$0.078を上回って強く引ければ、強気のチャート構造が強まり、$0.080、さらには$0.085を目指す展開につながる可能性があります。
ただし、レジスタンスで反落した場合、$0.070のサポートゾーンを再び試す展開となる可能性があります。
#BTC価格分析# #マクロ分析#
$ZAMA — 強気派が主導権を取り戻しつつある!
ZAMAは1時間足チャートで力強い回復を見せており、$0.061~$0.065のサポートゾーンから反発した後、現在は約$0.0733(+5.40%)で取引されています。
主なテクニカル水準:
直近のサポート:$0.070~$0.071
主要サポート:$0.065~$0.067
レジスタンス:$0.075~$0.078
上値目標:$0.080~$0.085
市場の見通し:買い手は徐々に勢いを取り戻しており、直近の回復は短期的なセンチメントの改善を示唆しています。
出来高の増加を伴って、1時間足のローソク足が$0.075~$0.078を上回って強く引ければ、強気のチャート構造が強まり、$0.080、さらには$0.085を目指す展開につながる可能性があります。
ただし、レジスタンスで反落した場合、$0.070のサポートゾーンを再び試す展開となる可能性があります。
#BTC価格分析# #マクロ分析#
ZAMAは1時間足チャートで力強い回復を見せており、$0.061~$0.065のサポートゾーンから反発した後、現在は約$0.0733(+5.40%)で取引されています。
主なテクニカル水準:
直近のサポート:$0.070~$0.071
主要サポート:$0.065~$0.067
レジスタンス:$0.075~$0.078
上値目標:$0.080~$0.085
市場の見通し:買い手は徐々に勢いを取り戻しており、直近の回復は短期的なセンチメントの改善を示唆しています。
出来高の増加を伴って、1時間足のローソク足が$0.075~$0.078を上回って強く引ければ、強気のチャート構造が強まり、$0.080、さらには$0.085を目指す展開につながる可能性があります。
ただし、レジスタンスで反落した場合、$0.070のサポートゾーンを再び試す展開となる可能性があります。
#BTC価格分析# #マクロ分析#
57
翻訳参照
$LINK IS SHOWING STRONG BULLISH MOMENTUM!
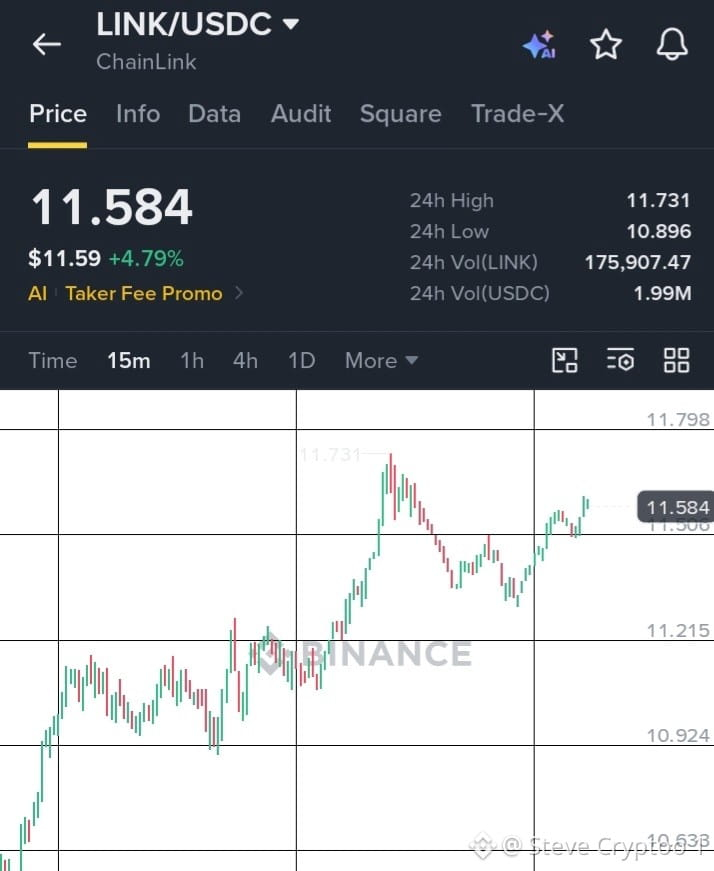
Chainlink is trading around $11.58, up 4.79%, with buyers maintaining control on the 15-minute chart.
The structure is showing higher highs and higher lows, suggesting continued short-term strength.
📊 Key Levels to Watch:
Resistance: $11.70–$11.73
Support: $11.50
Lower Support: $11.35–$11.22
Bullish Scenario: A confirmed breakout above $11.73 with strong volume could open the door toward higher levels.
My Take: $LINK looks constructive, but the next breakout needs volume confirmation. Watch the $11.73 level closely.
#BTC Price Analysis# #Macro Insights# #Altcoin Season# #Meme Alpha# #BNBChain#
$LINK IS SHOWING STRONG BULLISH MOMENTUM!
Chainlink is trading around $11.58, up 4.79%, with buyers maintaining control on the 15-minute chart.
The structure is showing higher highs and higher lows, suggesting continued short-term strength.
📊 Key Levels to Watch:
Resistance: $11.70–$11.73
Support: $11.50
Lower Support: $11.35–$11.22
Bullish Scenario: A confirmed breakout above $11.73 with strong volume could open the door toward higher levels.
My Take: $LINK looks constructive, but the next breakout needs volume confirmation. Watch the $11.73 level closely.
#BTC Price Analysis# #Macro Insights# #Altcoin Season# #Meme Alpha# #BNBChain#
Chainlink is trading around $11.58, up 4.79%, with buyers maintaining control on the 15-minute chart.
The structure is showing higher highs and higher lows, suggesting continued short-term strength.
📊 Key Levels to Watch:
Resistance: $11.70–$11.73
Support: $11.50
Lower Support: $11.35–$11.22
Bullish Scenario: A confirmed breakout above $11.73 with strong volume could open the door toward higher levels.
My Take: $LINK looks constructive, but the next breakout needs volume confirmation. Watch the $11.73 level closely.
#BTC Price Analysis# #Macro Insights# #Altcoin Season# #Meme Alpha# #BNBChain#
82
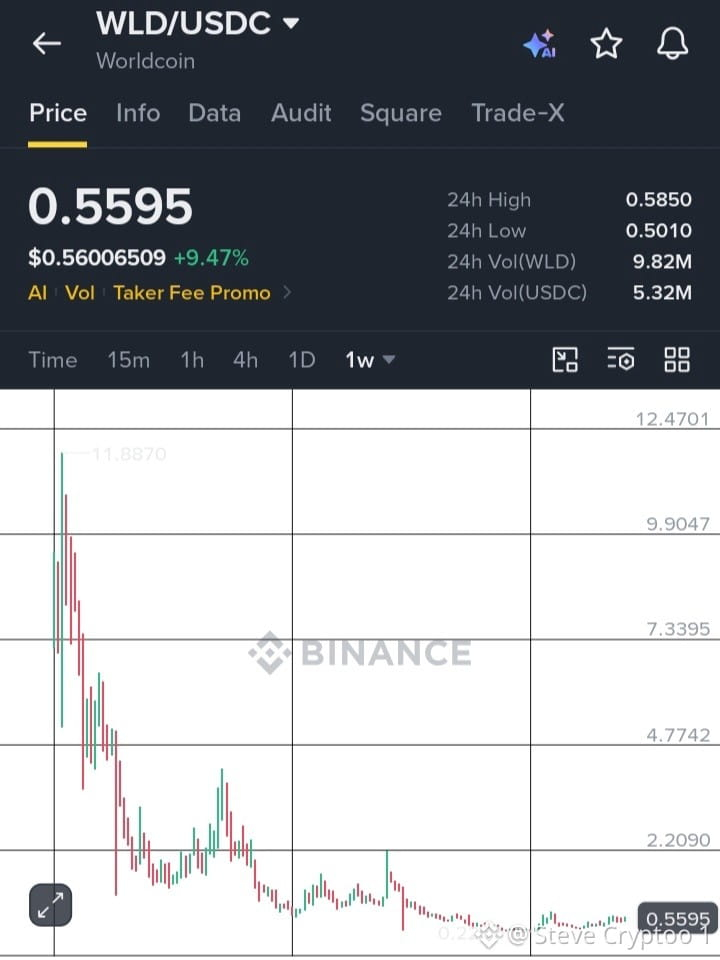
$WLDは現在$0.5595で取引されており、過去24時間で9.47%上昇。長期にわたる弱気圧力の後、短期的な回復の兆しを見せています。
🔹 レジスタンス:$0.5850
🔹 重要なサポート:$0.5010
📈 強気シナリオ:出来高を伴って$0.5850を明確に上抜ければ、回復が続く可能性があります。
📉 弱気シナリオ:$0.5010を下回ると、売り圧力が再び強まる可能性があります。
見通し:モメンタムは改善していますが、大局的なトレンドは依然として弱気です。持続的な反転と判断する前に、ブレイクアウトが確認されるか注視しましょう。
#WLD #Worldcoin #TechnicalAnalysis #CryptoMarkets
$WLDは現在$0.5595で取引されており、過去24時間で9.47%上昇。長期にわたる弱気圧力の後、短期的な回復の兆しを見せています。
🔹 レジスタンス:$0.5850
🔹 重要なサポート:$0.5010
📈 強気シナリオ:出来高を伴って$0.5850を明確に上抜ければ、回復が続く可能性があります。
📉 弱気シナリオ:$0.5010を下回ると、売り圧力が再び強まる可能性があります。
見通し:モメンタムは改善していますが、大局的なトレンドは依然として弱気です。持続的な反転と判断する前に、ブレイクアウトが確認されるか注視しましょう。
#WLD #Worldcoin #TechnicalAnalysis #CryptoMarkets
🔹 レジスタンス:$0.5850
🔹 重要なサポート:$0.5010
📈 強気シナリオ:出来高を伴って$0.5850を明確に上抜ければ、回復が続く可能性があります。
📉 弱気シナリオ:$0.5010を下回ると、売り圧力が再び強まる可能性があります。
見通し:モメンタムは改善していますが、大局的なトレンドは依然として弱気です。持続的な反転と判断する前に、ブレイクアウトが確認されるか注視しましょう。
#WLD #Worldcoin #TechnicalAnalysis #CryptoMarkets
45
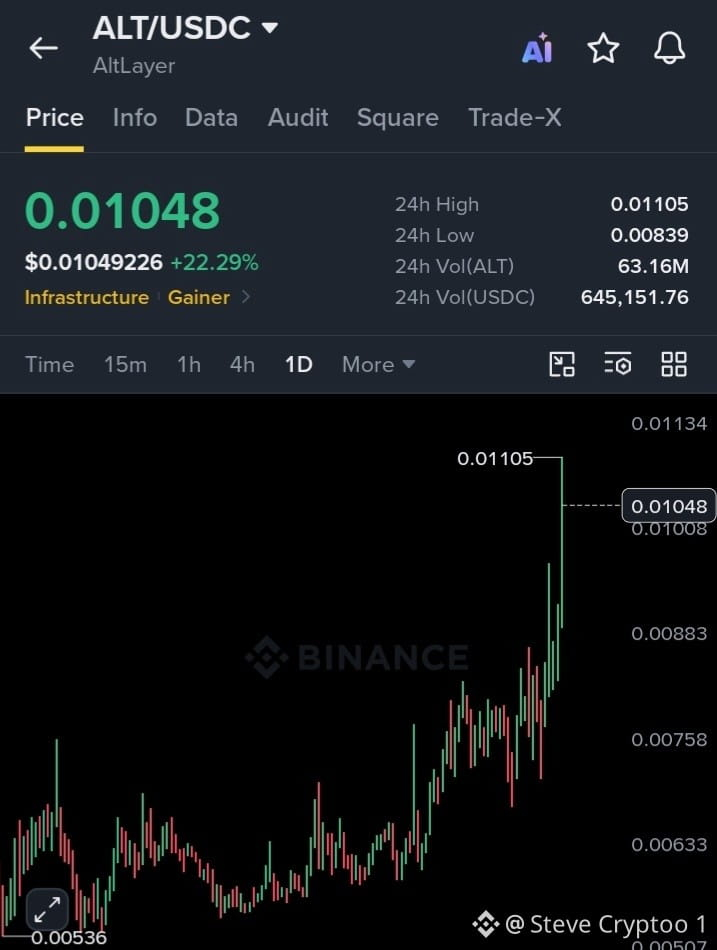
チャートによると、$ALTは力強い値動きを見せており、現在約$0.01048で取引されています。過去24時間で22.29%上昇しました。
主な市場ハイライト:
💚 24時間高値:$0.01105
📊 24時間安値:$0.00839
⚡ 24時間取引高:63.16M ALT
📈 急上昇の後、価格は重要なレジスタンスゾーンに向かっています。
🎯 注目すべき水準:
🔹 レジスタンス:$0.01105~$0.01134
🔹 サポート:$0.01000、次いで$0.00883
🔹 レジスタンスを上回る動きが続けば、さらなる上昇の強さを示す可能性があります。一方、上値を抑えられれば、反落につながる可能性があります。
モメンタムは強気ですが、これほど急速に上昇した後は、ボラティリティや利益確定売りが引き続き重要なリスクとなります。結論を出す前に、動きを確認しましょう。
$ALTは$0.01105を上抜けるでしょうか、それともいったんもみ合いに入るでしょうか? 👀
#BTC価格分析# #マクロ分析#
チャートによると、$ALTは力強い値動きを見せており、現在約$0.01048で取引されています。過去24時間で22.29%上昇しました。
主な市場ハイライト:
💚 24時間高値:$0.01105
📊 24時間安値:$0.00839
⚡ 24時間取引高:63.16M ALT
📈 急上昇の後、価格は重要なレジスタンスゾーンに向かっています。
🎯 注目すべき水準:
🔹 レジスタンス:$0.01105~$0.01134
🔹 サポート:$0.01000、次いで$0.00883
🔹 レジスタンスを上回る動きが続けば、さらなる上昇の強さを示す可能性があります。一方、上値を抑えられれば、反落につながる可能性があります。
モメンタムは強気ですが、これほど急速に上昇した後は、ボラティリティや利益確定売りが引き続き重要なリスクとなります。結論を出す前に、動きを確認しましょう。
$ALTは$0.01105を上抜けるでしょうか、それともいったんもみ合いに入るでしょうか? 👀
#BTC価格分析# #マクロ分析#
主な市場ハイライト:
💚 24時間高値:$0.01105
📊 24時間安値:$0.00839
⚡ 24時間取引高:63.16M ALT
📈 急上昇の後、価格は重要なレジスタンスゾーンに向かっています。
🎯 注目すべき水準:
🔹 レジスタンス:$0.01105~$0.01134
🔹 サポート:$0.01000、次いで$0.00883
🔹 レジスタンスを上回る動きが続けば、さらなる上昇の強さを示す可能性があります。一方、上値を抑えられれば、反落につながる可能性があります。
モメンタムは強気ですが、これほど急速に上昇した後は、ボラティリティや利益確定売りが引き続き重要なリスクとなります。結論を出す前に、動きを確認しましょう。
$ALTは$0.01105を上抜けるでしょうか、それともいったんもみ合いに入るでしょうか? 👀
#BTC価格分析# #マクロ分析#
70
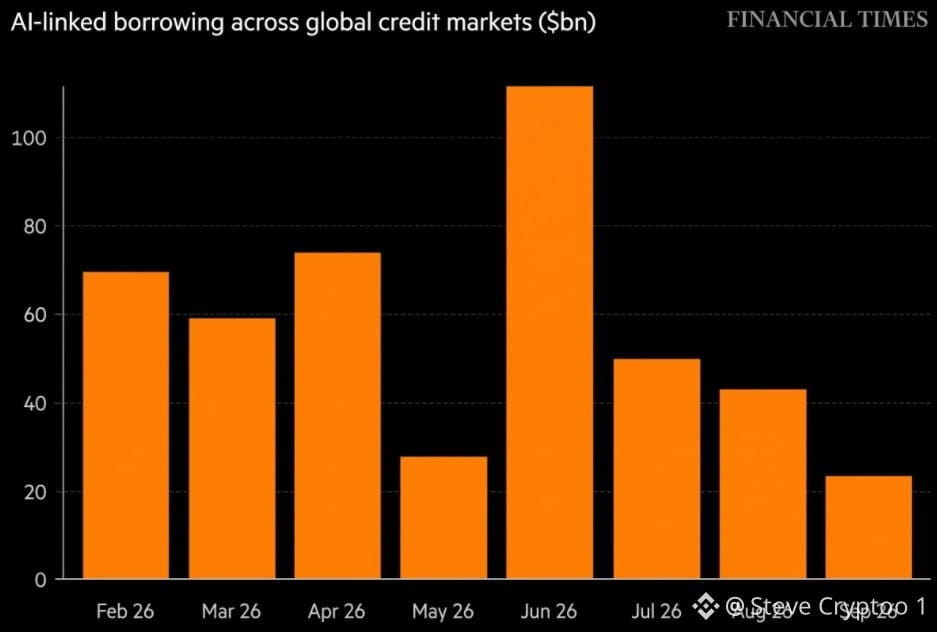
AIの勢いが失われているのではありません——資本コストが上昇しています。
世界のクレジット市場におけるAI関連の借り入れは、興味深い動きを示しています。6月に1,100億ドルを超えてピークに達した後、借り入れ額は急減し、9月には約240億ドルとなりました。
では、AI需要が衰えているということでしょうか?必ずしもそうとは限りません。
🇺🇸 米国の債務増加と長期国債利回りの高止まりは、データセンター、半導体、AIインフラの資金調達コストを押し上げる可能性があります。資本が割高になれば、高成長産業であっても支出や借り入れを減速させることがあります。
重要なのは、資金調達の圧力が必ずしも需要の消失を意味するわけではないという点です。
長期的なAIの成長シナリオには引き続き注目する価値がありますが、実行力、バリュエーション、そして手頃な資本へのアクセスが重要になります。
👀 AIインフラのエコシステムに注目しましょう:
🔹 $SNDK — データストレージ
🔹 $MU — メモリーおよび広帯域メモリー
🔹 $TAO — 分散型AI
🔹 $NEAR — ブロックチェーンインフラとAI関連の開発
📊 本当の問いは、これが一時的な資金調達の減速なのか、それともAI投資全体のより広範な見直しの始まりなのか、ということです。
次の局面では、 hypeよりもファンダメンタルズが評価されるかもしれません。
#BTC価格分析# #マクロの洞察#
AIの勢いが失われているのではありません——資本コストが上昇しています。
世界のクレジット市場におけるAI関連の借り入れは、興味深い動きを示しています。6月に1,100億ドルを超えてピークに達した後、借り入れ額は急減し、9月には約240億ドルとなりました。
では、AI需要が衰えているということでしょうか?必ずしもそうとは限りません。
🇺🇸 米国の債務増加と長期国債利回りの高止まりは、データセンター、半導体、AIインフラの資金調達コストを押し上げる可能性があります。資本が割高になれば、高成長産業であっても支出や借り入れを減速させることがあります。
重要なのは、資金調達の圧力が必ずしも需要の消失を意味するわけではないという点です。
長期的なAIの成長シナリオには引き続き注目する価値がありますが、実行力、バリュエーション、そして手頃な資本へのアクセスが重要になります。
👀 AIインフラのエコシステムに注目しましょう:
🔹 $SNDK — データストレージ
🔹 $MU — メモリーおよび広帯域メモリー
🔹 $TAO — 分散型AI
🔹 $NEAR — ブロックチェーンインフラとAI関連の開発
📊 本当の問いは、これが一時的な資金調達の減速なのか、それともAI投資全体のより広範な見直しの始まりなのか、ということです。
次の局面では、 hypeよりもファンダメンタルズが評価されるかもしれません。
#BTC価格分析# #マクロの洞察#
世界のクレジット市場におけるAI関連の借り入れは、興味深い動きを示しています。6月に1,100億ドルを超えてピークに達した後、借り入れ額は急減し、9月には約240億ドルとなりました。
では、AI需要が衰えているということでしょうか?必ずしもそうとは限りません。
🇺🇸 米国の債務増加と長期国債利回りの高止まりは、データセンター、半導体、AIインフラの資金調達コストを押し上げる可能性があります。資本が割高になれば、高成長産業であっても支出や借り入れを減速させることがあります。
重要なのは、資金調達の圧力が必ずしも需要の消失を意味するわけではないという点です。
長期的なAIの成長シナリオには引き続き注目する価値がありますが、実行力、バリュエーション、そして手頃な資本へのアクセスが重要になります。
👀 AIインフラのエコシステムに注目しましょう:
🔹 $SNDK — データストレージ
🔹 $MU — メモリーおよび広帯域メモリー
🔹 $TAO — 分散型AI
🔹 $NEAR — ブロックチェーンインフラとAI関連の開発
📊 本当の問いは、これが一時的な資金調達の減速なのか、それともAI投資全体のより広範な見直しの始まりなのか、ということです。
次の局面では、 hypeよりもファンダメンタルズが評価されるかもしれません。
#BTC価格分析# #マクロの洞察#
86
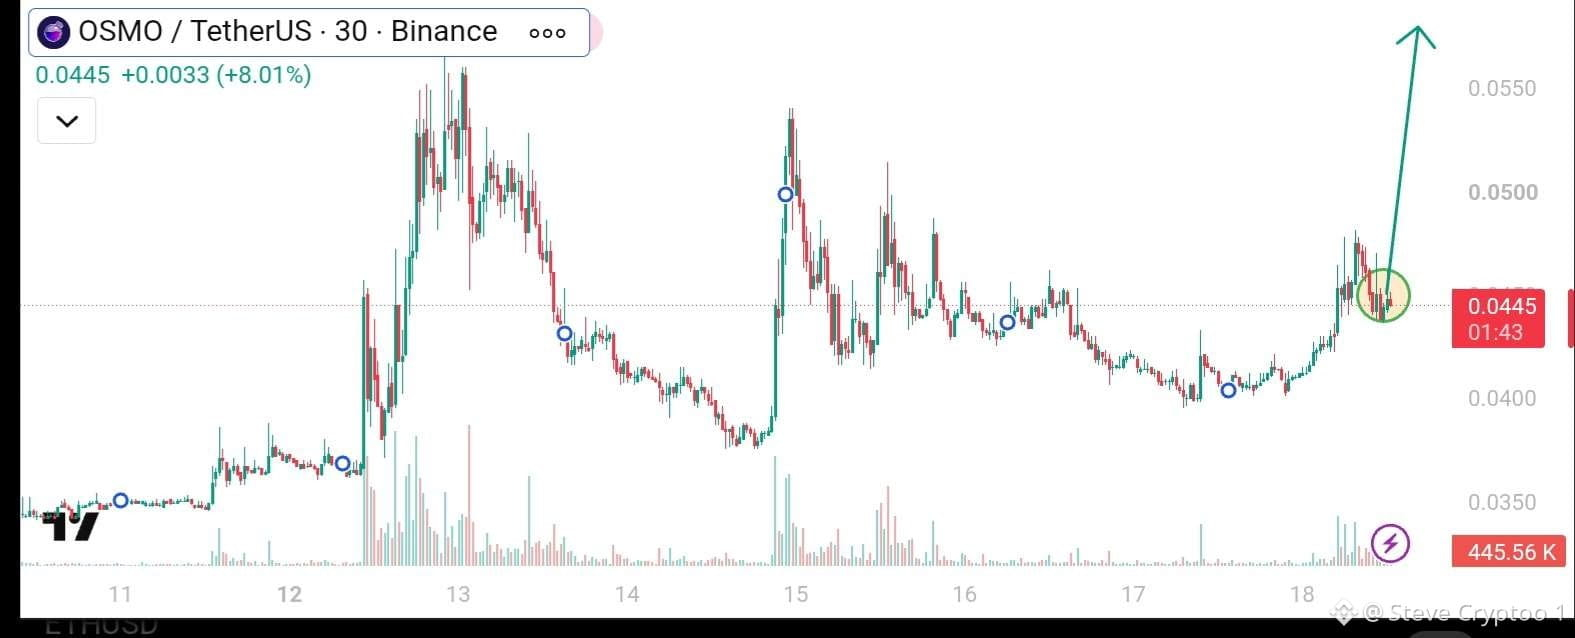
$OSMOは約$0.0445で取引されており、8.01%上昇。長期にわたるもみ合いを経て、買い意欲が再び高まっています。
📊 テクニカル見通し:直近のブレイクアウトを受け、価格は$0.0440~$0.0450のゾーンを試しています。
この水準を維持できれば、$0.0470~$0.0500に向けて再び上昇する可能性があります。$0.0500を力強く上抜ければ、$0.0550が視野に入るかもしれません。
主なリスク:$0.0440を割り込むと、$0.0420~$0.0400まで下落する可能性があります。
私の見解:モメンタムは有望ですが、買い出来高が継続するか確認することが重要です。サポートとレジスタンスの水準を注意深く見守りましょう。
#BTC価格分析# #マクロの洞察#
$OSMOは約$0.0445で取引されており、8.01%上昇。長期にわたるもみ合いを経て、買い意欲が再び高まっています。
📊 テクニカル見通し:直近のブレイクアウトを受け、価格は$0.0440~$0.0450のゾーンを試しています。
この水準を維持できれば、$0.0470~$0.0500に向けて再び上昇する可能性があります。$0.0500を力強く上抜ければ、$0.0550が視野に入るかもしれません。
主なリスク:$0.0440を割り込むと、$0.0420~$0.0400まで下落する可能性があります。
私の見解:モメンタムは有望ですが、買い出来高が継続するか確認することが重要です。サポートとレジスタンスの水準を注意深く見守りましょう。
#BTC価格分析# #マクロの洞察#
📊 テクニカル見通し:直近のブレイクアウトを受け、価格は$0.0440~$0.0450のゾーンを試しています。
この水準を維持できれば、$0.0470~$0.0500に向けて再び上昇する可能性があります。$0.0500を力強く上抜ければ、$0.0550が視野に入るかもしれません。
主なリスク:$0.0440を割り込むと、$0.0420~$0.0400まで下落する可能性があります。
私の見解:モメンタムは有望ですが、買い出来高が継続するか確認することが重要です。サポートとレジスタンスの水準を注意深く見守りましょう。
#BTC価格分析# #マクロの洞察#
75
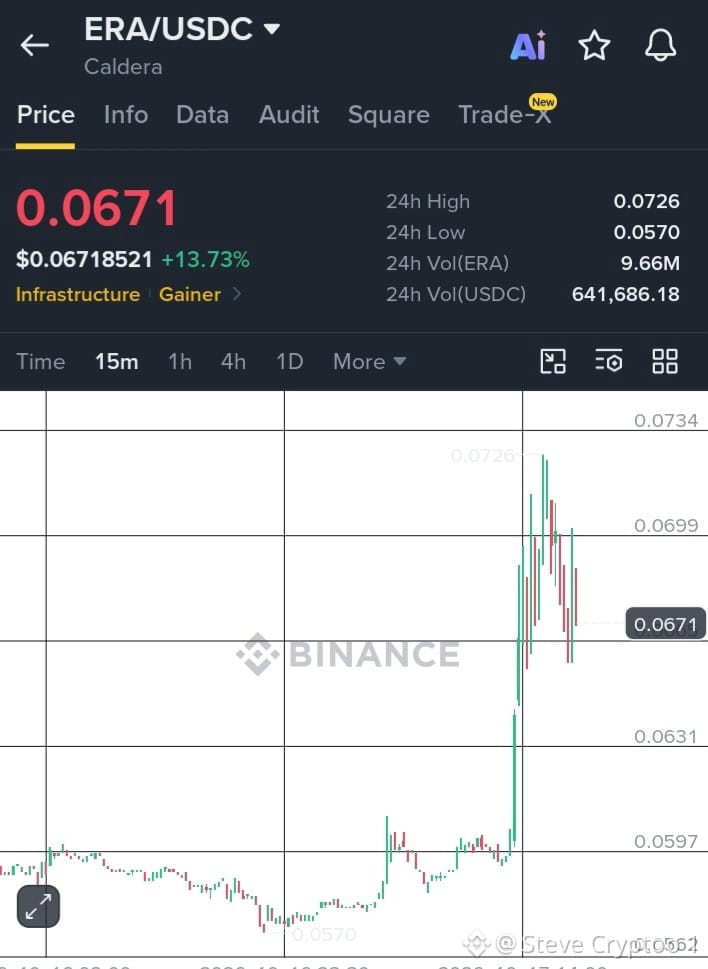
$ERAは力強い強気の勢いを見せており、買い手が価格を$0.0671に向けて押し上げるなか、13.73%上昇しています。
$0.0570~$0.0600付近での値固めを経て、ERAは力強くブレイクアウト。日中高値の$0.0726に達した後、利益確定の売りに押されました。
💰 現在価格: $0.0671
📈 24時間変動率: +13.73%
🔥 24時間高値: $0.0726
📉 24時間安値: $0.0570
💎 取引高: 9.66M ERA
$0.0699を上回る水準でブレイクアウトが続けば、$0.0726を再び試す展開が期待できます。このレジスタンスを突破すれば、上昇継続のシナリオがさらに強まる可能性があります。
一方、$0.0665を下回ると、$0.0631に向けて一段と下落する可能性があります。
強気派はさらなる上昇に向けて準備を進めているのでしょうか。それとも、いったん勢いが落ち着くのでしょうか?
#取引 #BTC価格分析 #マクロ分析#
$ERAは力強い強気の勢いを見せており、買い手が価格を$0.0671に向けて押し上げるなか、13.73%上昇しています。
$0.0570~$0.0600付近での値固めを経て、ERAは力強くブレイクアウト。日中高値の$0.0726に達した後、利益確定の売りに押されました。
💰 現在価格: $0.0671
📈 24時間変動率: +13.73%
🔥 24時間高値: $0.0726
📉 24時間安値: $0.0570
💎 取引高: 9.66M ERA
$0.0699を上回る水準でブレイクアウトが続けば、$0.0726を再び試す展開が期待できます。このレジスタンスを突破すれば、上昇継続のシナリオがさらに強まる可能性があります。
一方、$0.0665を下回ると、$0.0631に向けて一段と下落する可能性があります。
強気派はさらなる上昇に向けて準備を進めているのでしょうか。それとも、いったん勢いが落ち着くのでしょうか?
#取引 #BTC価格分析 #マクロ分析#
$0.0570~$0.0600付近での値固めを経て、ERAは力強くブレイクアウト。日中高値の$0.0726に達した後、利益確定の売りに押されました。
💰 現在価格: $0.0671
📈 24時間変動率: +13.73%
🔥 24時間高値: $0.0726
📉 24時間安値: $0.0570
💎 取引高: 9.66M ERA
$0.0699を上回る水準でブレイクアウトが続けば、$0.0726を再び試す展開が期待できます。このレジスタンスを突破すれば、上昇継続のシナリオがさらに強まる可能性があります。
一方、$0.0665を下回ると、$0.0631に向けて一段と下落する可能性があります。
強気派はさらなる上昇に向けて準備を進めているのでしょうか。それとも、いったん勢いが落ち着くのでしょうか?
#取引 #BTC価格分析 #マクロ分析#
61
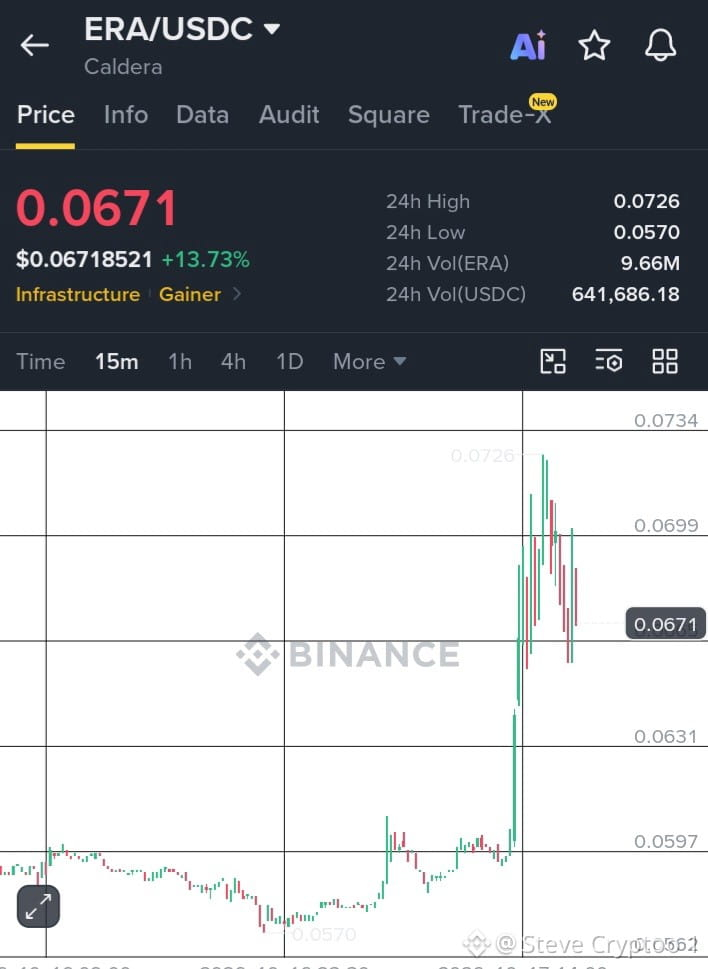
$ERAは力強い強気の勢いを見せており、買い手が価格を$0.0671に向けて押し上げるなか、13.73%上昇しています。
$0.0570~$0.0600付近でのもみ合いの後、ERAは力強くブレイクアウトし、日中高値の$0.0726に到達しましたが、その後は利益確定の売りに押されました。
💰 現在価格:$0.0671
📈 24時間変動率:+13.73%
🔥 24時間高値:$0.0726
📉 24時間安値:$0.0570
💎 取引量:9.66M ERA
$0.0699を上回るブレイクアウトが続けば、$0.0726を再び試す展開が視野に入ります。このレジスタンスを突破できれば、強気相場の継続シナリオが強まる可能性があります。
一方、$0.0665を下回ると、$0.0631に向けてさらに下落する可能性があります。
強気派はもう一段の上昇に向けて準備しているのでしょうか。それとも、いったん落ち着く展開となるのでしょうか?
#取引 #BTC価格分析# #マクロ分析#
$ERAは力強い強気の勢いを見せており、買い手が価格を$0.0671に向けて押し上げるなか、13.73%上昇しています。
$0.0570~$0.0600付近でのもみ合いの後、ERAは力強くブレイクアウトし、日中高値の$0.0726に到達しましたが、その後は利益確定の売りに押されました。
💰 現在価格:$0.0671
📈 24時間変動率:+13.73%
🔥 24時間高値:$0.0726
📉 24時間安値:$0.0570
💎 取引量:9.66M ERA
$0.0699を上回るブレイクアウトが続けば、$0.0726を再び試す展開が視野に入ります。このレジスタンスを突破できれば、強気相場の継続シナリオが強まる可能性があります。
一方、$0.0665を下回ると、$0.0631に向けてさらに下落する可能性があります。
強気派はもう一段の上昇に向けて準備しているのでしょうか。それとも、いったん落ち着く展開となるのでしょうか?
#取引 #BTC価格分析# #マクロ分析#
$0.0570~$0.0600付近でのもみ合いの後、ERAは力強くブレイクアウトし、日中高値の$0.0726に到達しましたが、その後は利益確定の売りに押されました。
💰 現在価格:$0.0671
📈 24時間変動率:+13.73%
🔥 24時間高値:$0.0726
📉 24時間安値:$0.0570
💎 取引量:9.66M ERA
$0.0699を上回るブレイクアウトが続けば、$0.0726を再び試す展開が視野に入ります。このレジスタンスを突破できれば、強気相場の継続シナリオが強まる可能性があります。
一方、$0.0665を下回ると、$0.0631に向けてさらに下落する可能性があります。
強気派はもう一段の上昇に向けて準備しているのでしょうか。それとも、いったん落ち着く展開となるのでしょうか?
#取引 #BTC価格分析# #マクロ分析#
81
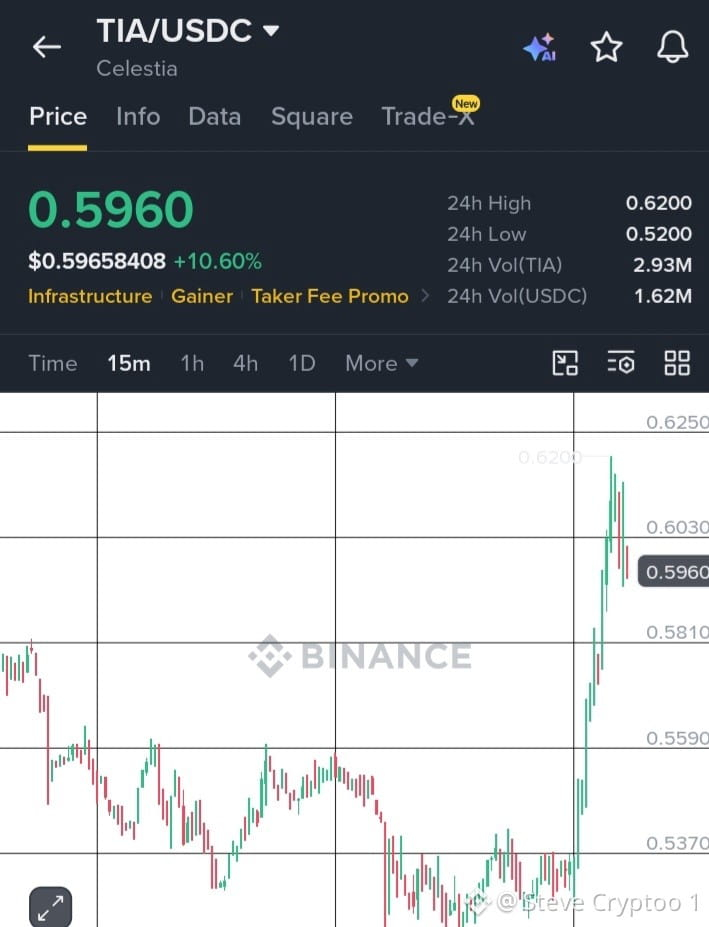
$TIAは15分足チャートで力強いブレイクアウトを見せ、10.60%上昇して$0.5960で取引されています。
📊 注目すべき重要水準:
🟢 レジスタンス:$0.6030 – $0.6200
🔵 サポート:$0.5810 – $0.5590
📈 24時間高値:$0.6200
🔥 24時間安値:$0.520
力強い上昇の後、買い方が主導権を握りましたが、この急騰の後には短期的な持ち合いとなる可能性があります。
$0.6200を上抜ければ、さらなる上昇を示唆する可能性があります。一方、$0.5810を下回ると、勢いが弱まっている兆候かもしれません。
#BTC価格分析# #マクロ分析# #アルトコインシーズン# #ミームコイン情報# #BNBチェーン#
$TIAは15分足チャートで力強いブレイクアウトを見せ、10.60%上昇して$0.5960で取引されています。
📊 注目すべき重要水準:
🟢 レジスタンス:$0.6030 – $0.6200
🔵 サポート:$0.5810 – $0.5590
📈 24時間高値:$0.6200
🔥 24時間安値:$0.520
力強い上昇の後、買い方が主導権を握りましたが、この急騰の後には短期的な持ち合いとなる可能性があります。
$0.6200を上抜ければ、さらなる上昇を示唆する可能性があります。一方、$0.5810を下回ると、勢いが弱まっている兆候かもしれません。
#BTC価格分析# #マクロ分析# #アルトコインシーズン# #ミームコイン情報# #BNBチェーン#
📊 注目すべき重要水準:
🟢 レジスタンス:$0.6030 – $0.6200
🔵 サポート:$0.5810 – $0.5590
📈 24時間高値:$0.6200
🔥 24時間安値:$0.520
力強い上昇の後、買い方が主導権を握りましたが、この急騰の後には短期的な持ち合いとなる可能性があります。
$0.6200を上抜ければ、さらなる上昇を示唆する可能性があります。一方、$0.5810を下回ると、勢いが弱まっている兆候かもしれません。
#BTC価格分析# #マクロ分析# #アルトコインシーズン# #ミームコイン情報# #BNBチェーン#
73
暗号資産市場は次に何を予測している?
Polymarketでは、今後の出来事に関するリアルタイムの確率と群衆のセンチメントを確認できます。
📊 注目の3銘柄
₿ $BTC — 最高値更新なるか?
⚡ $XRP — ブレイクアウト間近?
☀️ $SOL — さらなる上昇はある?
予測は市場のセンチメントを反映したものであり、結果を保証するものではありません。
注目しているのはどれ? BTC、XRP、それともSOL? 👇
@polymarket #Polymarket #マクロインサイト# #マクロインサイト#
暗号資産市場は次に何を予測している?
Polymarketでは、今後の出来事に関するリアルタイムの確率と群衆のセンチメントを確認できます。
📊 注目の3銘柄
₿ $BTC — 最高値更新なるか?
⚡ $XRP — ブレイクアウト間近?
☀️ $SOL — さらなる上昇はある?
予測は市場のセンチメントを反映したものであり、結果を保証するものではありません。
注目しているのはどれ? BTC、XRP、それともSOL? 👇
@polymarket #Polymarket #マクロインサイト# #マクロインサイト#
Polymarketでは、今後の出来事に関するリアルタイムの確率と群衆のセンチメントを確認できます。
📊 注目の3銘柄
₿ $BTC — 最高値更新なるか?
⚡ $XRP — ブレイクアウト間近?
☀️ $SOL — さらなる上昇はある?
予測は市場のセンチメントを反映したものであり、結果を保証するものではありません。
注目しているのはどれ? BTC、XRP、それともSOL? 👇
@polymarket #Polymarket #マクロインサイト# #マクロインサイト#

60
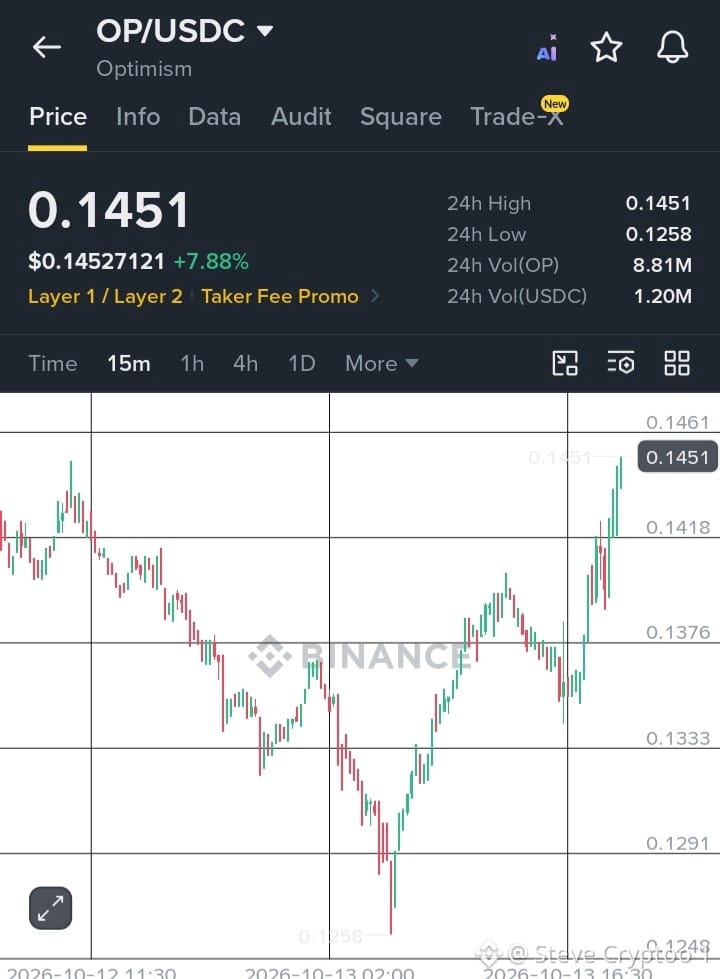
$OPは7.88%上昇し、$0.1451に。15分足チャートで$0.1418を上抜けました。
🎯 レジスタンス:$0.1461
🟢 サポート:$0.1418 / $0.1376
📈 モメンタムが続けば、目標は$0.1500。
$OPはこのブレイクアウトを維持できるでしょうか?それとも売り手が動き出すでしょうか?👀
#BTC価格分析# #マクロインサイト# #アルトコインシーズン# #ミームコイン情報# #BNBチェーン#
$OPは7.88%上昇し、$0.1451に。15分足チャートで$0.1418を上抜けました。
🎯 レジスタンス:$0.1461
🟢 サポート:$0.1418 / $0.1376
📈 モメンタムが続けば、目標は$0.1500。
$OPはこのブレイクアウトを維持できるでしょうか?それとも売り手が動き出すでしょうか?👀
#BTC価格分析# #マクロインサイト# #アルトコインシーズン# #ミームコイン情報# #BNBチェーン#
🎯 レジスタンス:$0.1461
🟢 サポート:$0.1418 / $0.1376
📈 モメンタムが続けば、目標は$0.1500。
$OPはこのブレイクアウトを維持できるでしょうか?それとも売り手が動き出すでしょうか?👀
#BTC価格分析# #マクロインサイト# #アルトコインシーズン# #ミームコイン情報# #BNBチェーン#
76
ログインして、さらにコンテンツを読む
厳選トピックで世界の暗号資産トレーダーの仲間入り
⚡️ 暗号資産に関する最新かつ有益な情報が見つかります。
💬 世界最大の暗号資産取引所から信頼されています。
👍 認証を受けたクリエイターから、有益なインサイトを得られます。
メール / 電話番号