

Kamile Uray 1
61 投稿

Kamile Uray 1
報告
ユーザーをブロック
Economist, Halkbank Financial Analysis Expert, Strategic Planning Manager of the Ministry of Commerce, Trader & Investor & Trainer
0 フォロー
2 フォロワー
4 いいね
投稿
翻訳参照
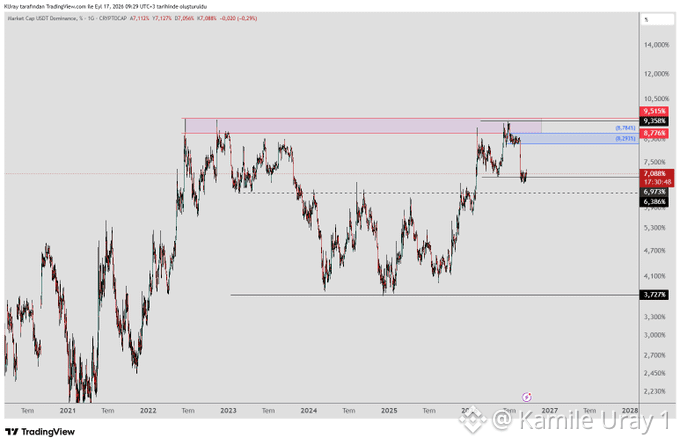
We haven't looked at BTC and USDT dominance for quite some time.
#USDT Dominance has given the first signal that a decline has begun by closing the day below 6.97. Any upward moves from here should be viewed as mere reactions to the downtrend. This bearish outlook would be invalidated if the price closes above 9.36. A drop in USDT dominance indicates that investors are shifting capital into BTC or altcoins.
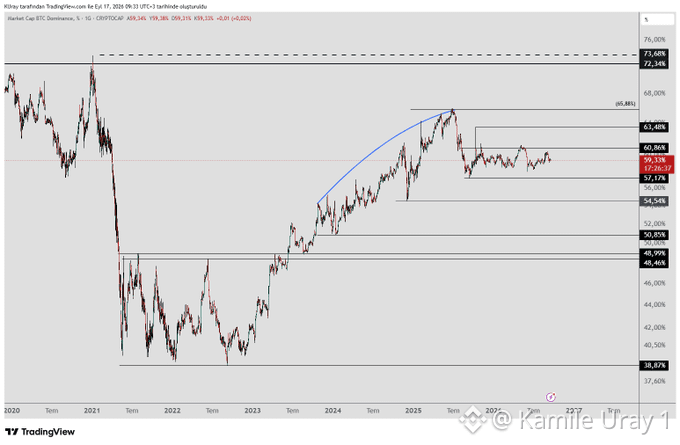
When we look at #BTC Dominance, bearish patterns have emerged; if it remains below 57, the decline is likely to continue.
An analysis of the patterns forming in both dominance metrics suggests that a decline is the most probable outcome. This strengthens the likelihood of a rotation into altcoins.
Of course, I do not expect this to apply to *all* altcoins; I anticipate gains primarily for those with favorable charts, active teams, and solid projects.
We haven't looked at BTC and USDT dominance for quite some time.
#USDT Dominance has given the first signal that a decline has begun by closing the day below 6.97. Any upward moves from here should be viewed as mere reactions to the downtrend. This bearish outlook would be invalidated if the price closes above 9.36. A drop in USDT dominance indicates that investors are shifting capital into BTC or altcoins.
When we look at #BTC Dominance, bearish patterns have emerged; if it remains below 57, the decline is likely to continue.
An analysis of the patterns forming in both dominance metrics suggests that a decline is the most probable outcome. This strengthens the likelihood of a rotation into altcoins.
Of course, I do not expect this to apply to *all* altcoins; I anticipate gains primarily for those with favorable charts, active teams, and solid projects.
#USDT Dominance has given the first signal that a decline has begun by closing the day below 6.97. Any upward moves from here should be viewed as mere reactions to the downtrend. This bearish outlook would be invalidated if the price closes above 9.36. A drop in USDT dominance indicates that investors are shifting capital into BTC or altcoins.
When we look at #BTC Dominance, bearish patterns have emerged; if it remains below 57, the decline is likely to continue.
An analysis of the patterns forming in both dominance metrics suggests that a decline is the most probable outcome. This strengthens the likelihood of a rotation into altcoins.
Of course, I do not expect this to apply to *all* altcoins; I anticipate gains primarily for those with favorable charts, active teams, and solid projects.
54
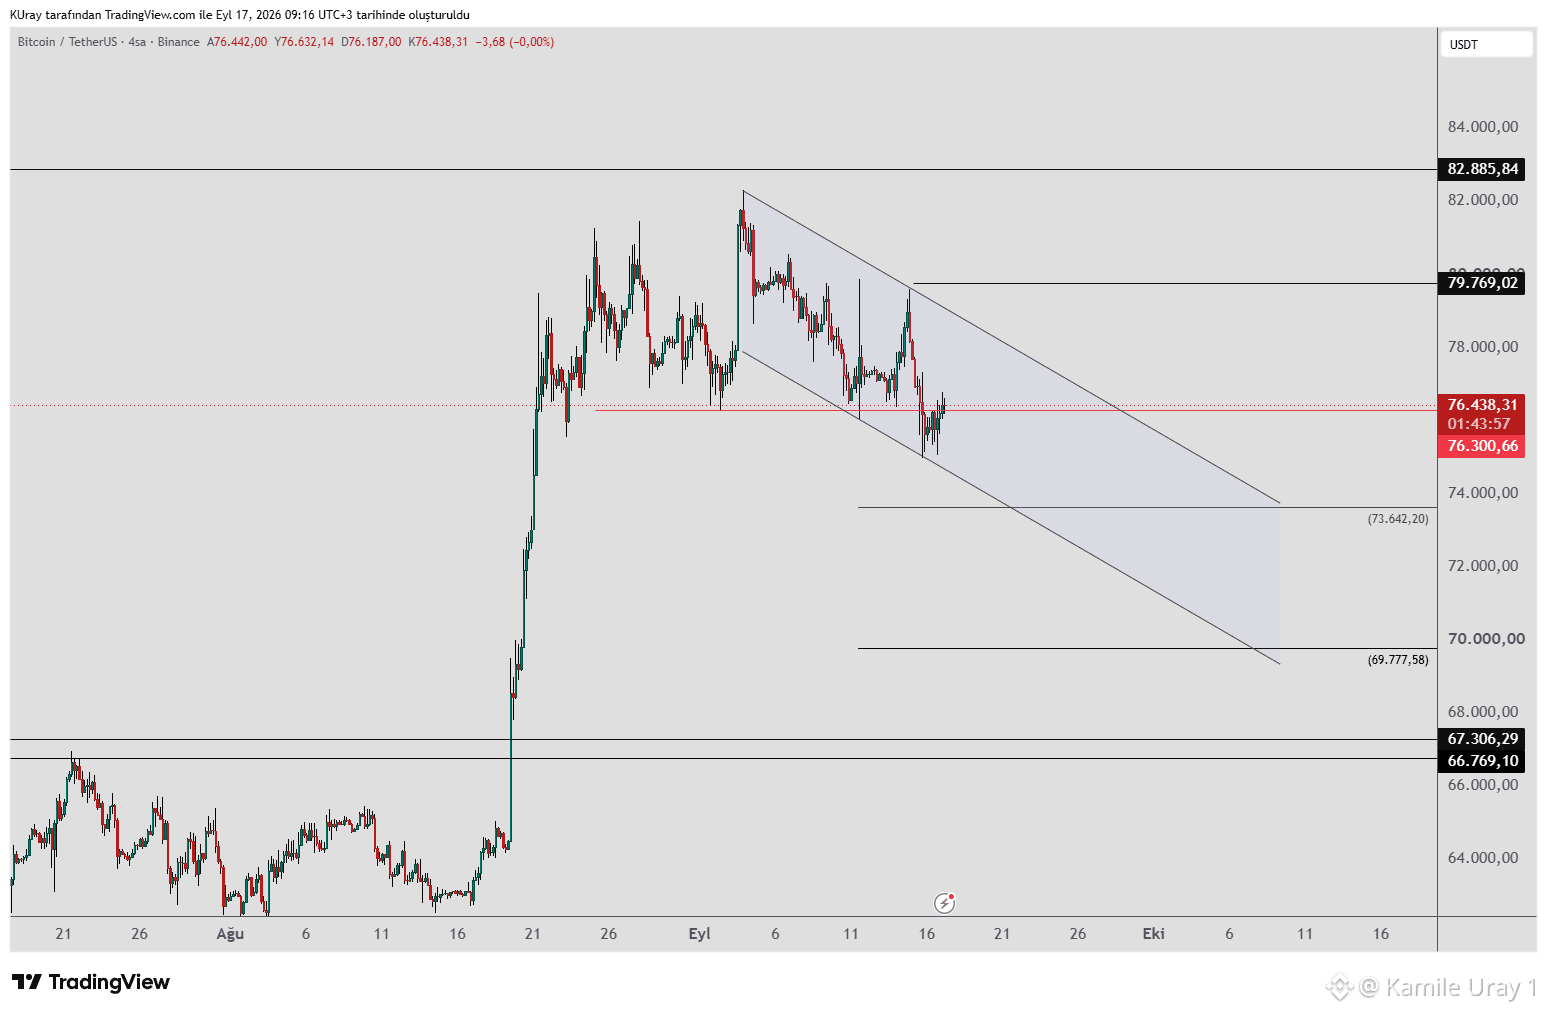
#BTC 下落の波はチャネル内で動いています。このチャネルの上限はレジスタンスとして機能する可能性があり、下限はサポートとして機能します。上限が維持されている限り(ブレイクには日足の終値で約79,800付近が必要)、下落が継続する可能性があります。
下落局面では、サポート水準として73,642、69,777、67,306、66,769を監視します。これらの水準のいずれかで買い圧力が現れれば、再度の上昇が見込まれます。下落は、逆ヘッドアンドショルダー(IH&S)パターンの最終的な「右肩」を形成する可能性があります。価格が83,000を上回って推移すれば、パターンが発動し、上方のレジスタンス水準に向けた上昇が続くことが予想されます。
日足または週足の終値で82,885を上回ることがあれば、直近の下落の波に対する初めての「より高い高値」になります。これは上昇トレンドが続く可能性を示す追加のシグナルとなり、その後は上方のレジスタンス水準を監視できます。
#BTC 下落の波はチャネル内で動いています。このチャネルの上限はレジスタンスとして機能する可能性があり、下限はサポートとして機能します。上限が維持されている限り(ブレイクには日足の終値で約79,800付近が必要)、下落が継続する可能性があります。
下落局面では、サポート水準として73,642、69,777、67,306、66,769を監視します。これらの水準のいずれかで買い圧力が現れれば、再度の上昇が見込まれます。下落は、逆ヘッドアンドショルダー(IH&S)パターンの最終的な「右肩」を形成する可能性があります。価格が83,000を上回って推移すれば、パターンが発動し、上方のレジスタンス水準に向けた上昇が続くことが予想されます。
日足または週足の終値で82,885を上回ることがあれば、直近の下落の波に対する初めての「より高い高値」になります。これは上昇トレンドが続く可能性を示す追加のシグナルとなり、その後は上方のレジスタンス水準を監視できます。
下落局面では、サポート水準として73,642、69,777、67,306、66,769を監視します。これらの水準のいずれかで買い圧力が現れれば、再度の上昇が見込まれます。下落は、逆ヘッドアンドショルダー(IH&S)パターンの最終的な「右肩」を形成する可能性があります。価格が83,000を上回って推移すれば、パターンが発動し、上方のレジスタンス水準に向けた上昇が続くことが予想されます。
日足または週足の終値で82,885を上回ることがあれば、直近の下落の波に対する初めての「より高い高値」になります。これは上昇トレンドが続く可能性を示す追加のシグナルとなり、その後は上方のレジスタンス水準を監視できます。
55
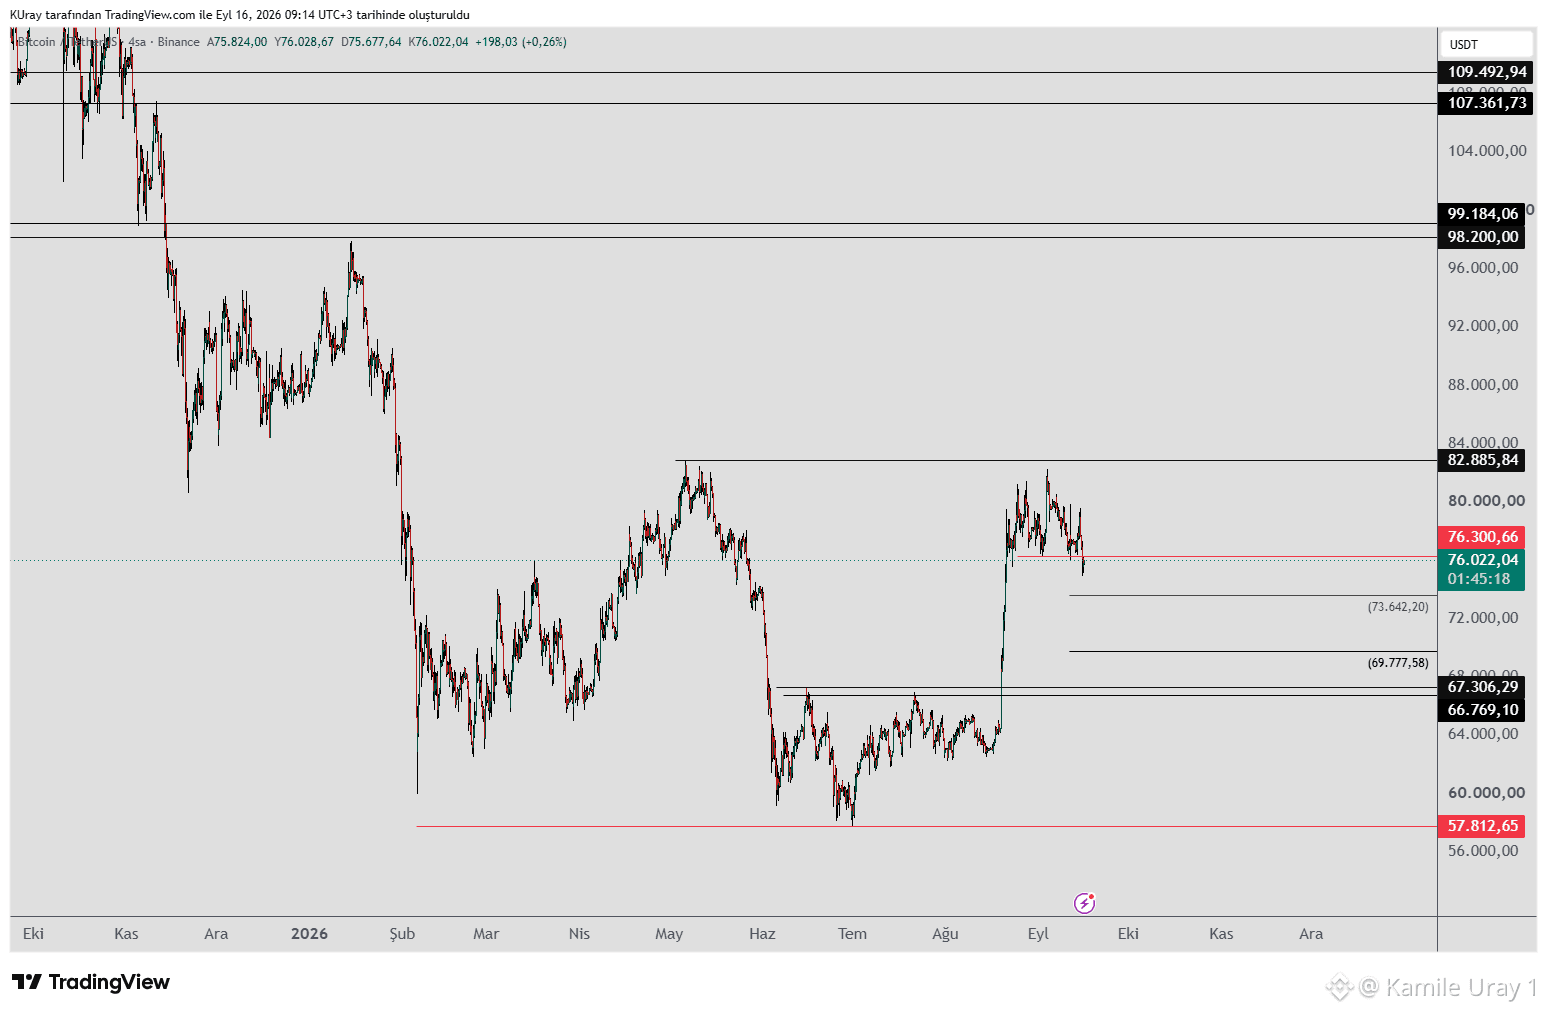
#BTC は、FRB の利下げ(利上げ)決定に関する発表前に 76,300 の水準を下回ってクローズした。これにより、下落が継続する可能性が高まっている。
下落局面では、サポート水準として 73,642、69,777、67,306、66,769 を監視する。
これらの水準のいずれかで買いの動きが出現すれば、再度の上昇が見込まれる。
下落は、反転型ヘッド・アンド・ショルダー(H&S)パターンの最終的な右肩を形成する可能性がある。価格が 83,000 を上回って推移すれば、そのパターンが発動し、上部のレジスタンス水準に向けた上昇の継続が予想される。
もし日足または週足で 82,885 を上回る終値が付けば、直近の下落ウェーブに対する最初の高値更新となる。これは、上昇トレンドが継続しやすいという追加シグナルとなり、その後は上部のレジスタンス水準を監視できる。
#BTC は、FRB の利下げ(利上げ)決定に関する発表前に 76,300 の水準を下回ってクローズした。これにより、下落が継続する可能性が高まっている。
下落局面では、サポート水準として 73,642、69,777、67,306、66,769 を監視する。
これらの水準のいずれかで買いの動きが出現すれば、再度の上昇が見込まれる。
下落は、反転型ヘッド・アンド・ショルダー(H&S)パターンの最終的な右肩を形成する可能性がある。価格が 83,000 を上回って推移すれば、そのパターンが発動し、上部のレジスタンス水準に向けた上昇の継続が予想される。
もし日足または週足で 82,885 を上回る終値が付けば、直近の下落ウェーブに対する最初の高値更新となる。これは、上昇トレンドが継続しやすいという追加シグナルとなり、その後は上部のレジスタンス水準を監視できる。
下落局面では、サポート水準として 73,642、69,777、67,306、66,769 を監視する。
これらの水準のいずれかで買いの動きが出現すれば、再度の上昇が見込まれる。
下落は、反転型ヘッド・アンド・ショルダー(H&S)パターンの最終的な右肩を形成する可能性がある。価格が 83,000 を上回って推移すれば、そのパターンが発動し、上部のレジスタンス水準に向けた上昇の継続が予想される。
もし日足または週足で 82,885 を上回る終値が付けば、直近の下落ウェーブに対する最初の高値更新となる。これは、上昇トレンドが継続しやすいという追加シグナルとなり、その後は上部のレジスタンス水準を監視できる。
63
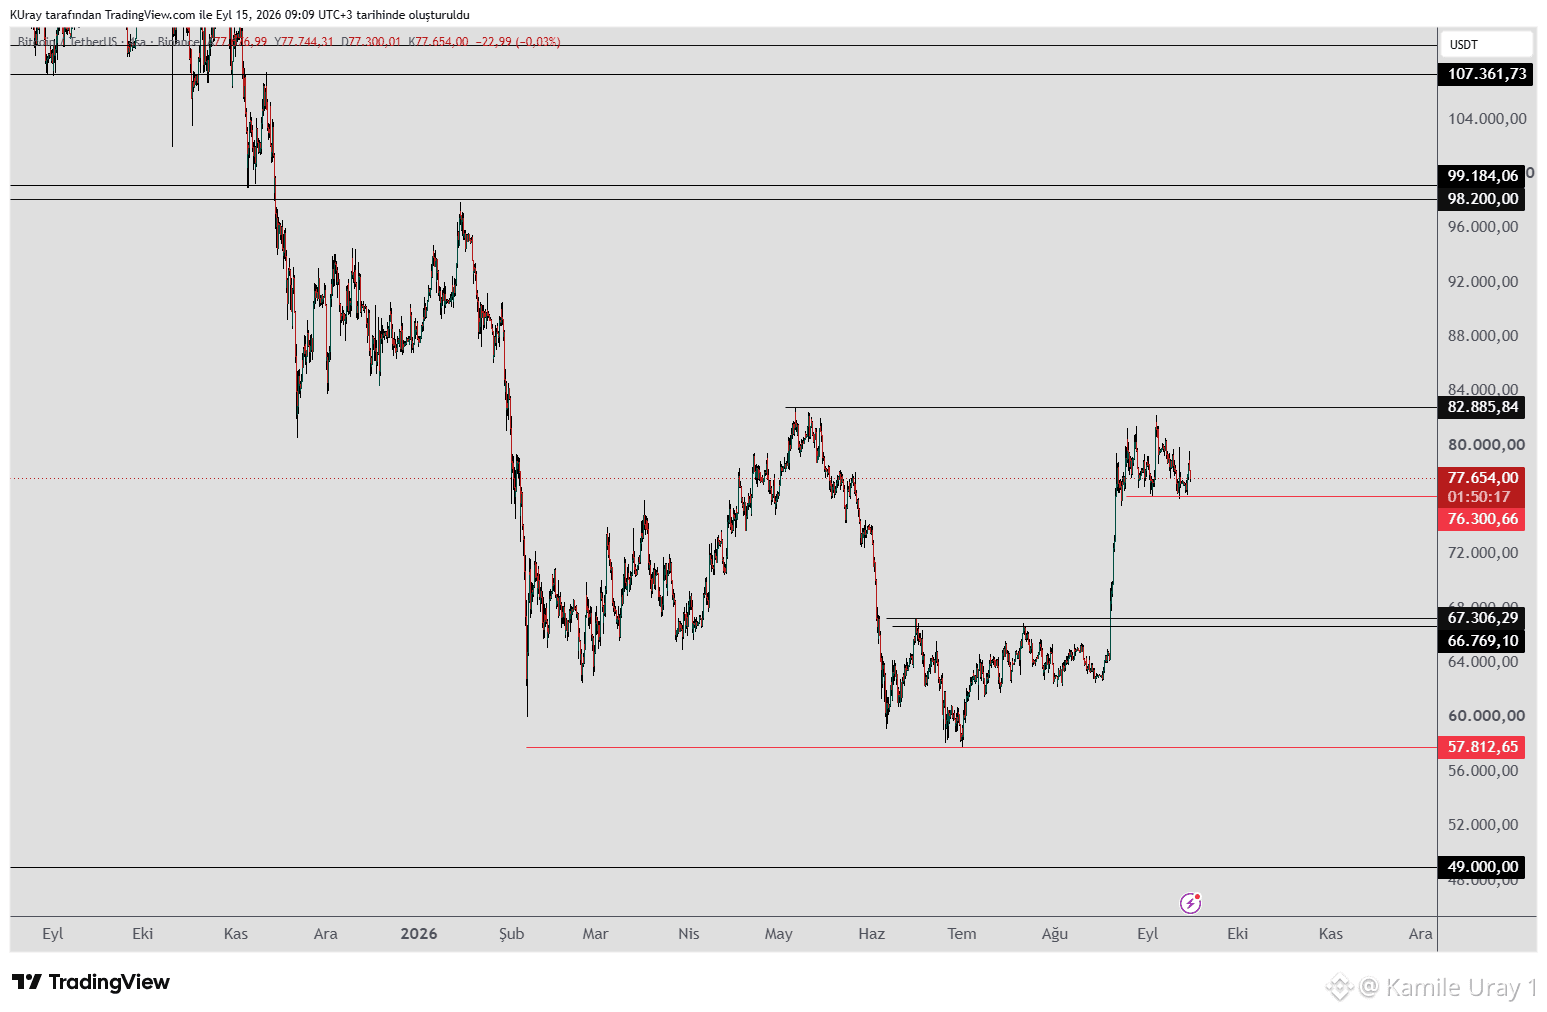
#BTC は、16日のFRB金利決定まで同じレンジ内で取引される見通しです。
決定当日は、どちらの方向にしても急激な価格変動が起こりやすいと考えられます。76,300の水準を注視しています。ボラティリティに関わらず、4時間足の終値が私たちの重要な指標です。
4時間足チャートで価格が76,300を上回って推移している限り、上方向への動きの可能性は維持されています。
もし価格が76,300を下回って終値をつける場合、67,000〜66,000付近のサポートゾーンを試しにいく可能性があります。この下落は、想定される逆ヘッド・アンド・ショルダー(H&S)パターンの最終的な「肩」を形成するかもしれません。その後、価格が83,000を上回って推移すれば、パターンは発動し、上側のレジスタンス水準に向けた上昇が継続することが見込まれます。
さらに、82,885を日足または週足で上回って終値をつけるなら、直近の下落局面に対して初めての高値更新となります。これにより、上昇トレンドが継続する可能性がより裏付けられ、その後は上側のレジスタンス水準を監視していきます。
#BTC は、16日のFRB金利決定まで同じレンジ内で取引される見通しです。
決定当日は、どちらの方向にしても急激な価格変動が起こりやすいと考えられます。76,300の水準を注視しています。ボラティリティに関わらず、4時間足の終値が私たちの重要な指標です。
4時間足チャートで価格が76,300を上回って推移している限り、上方向への動きの可能性は維持されています。
もし価格が76,300を下回って終値をつける場合、67,000〜66,000付近のサポートゾーンを試しにいく可能性があります。この下落は、想定される逆ヘッド・アンド・ショルダー(H&S)パターンの最終的な「肩」を形成するかもしれません。その後、価格が83,000を上回って推移すれば、パターンは発動し、上側のレジスタンス水準に向けた上昇が継続することが見込まれます。
さらに、82,885を日足または週足で上回って終値をつけるなら、直近の下落局面に対して初めての高値更新となります。これにより、上昇トレンドが継続する可能性がより裏付けられ、その後は上側のレジスタンス水準を監視していきます。
決定当日は、どちらの方向にしても急激な価格変動が起こりやすいと考えられます。76,300の水準を注視しています。ボラティリティに関わらず、4時間足の終値が私たちの重要な指標です。
4時間足チャートで価格が76,300を上回って推移している限り、上方向への動きの可能性は維持されています。
もし価格が76,300を下回って終値をつける場合、67,000〜66,000付近のサポートゾーンを試しにいく可能性があります。この下落は、想定される逆ヘッド・アンド・ショルダー(H&S)パターンの最終的な「肩」を形成するかもしれません。その後、価格が83,000を上回って推移すれば、パターンは発動し、上側のレジスタンス水準に向けた上昇が継続することが見込まれます。
さらに、82,885を日足または週足で上回って終値をつけるなら、直近の下落局面に対して初めての高値更新となります。これにより、上昇トレンドが継続する可能性がより裏付けられ、その後は上側のレジスタンス水準を監視していきます。
61
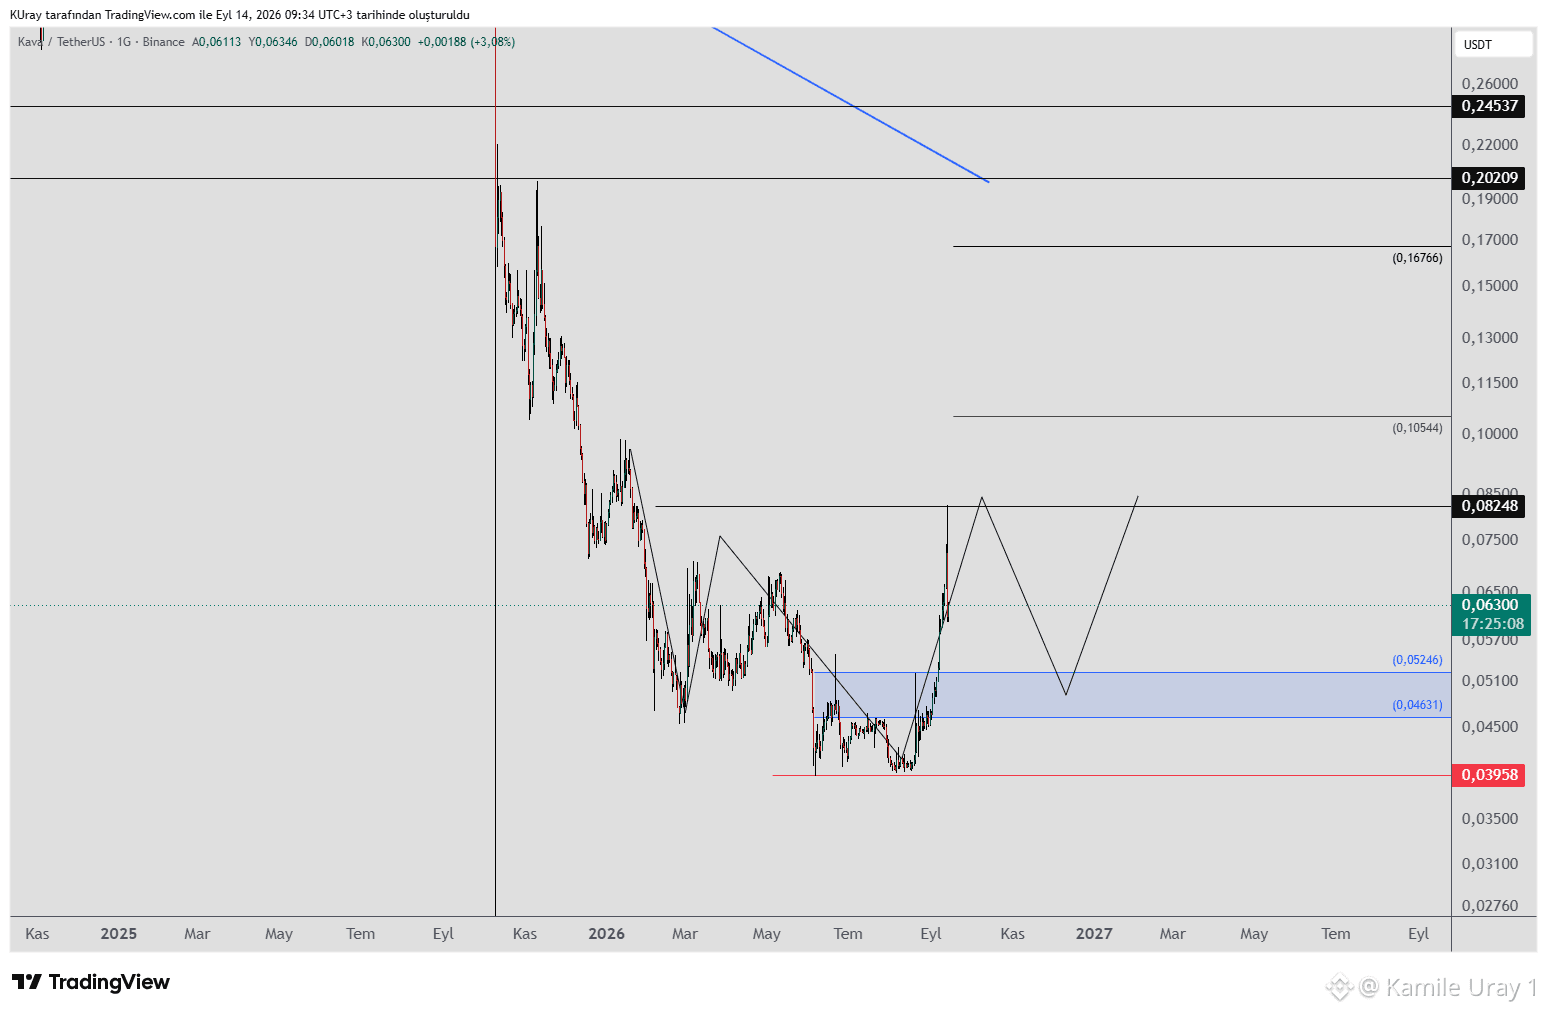
私は「てんびん座」の可能性があるパターンを見つけました。🙂
ぜひ共有します。
#KAVA:価格が下落した場合、「てんびん座」のパターンが形成される可能性があります。
エントリーゾーン:0.05246–0.04631
ストップ:0.03958
目標:0.08248–0.10544–0.16766
自分のリスク許容度に基づいて戦略を判断してください。トレードを追いながらストップロスの使用をおすすめします。
私は「てんびん座」の可能性があるパターンを見つけました。🙂
ぜひ共有します。
#KAVA:価格が下落した場合、「てんびん座」のパターンが形成される可能性があります。
エントリーゾーン:0.05246–0.04631
ストップ:0.03958
目標:0.08248–0.10544–0.16766
自分のリスク許容度に基づいて戦略を判断してください。トレードを追いながらストップロスの使用をおすすめします。
ぜひ共有します。
#KAVA:価格が下落した場合、「てんびん座」のパターンが形成される可能性があります。
エントリーゾーン:0.05246–0.04631
ストップ:0.03958
目標:0.08248–0.10544–0.16766
自分のリスク許容度に基づいて戦略を判断してください。トレードを追いながらストップロスの使用をおすすめします。
52
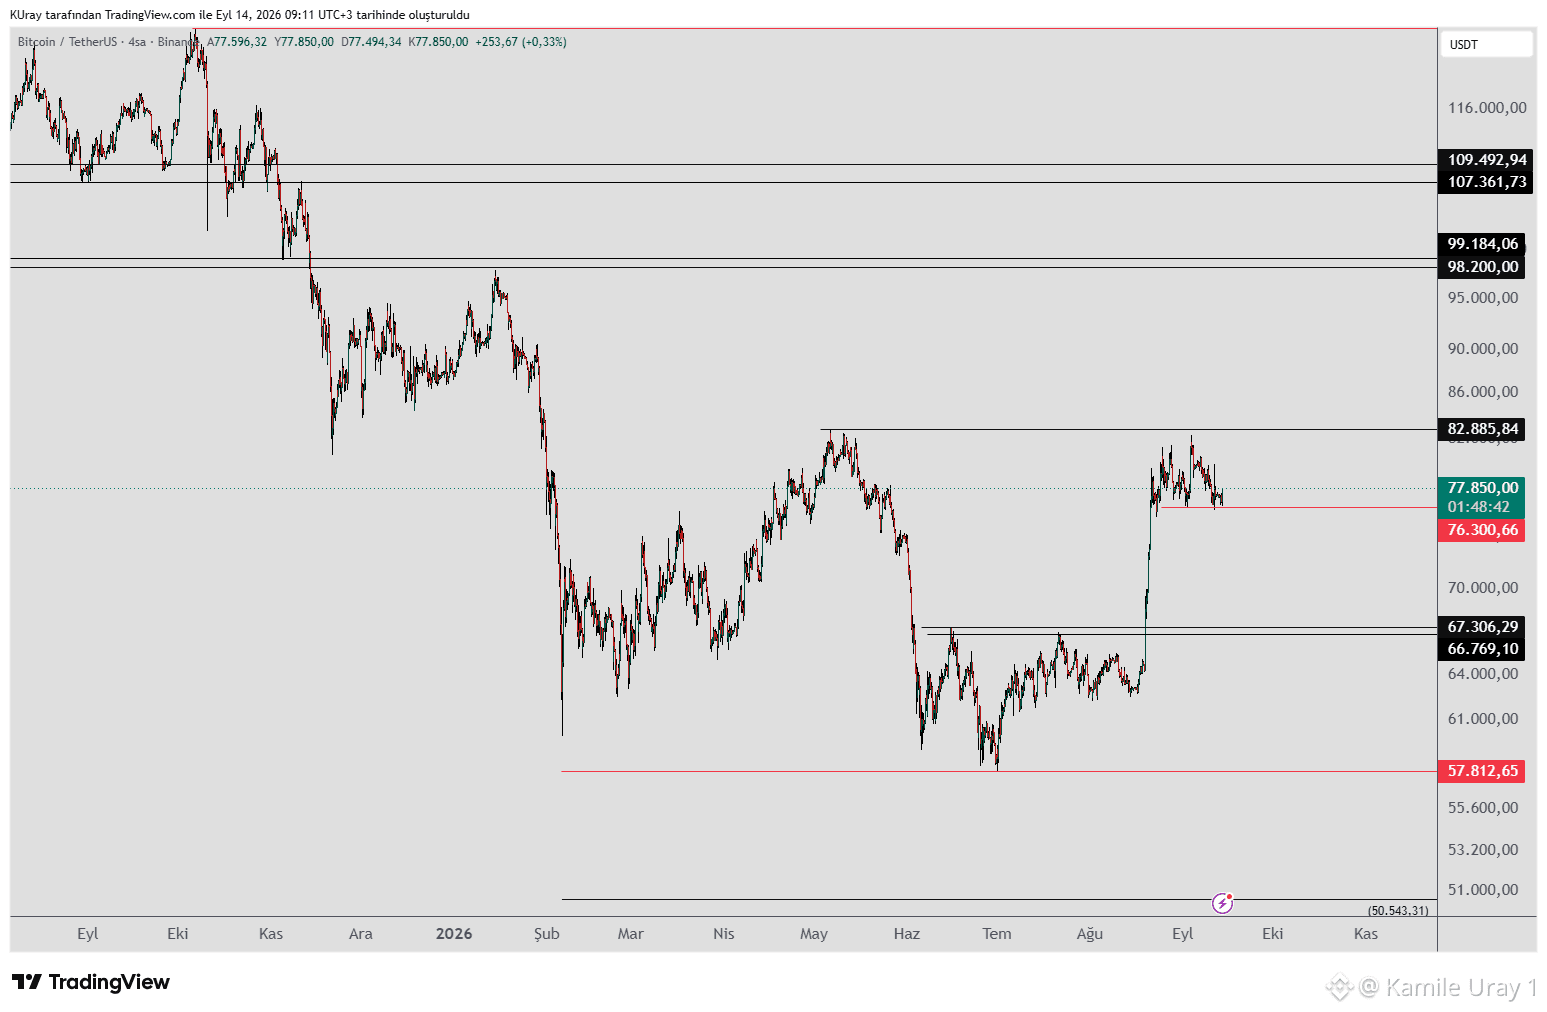
現在、#BTC の水準76,300を監視しています。この水準を上回って推移している限り、上方向への動きの可能性は残ります。
価格が76,300を下回る形で終値となった場合、67,000〜66,000付近のサポート・ゾーンをテストする可能性があります。下落が進むと、想定されるインバース・ヘッド&ショルダー(H&S)パターンの最終的な「肩」が形成される可能性があります。価格が83,000を上回って推移すれば、パターンが作動し、上方のレジスタンス・レベルに向けたさらなる上昇が見込まれます。
日足または週足の終値で82,885を上回ることがあれば、直近の下落ウェーブに対して初めての高値更新となります。これにより、上昇トレンドが継続する可能性が高いという追加のシグナルとなり、その後は上方のレジスタンス・レベルを監視できます。
現在、#BTC の水準76,300を監視しています。この水準を上回って推移している限り、上方向への動きの可能性は残ります。
価格が76,300を下回る形で終値となった場合、67,000〜66,000付近のサポート・ゾーンをテストする可能性があります。下落が進むと、想定されるインバース・ヘッド&ショルダー(H&S)パターンの最終的な「肩」が形成される可能性があります。価格が83,000を上回って推移すれば、パターンが作動し、上方のレジスタンス・レベルに向けたさらなる上昇が見込まれます。
日足または週足の終値で82,885を上回ることがあれば、直近の下落ウェーブに対して初めての高値更新となります。これにより、上昇トレンドが継続する可能性が高いという追加のシグナルとなり、その後は上方のレジスタンス・レベルを監視できます。
価格が76,300を下回る形で終値となった場合、67,000〜66,000付近のサポート・ゾーンをテストする可能性があります。下落が進むと、想定されるインバース・ヘッド&ショルダー(H&S)パターンの最終的な「肩」が形成される可能性があります。価格が83,000を上回って推移すれば、パターンが作動し、上方のレジスタンス・レベルに向けたさらなる上昇が見込まれます。
日足または週足の終値で82,885を上回ることがあれば、直近の下落ウェーブに対して初めての高値更新となります。これにより、上昇トレンドが継続する可能性が高いという追加のシグナルとなり、その後は上方のレジスタンス・レベルを監視できます。
70
#BTC 米国のPPIが上昇し、今日CPIデータが発表されます。市場にとって、また別の値動きの激しい一日になりそうです。特に短期取引では慎重に対応します。
データが出た後は、市場が落ち着き、動きが再開するでしょう。
私たちはBTCの「76,300」水準を監視しています。この水準を上回って維持される限り、上昇の可能性は残ります。
もし日足または週足の終値が「82,885」を上回るなら、直近の下落局面に対する最初のより高い高値を示すことになります。これはラリー(上昇)が継続する可能性が高いことを示す追加のサインとなり、その後はより高いレジスタンス水準を監視できます。
価格が「76,300」を下回って終値を付ける場合、「66,000〜67,000」付近のサポートゾーンを試しに行く可能性があります。この下落は、想定される逆ヘッド・アンド・ショルダー(H&S)パターンの最終的な肩を形成し得ます。価格が「83,000」を上回って推移すれば、そのパターンは発動し、より高いレジスタンス水準に向けた上昇の継続が見込まれます。
#BTC 米国のPPIが上昇し、今日CPIデータが発表されます。市場にとって、また別の値動きの激しい一日になりそうです。特に短期取引では慎重に対応します。
データが出た後は、市場が落ち着き、動きが再開するでしょう。
私たちはBTCの「76,300」水準を監視しています。この水準を上回って維持される限り、上昇の可能性は残ります。
もし日足または週足の終値が「82,885」を上回るなら、直近の下落局面に対する最初のより高い高値を示すことになります。これはラリー(上昇)が継続する可能性が高いことを示す追加のサインとなり、その後はより高いレジスタンス水準を監視できます。
価格が「76,300」を下回って終値を付ける場合、「66,000〜67,000」付近のサポートゾーンを試しに行く可能性があります。この下落は、想定される逆ヘッド・アンド・ショルダー(H&S)パターンの最終的な肩を形成し得ます。価格が「83,000」を上回って推移すれば、そのパターンは発動し、より高いレジスタンス水準に向けた上昇の継続が見込まれます。
データが出た後は、市場が落ち着き、動きが再開するでしょう。
私たちはBTCの「76,300」水準を監視しています。この水準を上回って維持される限り、上昇の可能性は残ります。
もし日足または週足の終値が「82,885」を上回るなら、直近の下落局面に対する最初のより高い高値を示すことになります。これはラリー(上昇)が継続する可能性が高いことを示す追加のサインとなり、その後はより高いレジスタンス水準を監視できます。
価格が「76,300」を下回って終値を付ける場合、「66,000〜67,000」付近のサポートゾーンを試しに行く可能性があります。この下落は、想定される逆ヘッド・アンド・ショルダー(H&S)パターンの最終的な肩を形成し得ます。価格が「83,000」を上回って推移すれば、そのパターンは発動し、より高いレジスタンス水準に向けた上昇の継続が見込まれます。

55
翻訳参照
#BTC US producer inflation data is due today; markets tend to tread cautiously on data release days and experience sharp volatility once the figures are announced.
Therefore, short-term traders, in particular, should exercise caution.
As for BTC, the levels we are monitoring are clear: the potential for an upward move remains as long as the price stays above 76,300.
If a daily or weekly close occurs above 82,885, it would mark the first higher high relative to the most recent downward wave. This would provide a further signal that the uptrend is likely to continue, allowing us to monitor higher resistance levels thereafter.
If the price closes below 76,300, there is a possibility of testing the support zone around 67,000–66,000. Such a decline could form the final shoulder of a potential inverse head-and-shoulders (H&S) pattern. If the price subsequently holds above 83,000, the pattern would be activated, and a continued rise toward higher resistance levels would be expected.
#BTC US producer inflation data is due today; markets tend to tread cautiously on data release days and experience sharp volatility once the figures are announced.
Therefore, short-term traders, in particular, should exercise caution.
As for BTC, the levels we are monitoring are clear: the potential for an upward move remains as long as the price stays above 76,300.
If a daily or weekly close occurs above 82,885, it would mark the first higher high relative to the most recent downward wave. This would provide a further signal that the uptrend is likely to continue, allowing us to monitor higher resistance levels thereafter.
If the price closes below 76,300, there is a possibility of testing the support zone around 67,000–66,000. Such a decline could form the final shoulder of a potential inverse head-and-shoulders (H&S) pattern. If the price subsequently holds above 83,000, the pattern would be activated, and a continued rise toward higher resistance levels would be expected.
Therefore, short-term traders, in particular, should exercise caution.
As for BTC, the levels we are monitoring are clear: the potential for an upward move remains as long as the price stays above 76,300.
If a daily or weekly close occurs above 82,885, it would mark the first higher high relative to the most recent downward wave. This would provide a further signal that the uptrend is likely to continue, allowing us to monitor higher resistance levels thereafter.
If the price closes below 76,300, there is a possibility of testing the support zone around 67,000–66,000. Such a decline could form the final shoulder of a potential inverse head-and-shoulders (H&S) pattern. If the price subsequently holds above 83,000, the pattern would be activated, and a continued rise toward higher resistance levels would be expected.
65
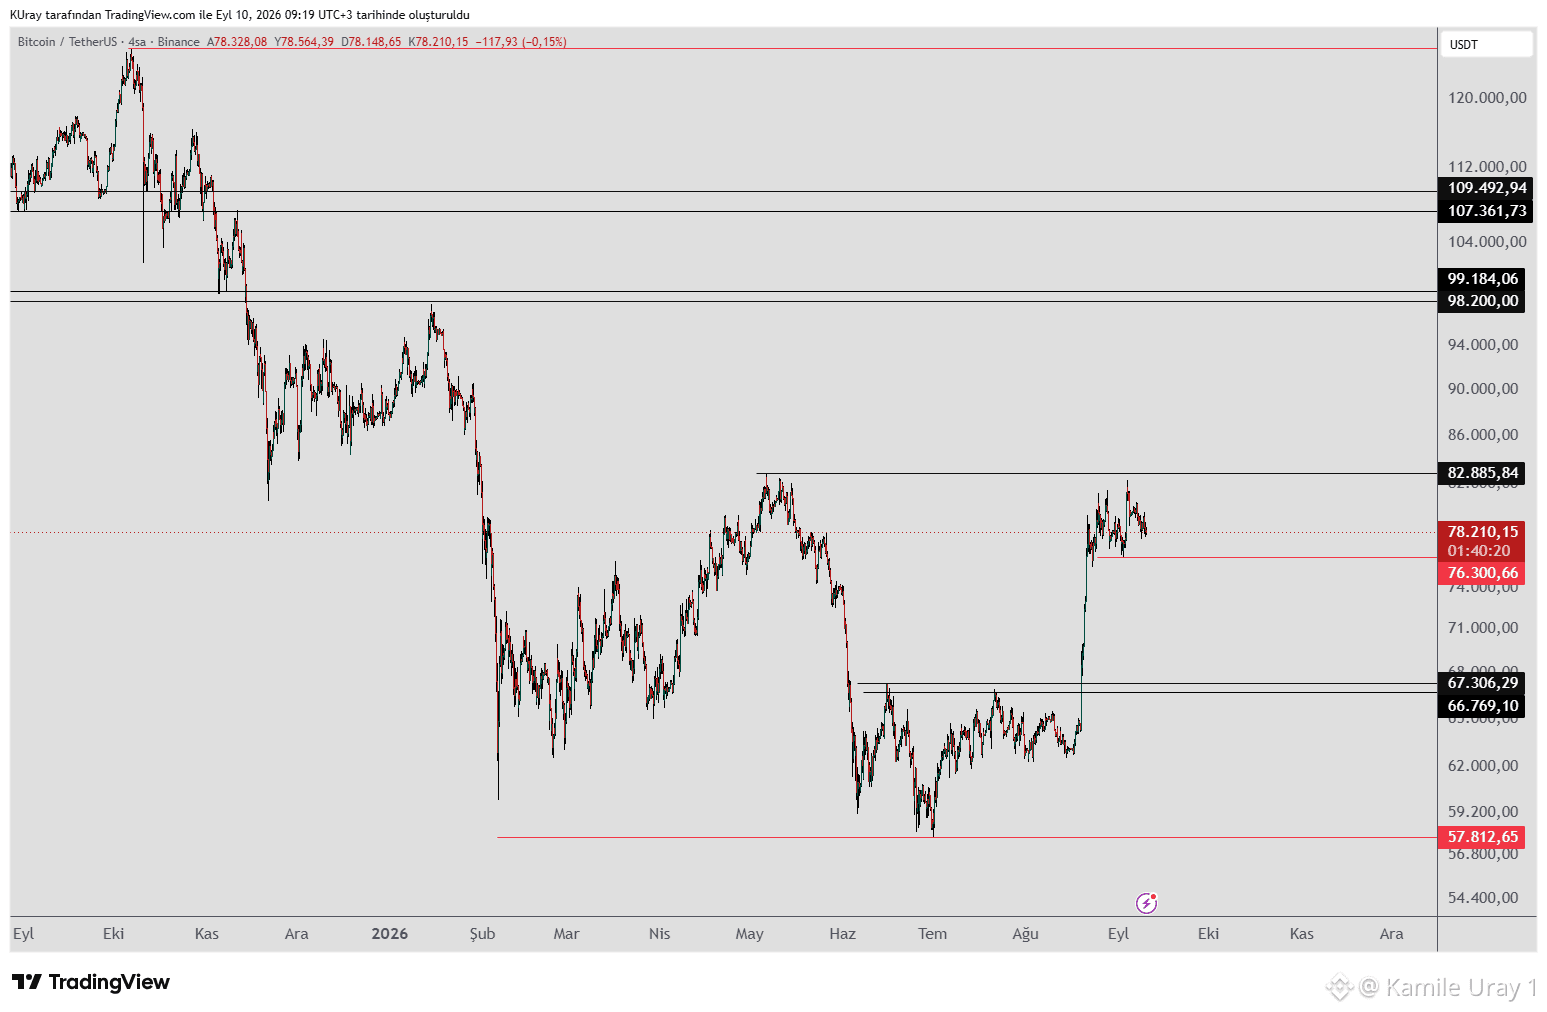
#BTC 上昇の余地は、76,300の水準を上回っている限り維持されます。日足または週足で82,885を上回って終値がついた場合、それは直近の下落局面に対する初めての高値更新(高いピーク)を示すことになります。これにより、上昇トレンドが継続しそうであるというさらなるシグナルとなり、その後はより高いレジスタンス水準を監視できます。価格が76,300を下回って終値をつける場合、67,000〜66,000付近のサポートゾーンを試しに行く可能性があります。この下落は、想定される逆ヘッド・アンド・ショルダー(H&S)パターンの最終的な「肩」を形成するかもしれません。83,000を上回って推移するなら、パターンが有効化され、価格はより高いレジスタンス水準に向けて上昇を続けることが見込まれます。
#BTC 上昇の余地は、76,300の水準を上回っている限り維持されます。日足または週足で82,885を上回って終値がついた場合、それは直近の下落局面に対する初めての高値更新(高いピーク)を示すことになります。これにより、上昇トレンドが継続しそうであるというさらなるシグナルとなり、その後はより高いレジスタンス水準を監視できます。価格が76,300を下回って終値をつける場合、67,000〜66,000付近のサポートゾーンを試しに行く可能性があります。この下落は、想定される逆ヘッド・アンド・ショルダー(H&S)パターンの最終的な「肩」を形成するかもしれません。83,000を上回って推移するなら、パターンが有効化され、価格はより高いレジスタンス水準に向けて上昇を続けることが見込まれます。
58
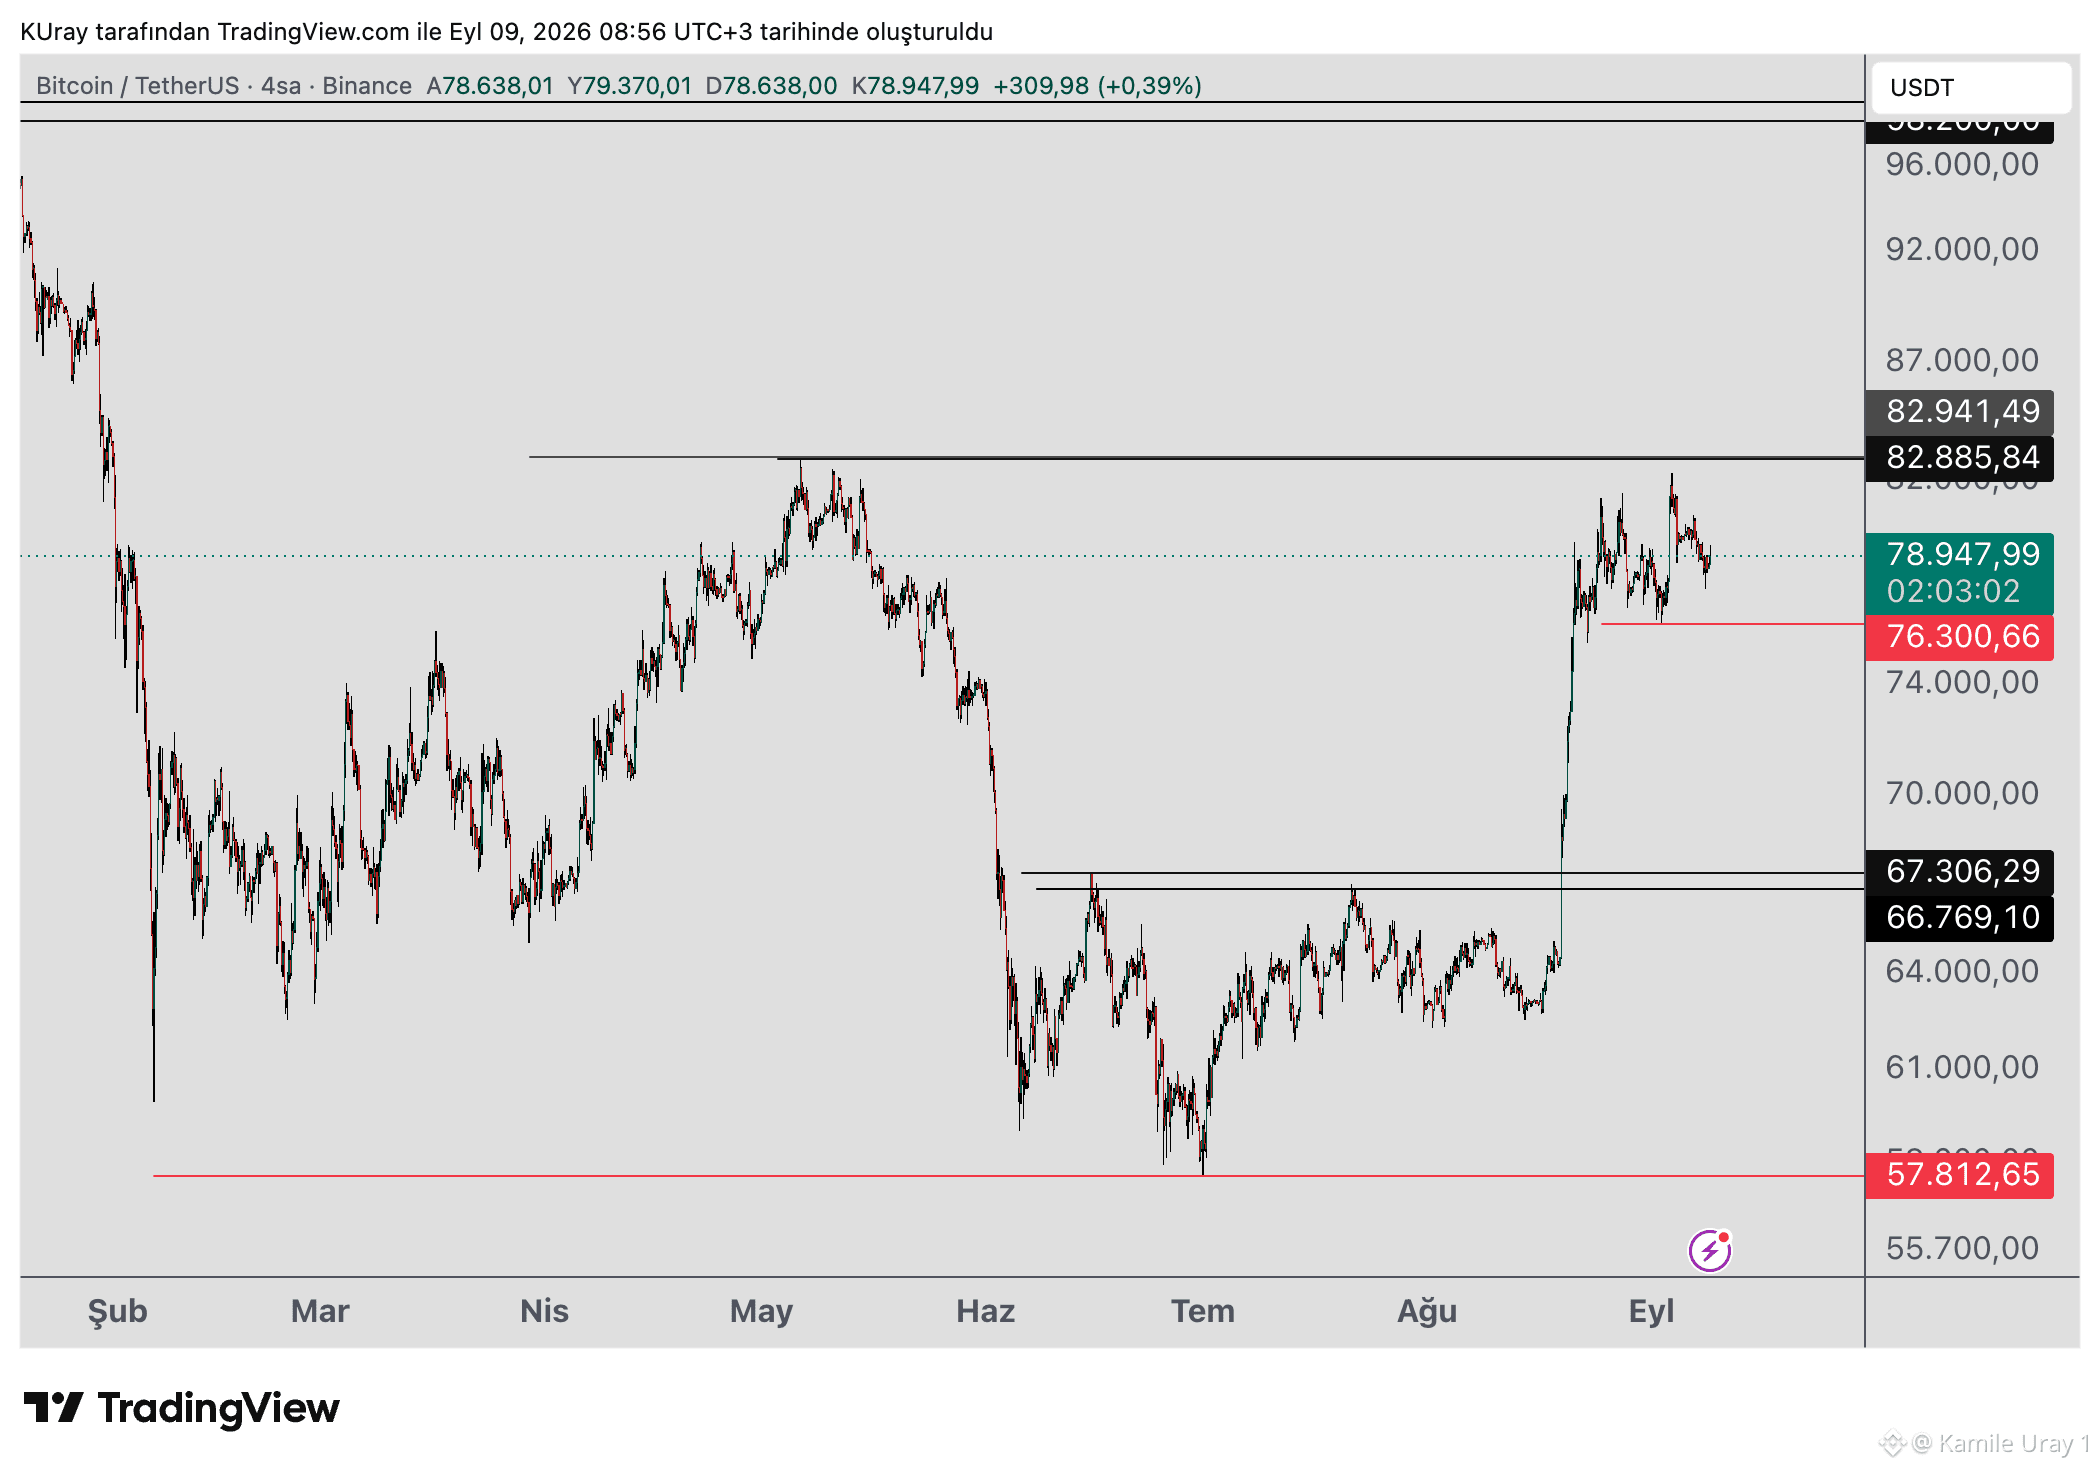
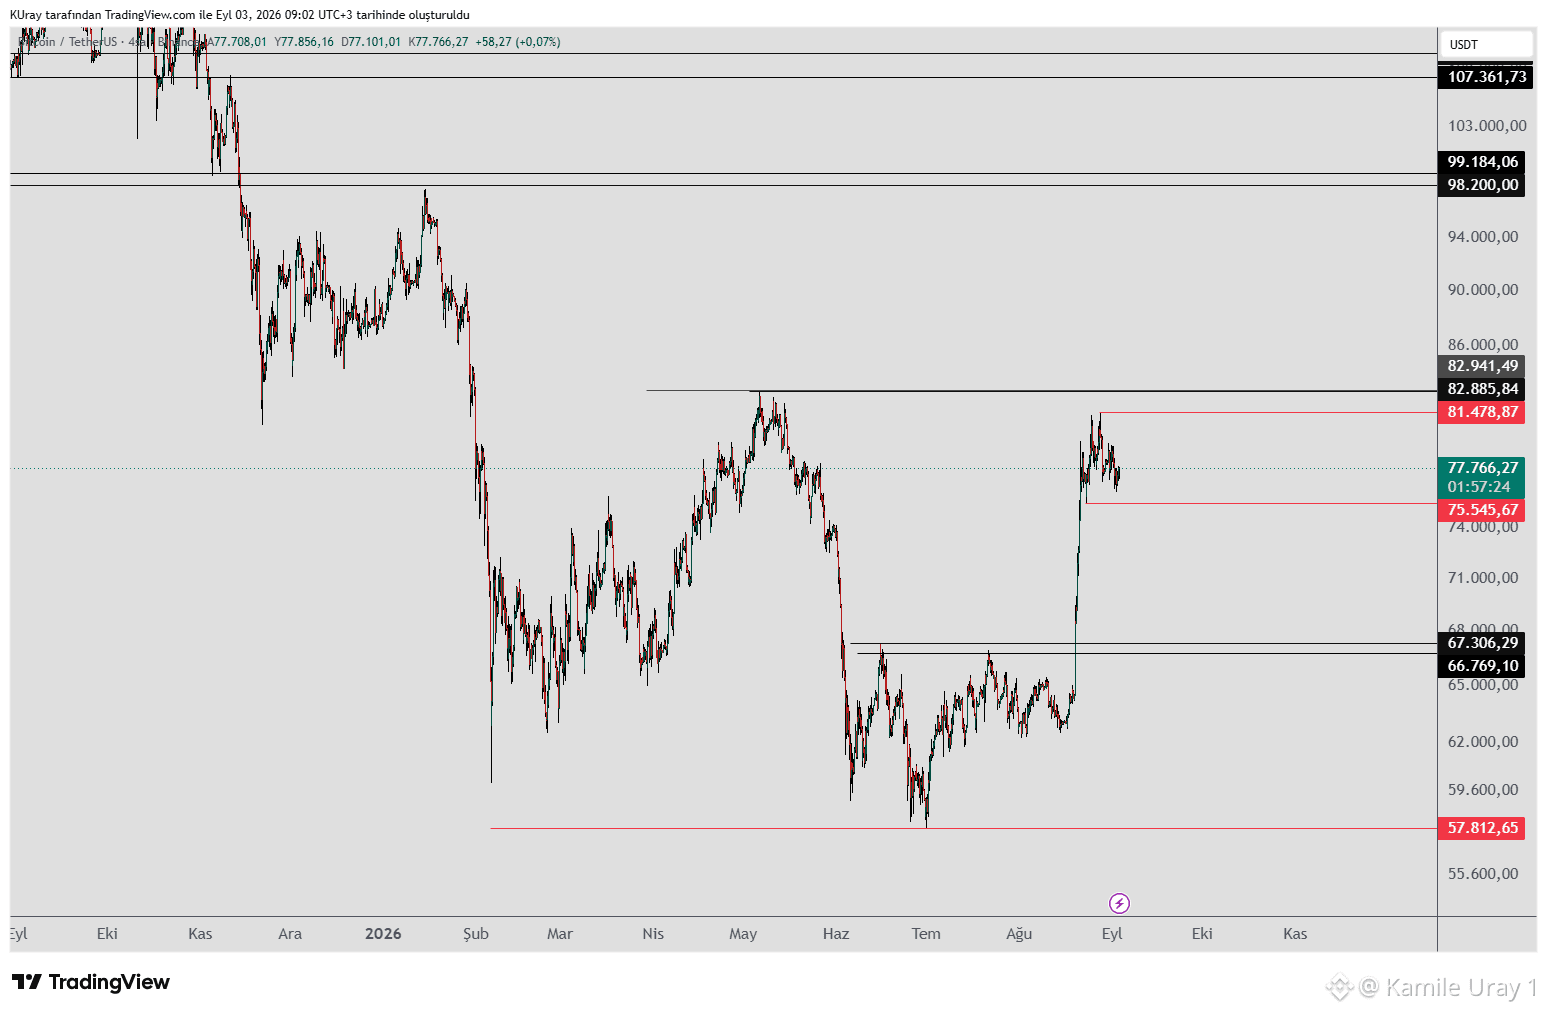
#BTC は過去8日間、81,478〜75,545の範囲で推移しており、その値幅は約6,000ドルです。
もし価格が75,545を下回って終値をつけると、67,000〜66,000付近のサポートゾーンがテストされる可能性があります。この下落は、想定されるインバース・ヘッド&ショルダー(IH&S)パターンの最終的な「肩」を形成し得ます。下落は見込まれるものの、より大きなブル系のIH&Sパターンが形成されつつあります。価格が83,000を上回って推移すればパターンが発動し、上方のレジスタンス水準に向けたさらなる上昇が期待されます。
日足および週足の終値が82,885を上回るなら、直近の下落局面に対する最初の高値更新となり、上昇トレンドが継続しそうだという別の強気シグナルになります。
#BTC は過去8日間、81,478〜75,545の範囲で推移しており、その値幅は約6,000ドルです。
もし価格が75,545を下回って終値をつけると、67,000〜66,000付近のサポートゾーンがテストされる可能性があります。この下落は、想定されるインバース・ヘッド&ショルダー(IH&S)パターンの最終的な「肩」を形成し得ます。下落は見込まれるものの、より大きなブル系のIH&Sパターンが形成されつつあります。価格が83,000を上回って推移すればパターンが発動し、上方のレジスタンス水準に向けたさらなる上昇が期待されます。
日足および週足の終値が82,885を上回るなら、直近の下落局面に対する最初の高値更新となり、上昇トレンドが継続しそうだという別の強気シグナルになります。
もし価格が75,545を下回って終値をつけると、67,000〜66,000付近のサポートゾーンがテストされる可能性があります。この下落は、想定されるインバース・ヘッド&ショルダー(IH&S)パターンの最終的な「肩」を形成し得ます。下落は見込まれるものの、より大きなブル系のIH&Sパターンが形成されつつあります。価格が83,000を上回って推移すればパターンが発動し、上方のレジスタンス水準に向けたさらなる上昇が期待されます。
日足および週足の終値が82,885を上回るなら、直近の下落局面に対する最初の高値更新となり、上昇トレンドが継続しそうだという別の強気シグナルになります。
72
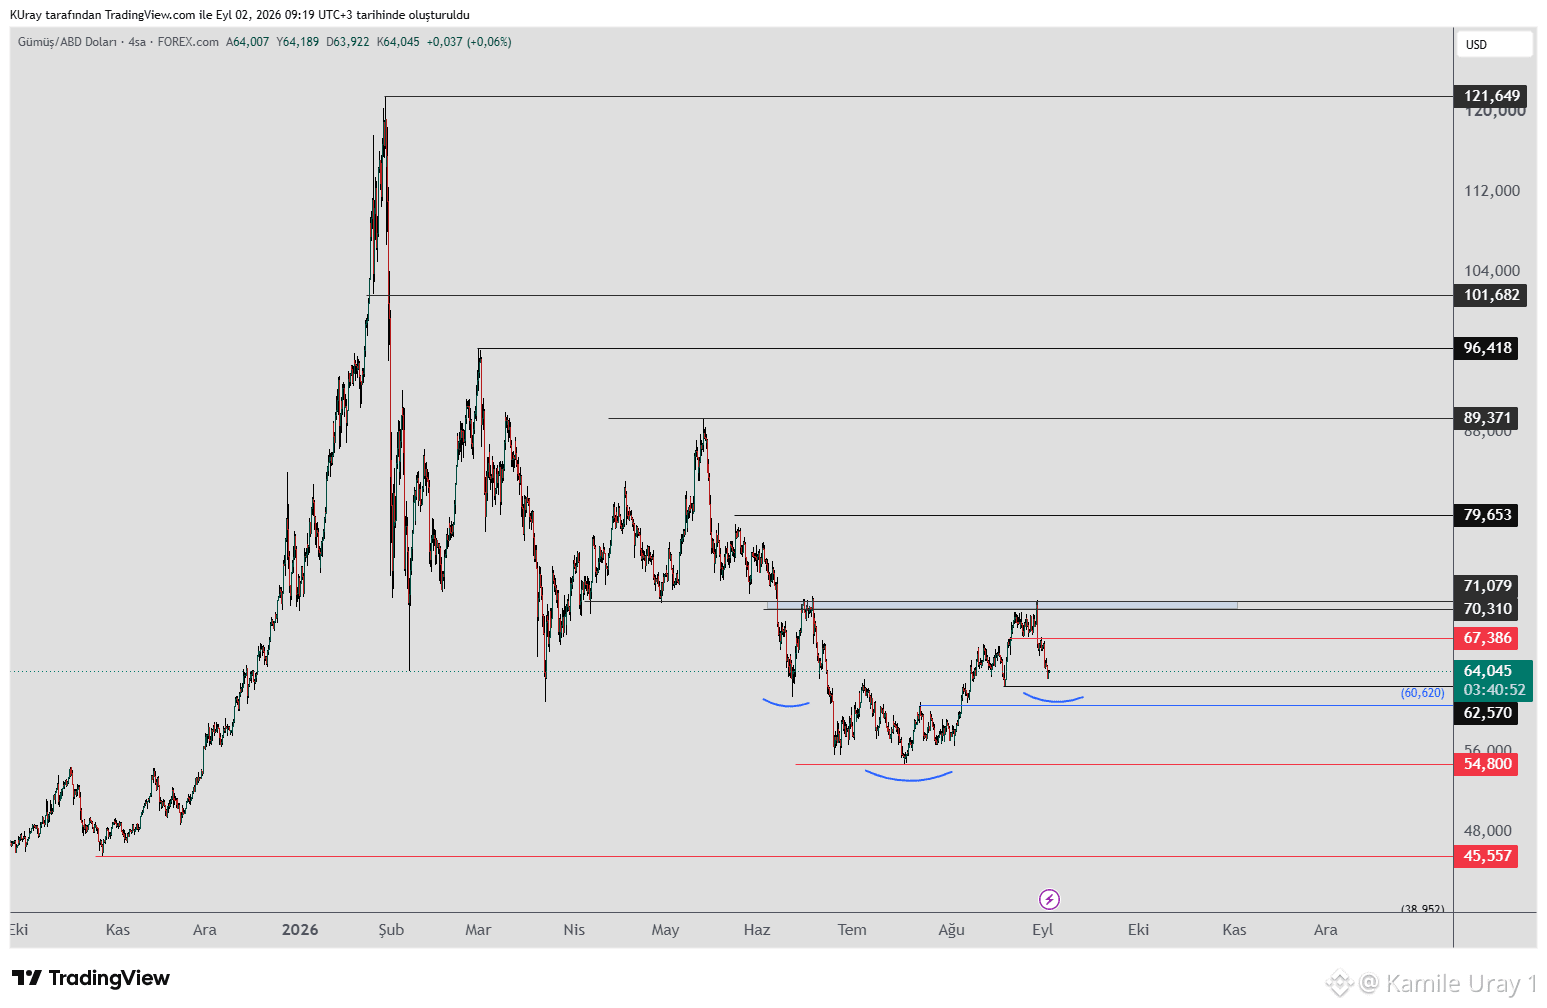
#XAG(シルバー)については、日足チャート上の「青いボックス」の抵抗を監視します。具体的には、価格が70〜71の範囲にある青いボックスを上抜けし、そこで終値をつける場合は、さらなる上昇が見込まれます。その場合、79および89の抵抗水準を見ていきます。
上昇の可能性は、価格が62の水準より上に留まっている限り維持されます。62を下回った場合は、より下方のサポート水準を監視します。下落局面で価格が下支えされれば、再び上昇が期待されます。
価格の波を見ると、下方向の動きは引き続き、全体的な上昇トレンドに対する修正として現れています。
#XAG(シルバー)については、日足チャート上の「青いボックス」の抵抗を監視します。具体的には、価格が70〜71の範囲にある青いボックスを上抜けし、そこで終値をつける場合は、さらなる上昇が見込まれます。その場合、79および89の抵抗水準を見ていきます。
上昇の可能性は、価格が62の水準より上に留まっている限り維持されます。62を下回った場合は、より下方のサポート水準を監視します。下落局面で価格が下支えされれば、再び上昇が期待されます。
価格の波を見ると、下方向の動きは引き続き、全体的な上昇トレンドに対する修正として現れています。
上昇の可能性は、価格が62の水準より上に留まっている限り維持されます。62を下回った場合は、より下方のサポート水準を監視します。下落局面で価格が下支えされれば、再び上昇が期待されます。
価格の波を見ると、下方向の動きは引き続き、全体的な上昇トレンドに対する修正として現れています。
61
翻訳参照
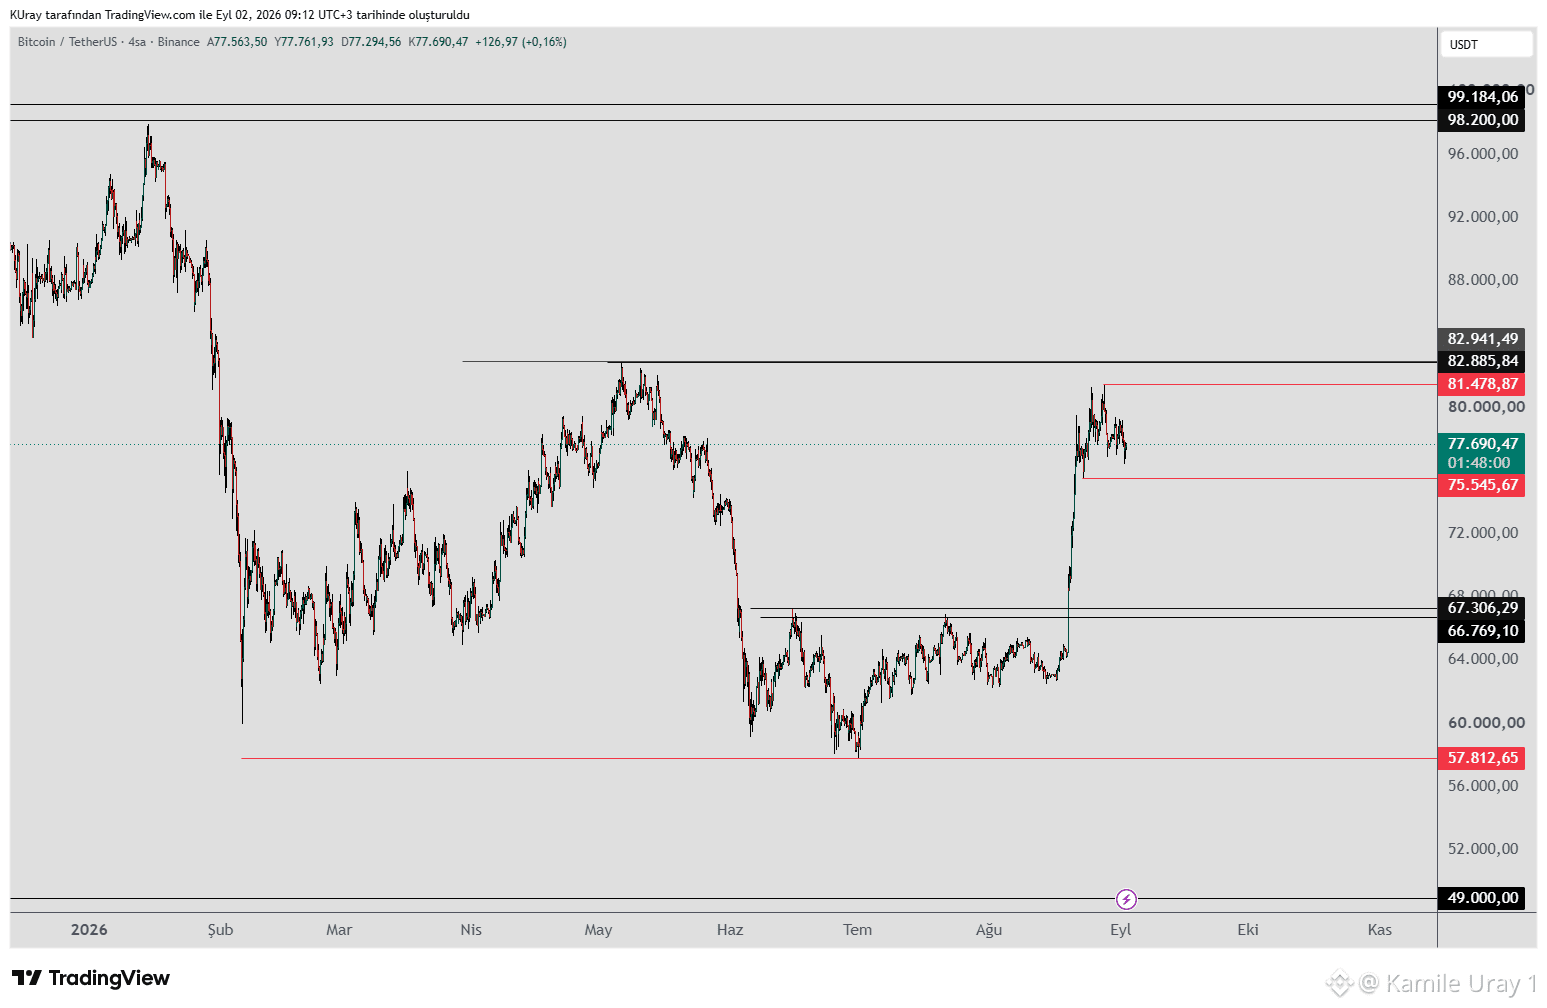
#BTC remains unchanged, trading within the 81,478–75,545 range. The current structure reinforces the likelihood of a continued decline; notably, the rebound following the last downward wave failed to close above the previous peak.
If the price closes below 75,545, it may test the support zone around 67,000–66,000.
These declines could potentially form the final shoulder of an Inverse Head and Shoulders (H&S) pattern.
Although a decline is anticipated, the possibility of a larger bullish Inverse H&S pattern is emerging.
If the price holds above 83,000, the pattern would activate, and a continued rise toward upper resistance levels would be expected.
A daily or weekly close above 82,885 would mark the first higher peak relative to the recent downward wave, serving as a positive signal that the upward trend is likely to continue.
#BTC remains unchanged, trading within the 81,478–75,545 range. The current structure reinforces the likelihood of a continued decline; notably, the rebound following the last downward wave failed to close above the previous peak.
If the price closes below 75,545, it may test the support zone around 67,000–66,000.
These declines could potentially form the final shoulder of an Inverse Head and Shoulders (H&S) pattern.
Although a decline is anticipated, the possibility of a larger bullish Inverse H&S pattern is emerging.
If the price holds above 83,000, the pattern would activate, and a continued rise toward upper resistance levels would be expected.
A daily or weekly close above 82,885 would mark the first higher peak relative to the recent downward wave, serving as a positive signal that the upward trend is likely to continue.
If the price closes below 75,545, it may test the support zone around 67,000–66,000.
These declines could potentially form the final shoulder of an Inverse Head and Shoulders (H&S) pattern.
Although a decline is anticipated, the possibility of a larger bullish Inverse H&S pattern is emerging.
If the price holds above 83,000, the pattern would activate, and a continued rise toward upper resistance levels would be expected.
A daily or weekly close above 82,885 would mark the first higher peak relative to the recent downward wave, serving as a positive signal that the upward trend is likely to continue.
71
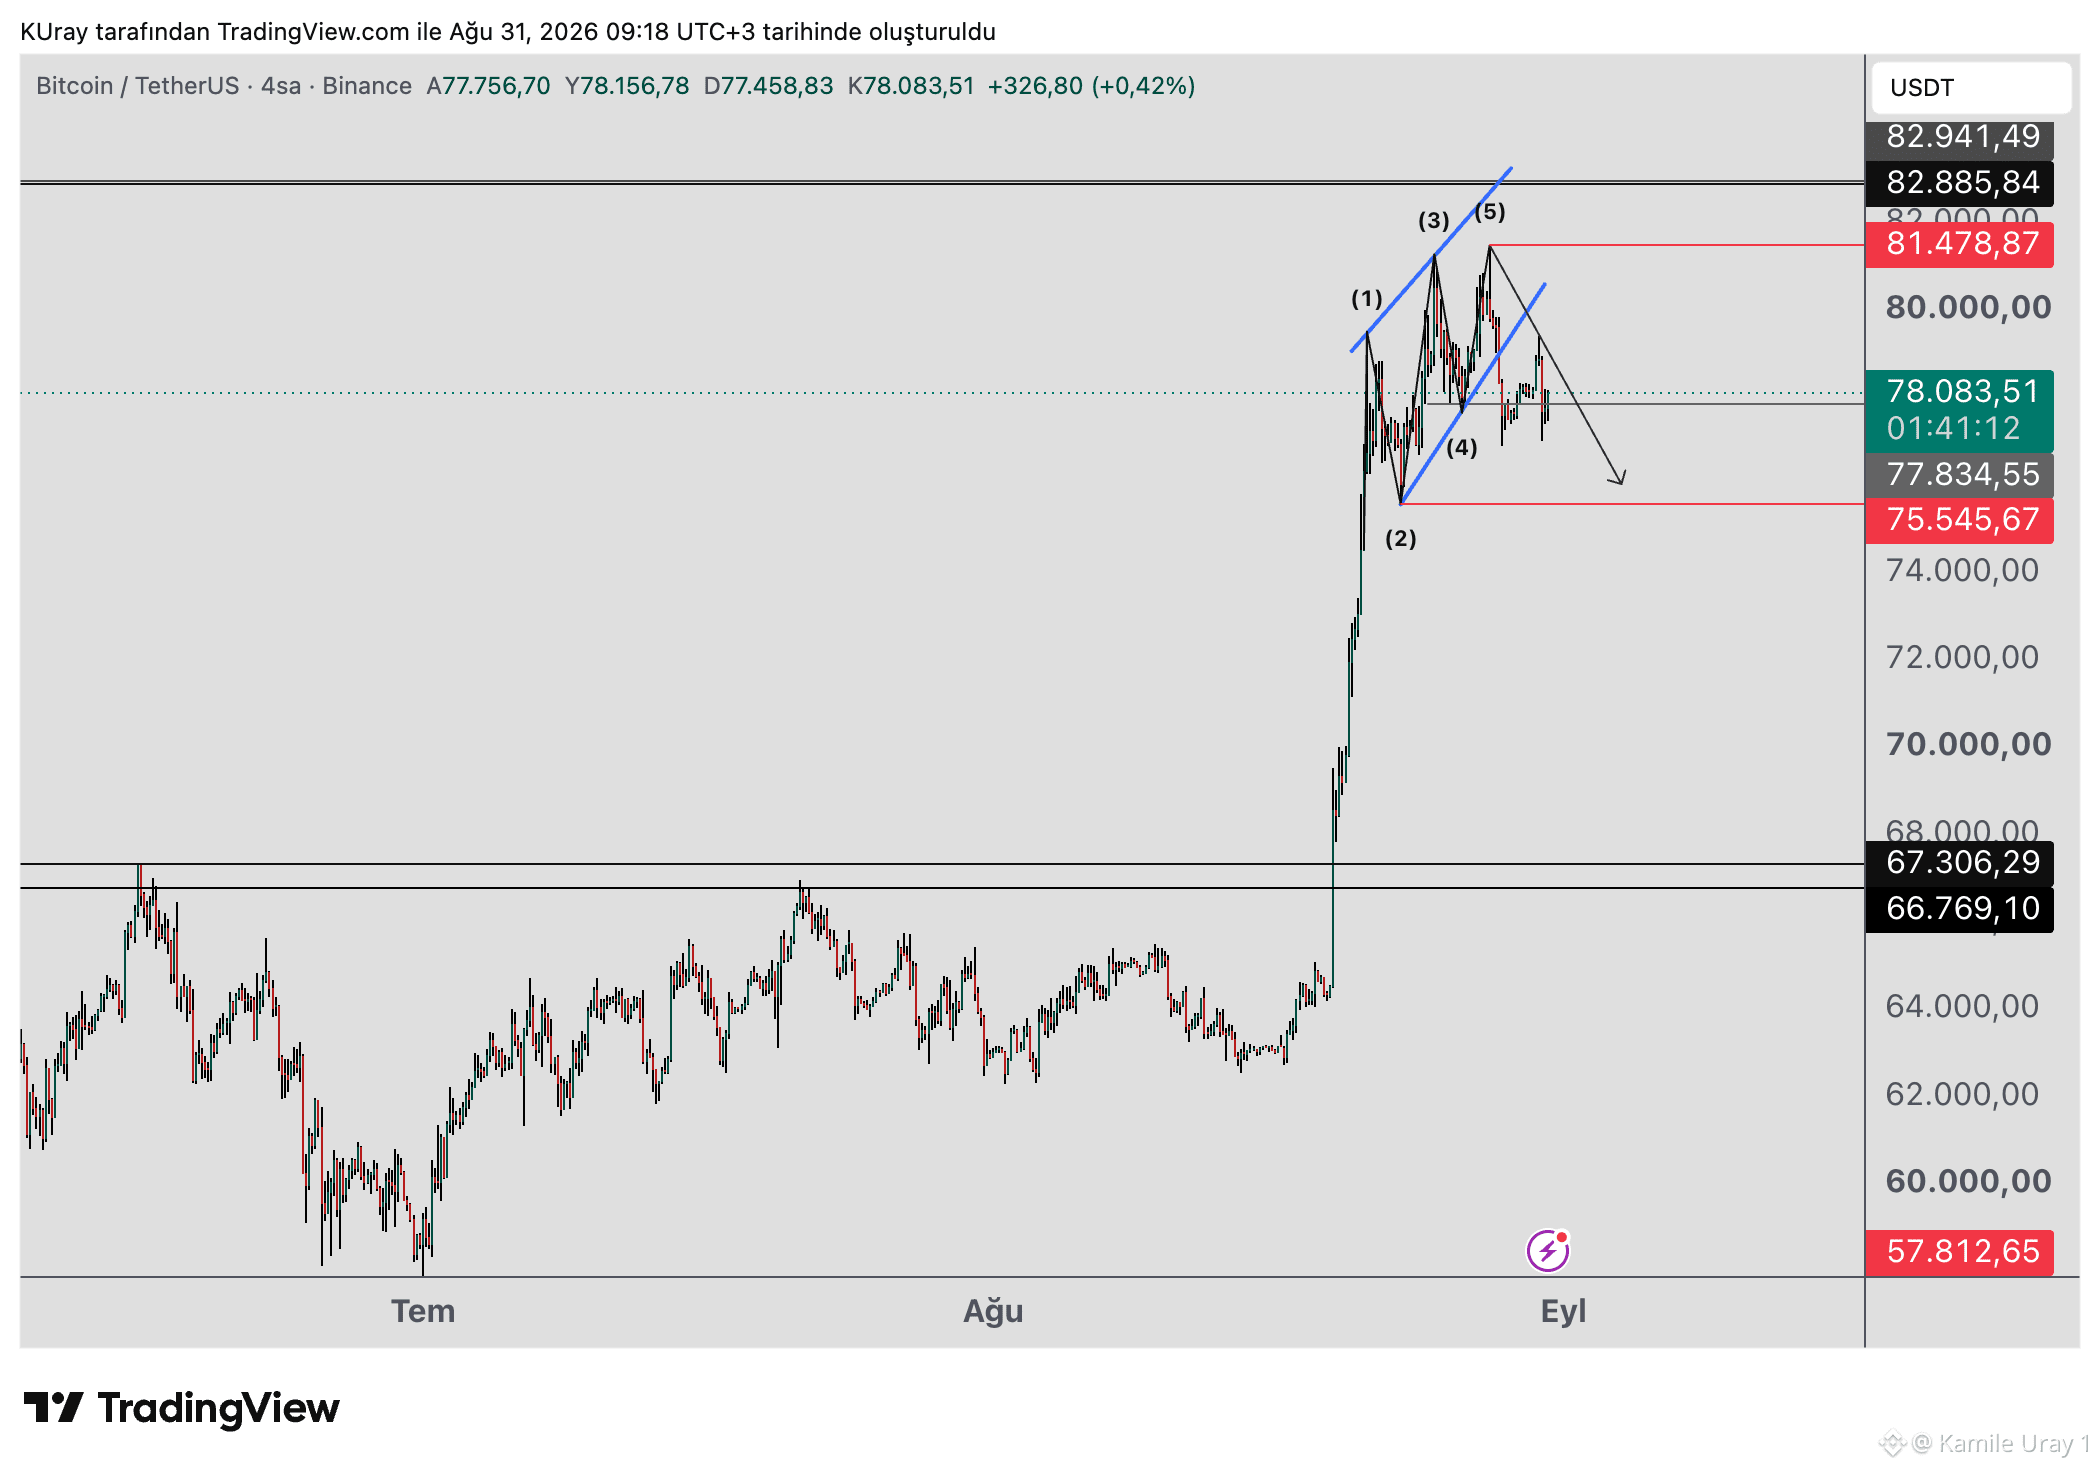
#BTC は Wolfe Wave のパターンを完成させる前に下落しました。代わりに、ウェッジ構造が展開されました。ウェッジ内で「3」および「5」で示されたピーク付近において売り圧力が蓄積していました。高値では上ヒゲの長いローソク足が形成されており、この構造が変動を引き起こしそうであることを示す重要なサインです。さらに、上昇局面での RSI のダイバージェンスが、二次的な弱気シグナルとなり、ウェッジの妥当性を裏付けました。これから 81,478 のピークを監視します。この水準を上回る形で 4時間足が確定できない場合、下落は継続するでしょう。75,545 は下落局面での最初のサポートであり、この価格が下に保たれるなら下落がさらに延び、67,000〜66,000 付近のサポートゾーンをテストする可能性があります。この下落は、インバースヘッドアンドショルダーズ(IH&S)パターンの最終的な肩を形成している可能性が高いです。価格が 83,000 を上回って推移するならパターンが有効化し、上方のレジスタンス水準へ向けた上昇が見込まれます。もし日足・週足の両方の時間軸で 82,885 を上回って終値を付けるなら、直近の弱気局面に対する最初の高値切り上げとなり、上昇トレンドが継続するための前向きなシグナルになります。
#BTC は Wolfe Wave のパターンを完成させる前に下落しました。代わりに、ウェッジ構造が展開されました。ウェッジ内で「3」および「5」で示されたピーク付近において売り圧力が蓄積していました。高値では上ヒゲの長いローソク足が形成されており、この構造が変動を引き起こしそうであることを示す重要なサインです。さらに、上昇局面での RSI のダイバージェンスが、二次的な弱気シグナルとなり、ウェッジの妥当性を裏付けました。これから 81,478 のピークを監視します。この水準を上回る形で 4時間足が確定できない場合、下落は継続するでしょう。75,545 は下落局面での最初のサポートであり、この価格が下に保たれるなら下落がさらに延び、67,000〜66,000 付近のサポートゾーンをテストする可能性があります。この下落は、インバースヘッドアンドショルダーズ(IH&S)パターンの最終的な肩を形成している可能性が高いです。価格が 83,000 を上回って推移するならパターンが有効化し、上方のレジスタンス水準へ向けた上昇が見込まれます。もし日足・週足の両方の時間軸で 82,885 を上回って終値を付けるなら、直近の弱気局面に対する最初の高値切り上げとなり、上昇トレンドが継続するための前向きなシグナルになります。
53
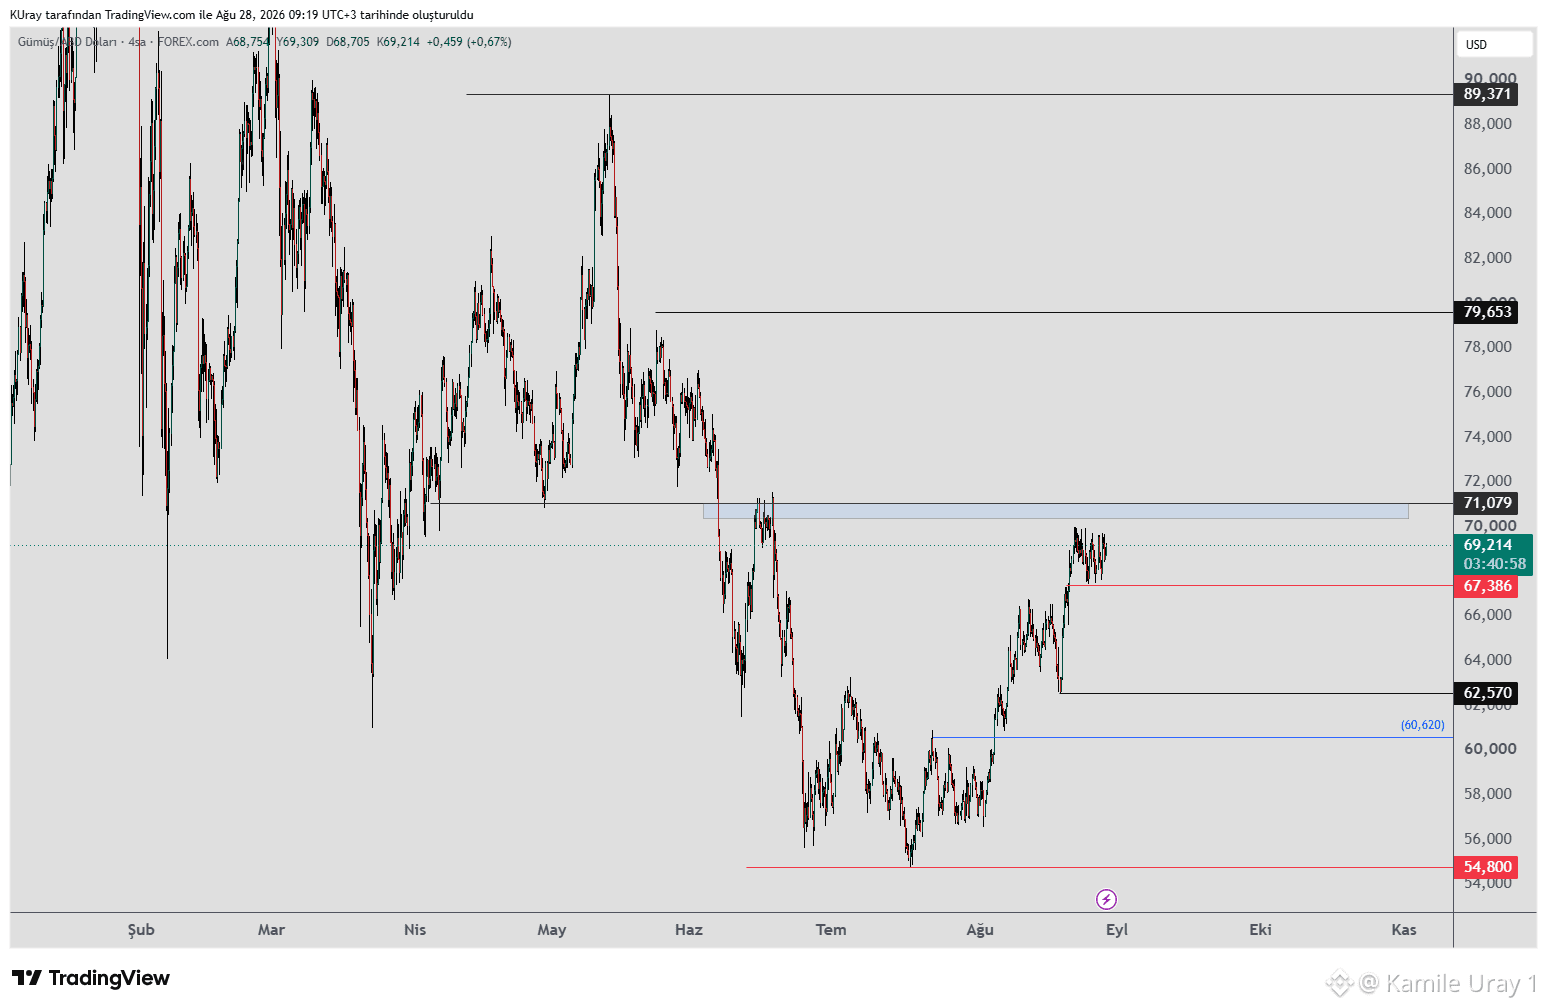
#xag #Silver は狭いレンジ内で取引されています。
67の水準を維持しているものの、71を上回って終値で上抜けできず、現在は調整(コンソリデーション)局面にあります。67の水準を上回っている限り、上昇の可能性は残ります。
もし71の水準にある青いボックスを上で維持できれば、79〜89のレジスタンス水準を監視します。
ただし、青いボックスのレジスタンスを突破できず、67を下回って終値で引ける場合、下落は継続する可能性があります。
下方向については、4時間足チャートで62の水準より上を維持している限り、上方向への動きの可能性は残ります。62を下回った場合は、より低いサポート水準を見ていきます。
#xag #Silver は狭いレンジ内で取引されています。
67の水準を維持しているものの、71を上回って終値で上抜けできず、現在は調整(コンソリデーション)局面にあります。67の水準を上回っている限り、上昇の可能性は残ります。
もし71の水準にある青いボックスを上で維持できれば、79〜89のレジスタンス水準を監視します。
ただし、青いボックスのレジスタンスを突破できず、67を下回って終値で引ける場合、下落は継続する可能性があります。
下方向については、4時間足チャートで62の水準より上を維持している限り、上方向への動きの可能性は残ります。62を下回った場合は、より低いサポート水準を見ていきます。
67の水準を維持しているものの、71を上回って終値で上抜けできず、現在は調整(コンソリデーション)局面にあります。67の水準を上回っている限り、上昇の可能性は残ります。
もし71の水準にある青いボックスを上で維持できれば、79〜89のレジスタンス水準を監視します。
ただし、青いボックスのレジスタンスを突破できず、67を下回って終値で引ける場合、下落は継続する可能性があります。
下方向については、4時間足チャートで62の水準より上を維持している限り、上方向への動きの可能性は残ります。62を下回った場合は、より低いサポート水準を見ていきます。
62
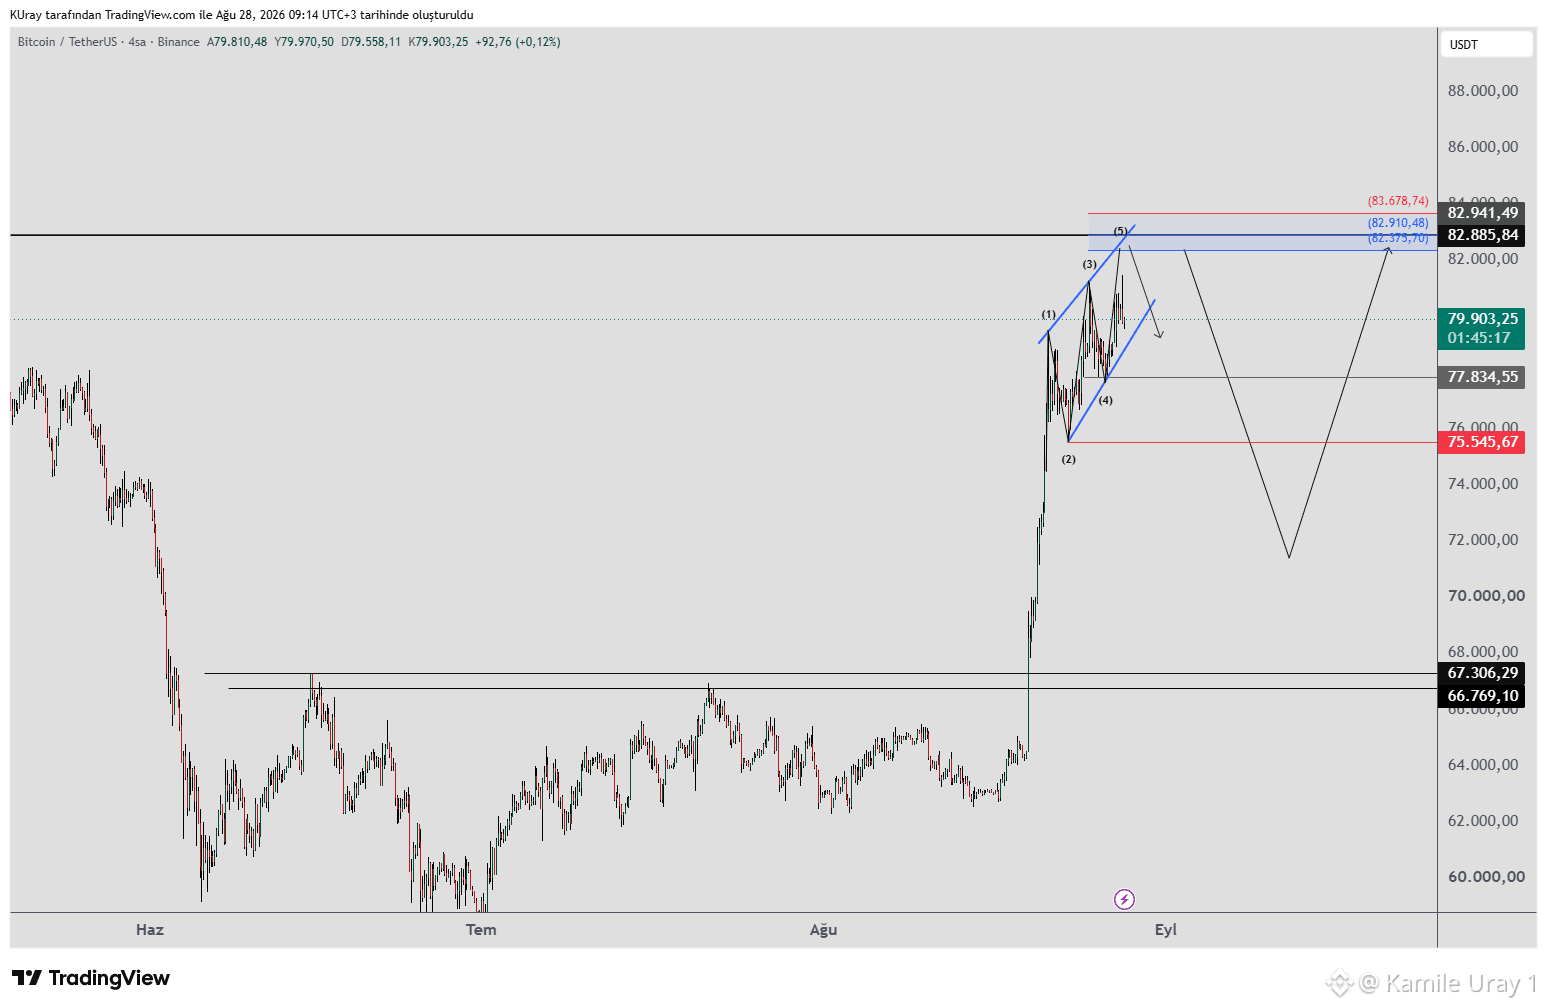
#BTC においてウルフ・ウェーブ・パターンの可能性を監視しています。価格が 82,400–82,900 のゾーンまで上昇した場合、そこから下向きの動きが始まる可能性があります。
なお、このパターンのストップ水準は 83,769 を上回る 4時間足の終値です。その場合、パターンは無効となります。
下方向では、75,545 が最初のターゲットです。ここを下回れば、下落はさらに拡大する可能性があります。この下落は、逆ヘッド&ショルダー(H&S)構造の最終的な右肩を形成する可能性が高いです。その後、価格が 83,000 を上回って推移(維持)すれば、パターンが発動し、上方のレジスタンス帯に向けた上昇の継続が見込まれます。
日足または週足の終値が 82,885 を上回ると、直近の下向きの波に対する最初の高値(より高いピーク)となります。これは、上昇トレンドが継続する可能性が高いことを示すポジティブなサインです。
#BTC においてウルフ・ウェーブ・パターンの可能性を監視しています。価格が 82,400–82,900 のゾーンまで上昇した場合、そこから下向きの動きが始まる可能性があります。
なお、このパターンのストップ水準は 83,769 を上回る 4時間足の終値です。その場合、パターンは無効となります。
下方向では、75,545 が最初のターゲットです。ここを下回れば、下落はさらに拡大する可能性があります。この下落は、逆ヘッド&ショルダー(H&S)構造の最終的な右肩を形成する可能性が高いです。その後、価格が 83,000 を上回って推移(維持)すれば、パターンが発動し、上方のレジスタンス帯に向けた上昇の継続が見込まれます。
日足または週足の終値が 82,885 を上回ると、直近の下向きの波に対する最初の高値(より高いピーク)となります。これは、上昇トレンドが継続する可能性が高いことを示すポジティブなサインです。
なお、このパターンのストップ水準は 83,769 を上回る 4時間足の終値です。その場合、パターンは無効となります。
下方向では、75,545 が最初のターゲットです。ここを下回れば、下落はさらに拡大する可能性があります。この下落は、逆ヘッド&ショルダー(H&S)構造の最終的な右肩を形成する可能性が高いです。その後、価格が 83,000 を上回って推移(維持)すれば、パターンが発動し、上方のレジスタンス帯に向けた上昇の継続が見込まれます。
日足または週足の終値が 82,885 を上回ると、直近の下向きの波に対する最初の高値(より高いピーク)となります。これは、上昇トレンドが継続する可能性が高いことを示すポジティブなサインです。
76
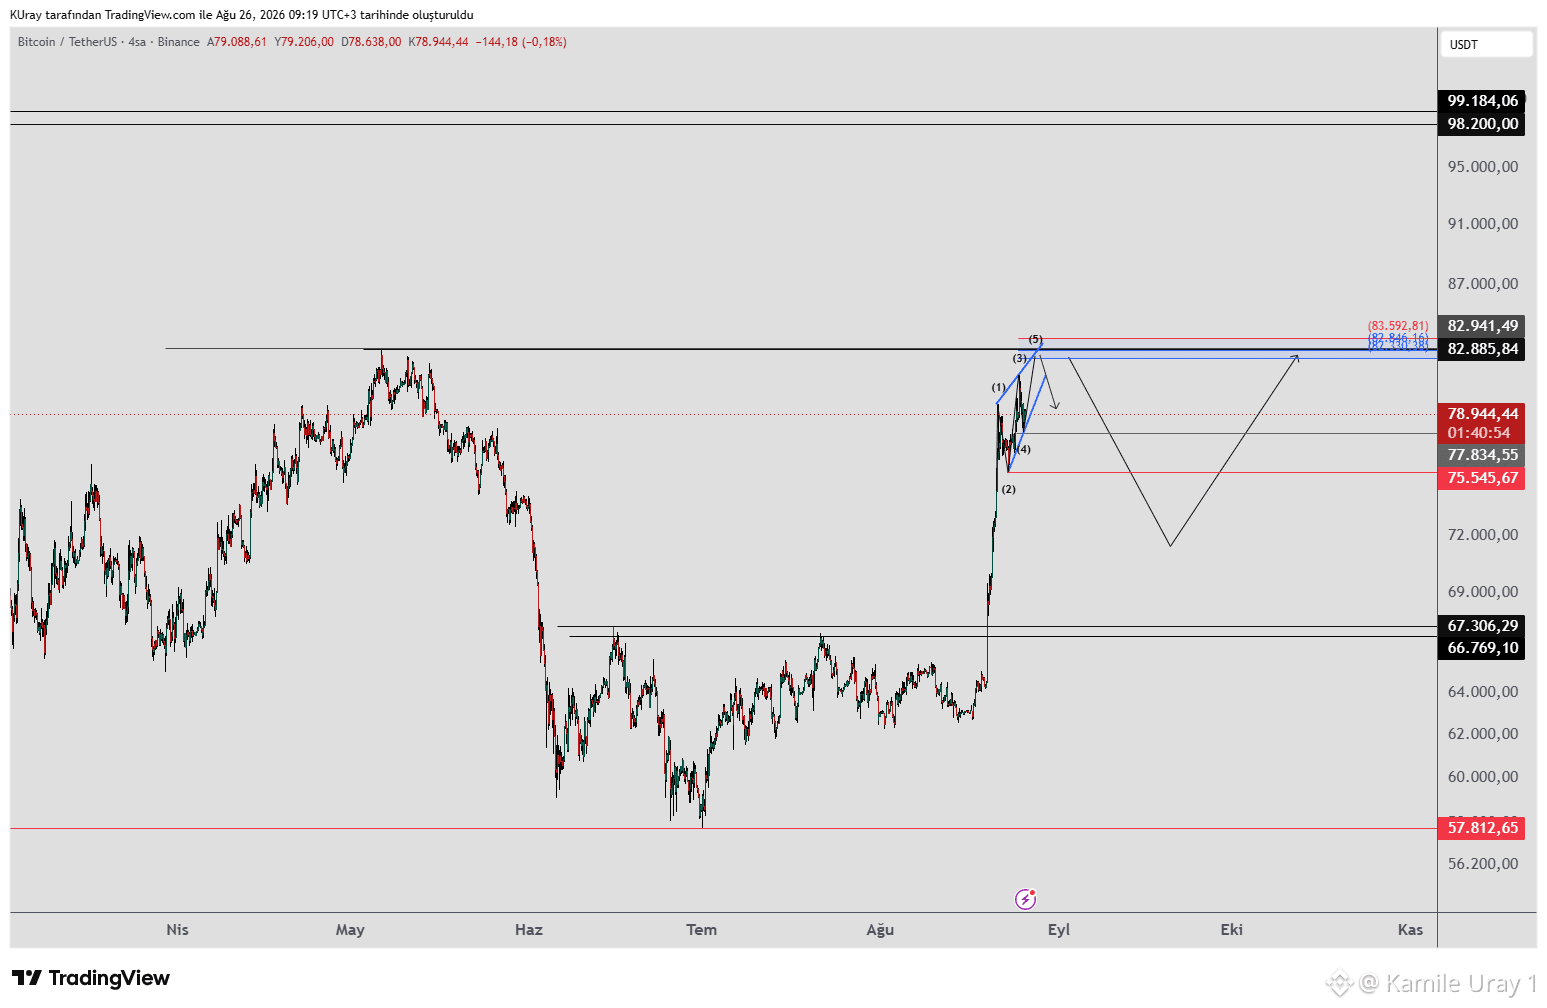
BTCは4時間足の時間軸で75,545の水準を維持し続けています。しかし上昇中に波の振幅が縮小し始め、RSI上にダイバージェンスが形成されました。上方への動きは、Wolfe Wave(ウルフ・ウェーブ)パターンの形に近づき始めています。このパターンは次のように構成されています。価格が77,834の安値を上回ったままであれば、もう1回上向きの波がある可能性があります。82,330〜82,846のゾーンは上昇局面でレジスタンスとして機能し、ここから下落が始まる可能性があります。パターンのストップ水準は、83,592を上回る4時間足の終値です。下方向では、75,545の水準が最初のターゲットで、この水準を下回ると下落はさらに拡大するかもしれません。この下落は、逆ヘッド・アンド・ショルダー(H&S)構造の最終的な右肩を形成する可能性が高いです。価格が83,000を上回って推移するなら、パターンは有効化され、上位のレジスタンスに向けた上昇が継続することが見込まれます。日足および週足で82,885を上回る終値が出た場合、直近の下落波に対して初めての高値更新を意味します。これは、上昇トレンドが継続しそうだという前向きなシグナルとなります。
BTCは4時間足の時間軸で75,545の水準を維持し続けています。しかし上昇中に波の振幅が縮小し始め、RSI上にダイバージェンスが形成されました。上方への動きは、Wolfe Wave(ウルフ・ウェーブ)パターンの形に近づき始めています。このパターンは次のように構成されています。価格が77,834の安値を上回ったままであれば、もう1回上向きの波がある可能性があります。82,330〜82,846のゾーンは上昇局面でレジスタンスとして機能し、ここから下落が始まる可能性があります。パターンのストップ水準は、83,592を上回る4時間足の終値です。下方向では、75,545の水準が最初のターゲットで、この水準を下回ると下落はさらに拡大するかもしれません。この下落は、逆ヘッド・アンド・ショルダー(H&S)構造の最終的な右肩を形成する可能性が高いです。価格が83,000を上回って推移するなら、パターンは有効化され、上位のレジスタンスに向けた上昇が継続することが見込まれます。日足および週足で82,885を上回る終値が出た場合、直近の下落波に対して初めての高値更新を意味します。これは、上昇トレンドが継続しそうだという前向きなシグナルとなります。
77
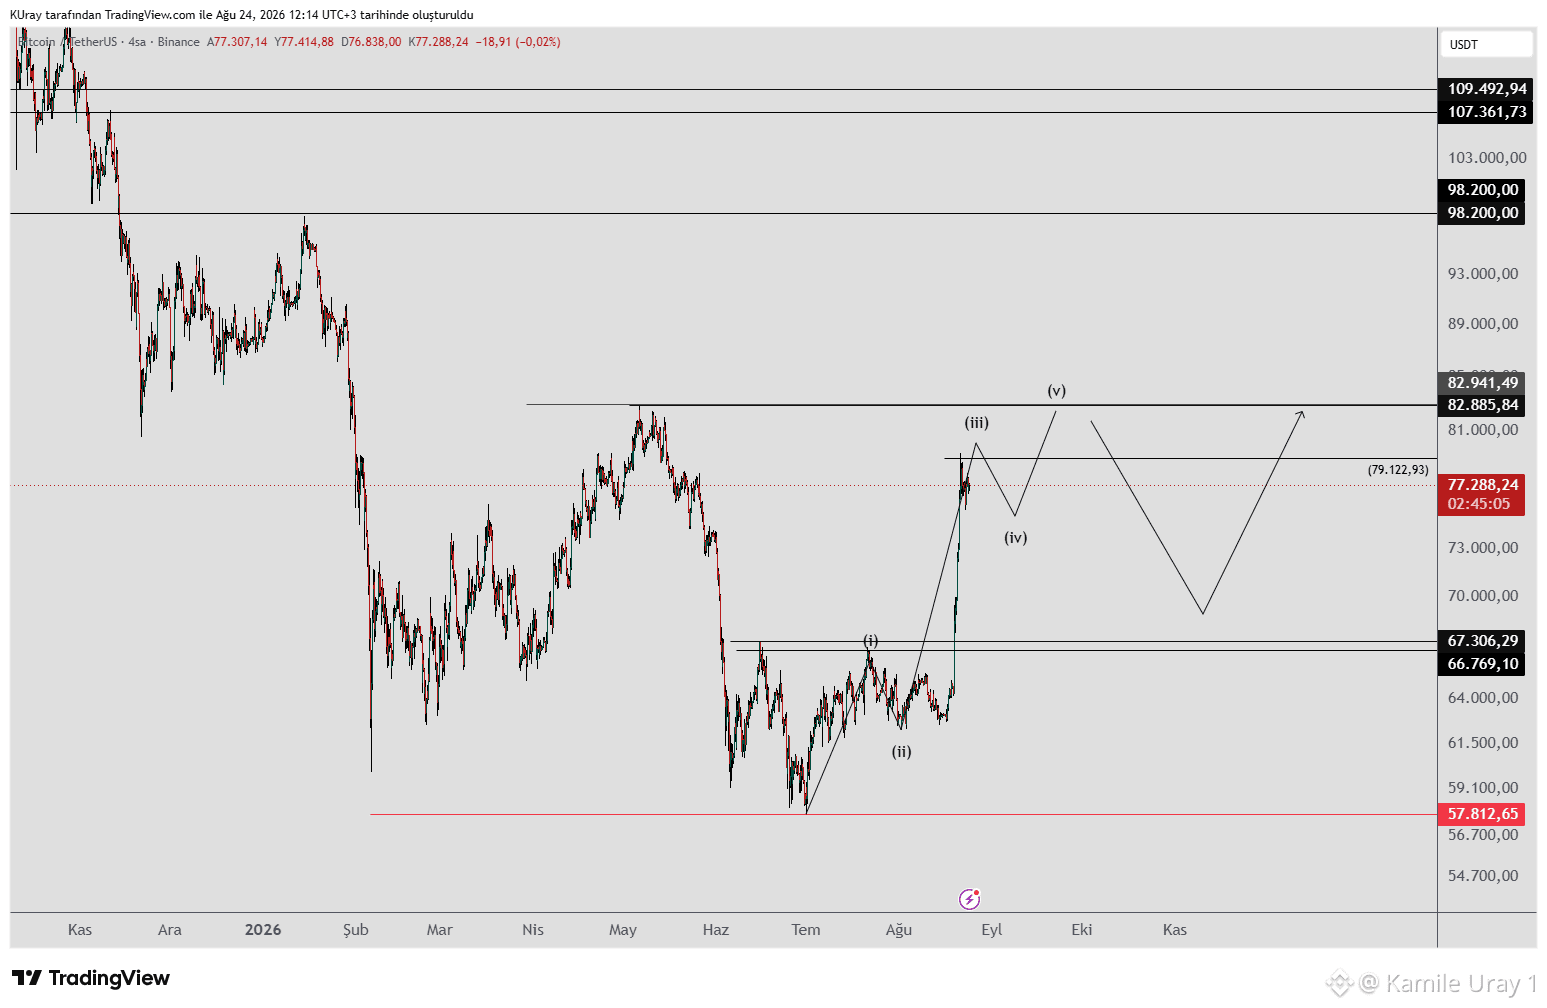
#BTC が 62,275 の水準を上回っている限り、強気の見通しを維持していました。67,000 で逆ヘッドアンドショルダー(H&S)のパターンが出現することを想定していました。実際にそれが出て、目標値に到達しました。新しいチャートは共有しませんでしたが、重要な水準には印を付けており、その値動きはチャートで追跡できると思います。
71,000〜75,000 のレジスタンスも既に突破されています。4時間足の構造を見ると、5波動の動きの可能性があります。第3波はすでに終了しており、現在は第4波の局面です。ここで一度短い調整が入った後、もう一段の上昇が起こるかもしれません。
これにより、上昇局面で 82,885 のレジスタンスを試しにいく可能性が高まります。もし価格が日足および週足の両方で 82,885 を上回って終値をつけるなら、直近の弱気波に対して初めての高値更新となり、上昇トレンドが続くことを示すポジティブなサインになります。
私が示した波のパターンに沿って進むなら、逆H&S やカップ・アンド・ハンドルのように、さらなる上昇に適した構造が形成され、82,885 の水準を上抜けた後に価格がさらに押し上げられる可能性があります。
今後も波の構造を監視していきます。
#BTC が 62,275 の水準を上回っている限り、強気の見通しを維持していました。67,000 で逆ヘッドアンドショルダー(H&S)のパターンが出現することを想定していました。実際にそれが出て、目標値に到達しました。新しいチャートは共有しませんでしたが、重要な水準には印を付けており、その値動きはチャートで追跡できると思います。
71,000〜75,000 のレジスタンスも既に突破されています。4時間足の構造を見ると、5波動の動きの可能性があります。第3波はすでに終了しており、現在は第4波の局面です。ここで一度短い調整が入った後、もう一段の上昇が起こるかもしれません。
これにより、上昇局面で 82,885 のレジスタンスを試しにいく可能性が高まります。もし価格が日足および週足の両方で 82,885 を上回って終値をつけるなら、直近の弱気波に対して初めての高値更新となり、上昇トレンドが続くことを示すポジティブなサインになります。
私が示した波のパターンに沿って進むなら、逆H&S やカップ・アンド・ハンドルのように、さらなる上昇に適した構造が形成され、82,885 の水準を上抜けた後に価格がさらに押し上げられる可能性があります。
今後も波の構造を監視していきます。
71,000〜75,000 のレジスタンスも既に突破されています。4時間足の構造を見ると、5波動の動きの可能性があります。第3波はすでに終了しており、現在は第4波の局面です。ここで一度短い調整が入った後、もう一段の上昇が起こるかもしれません。
これにより、上昇局面で 82,885 のレジスタンスを試しにいく可能性が高まります。もし価格が日足および週足の両方で 82,885 を上回って終値をつけるなら、直近の弱気波に対して初めての高値更新となり、上昇トレンドが続くことを示すポジティブなサインになります。
私が示した波のパターンに沿って進むなら、逆H&S やカップ・アンド・ハンドルのように、さらなる上昇に適した構造が形成され、82,885 の水準を上抜けた後に価格がさらに押し上げられる可能性があります。
今後も波の構造を監視していきます。
75
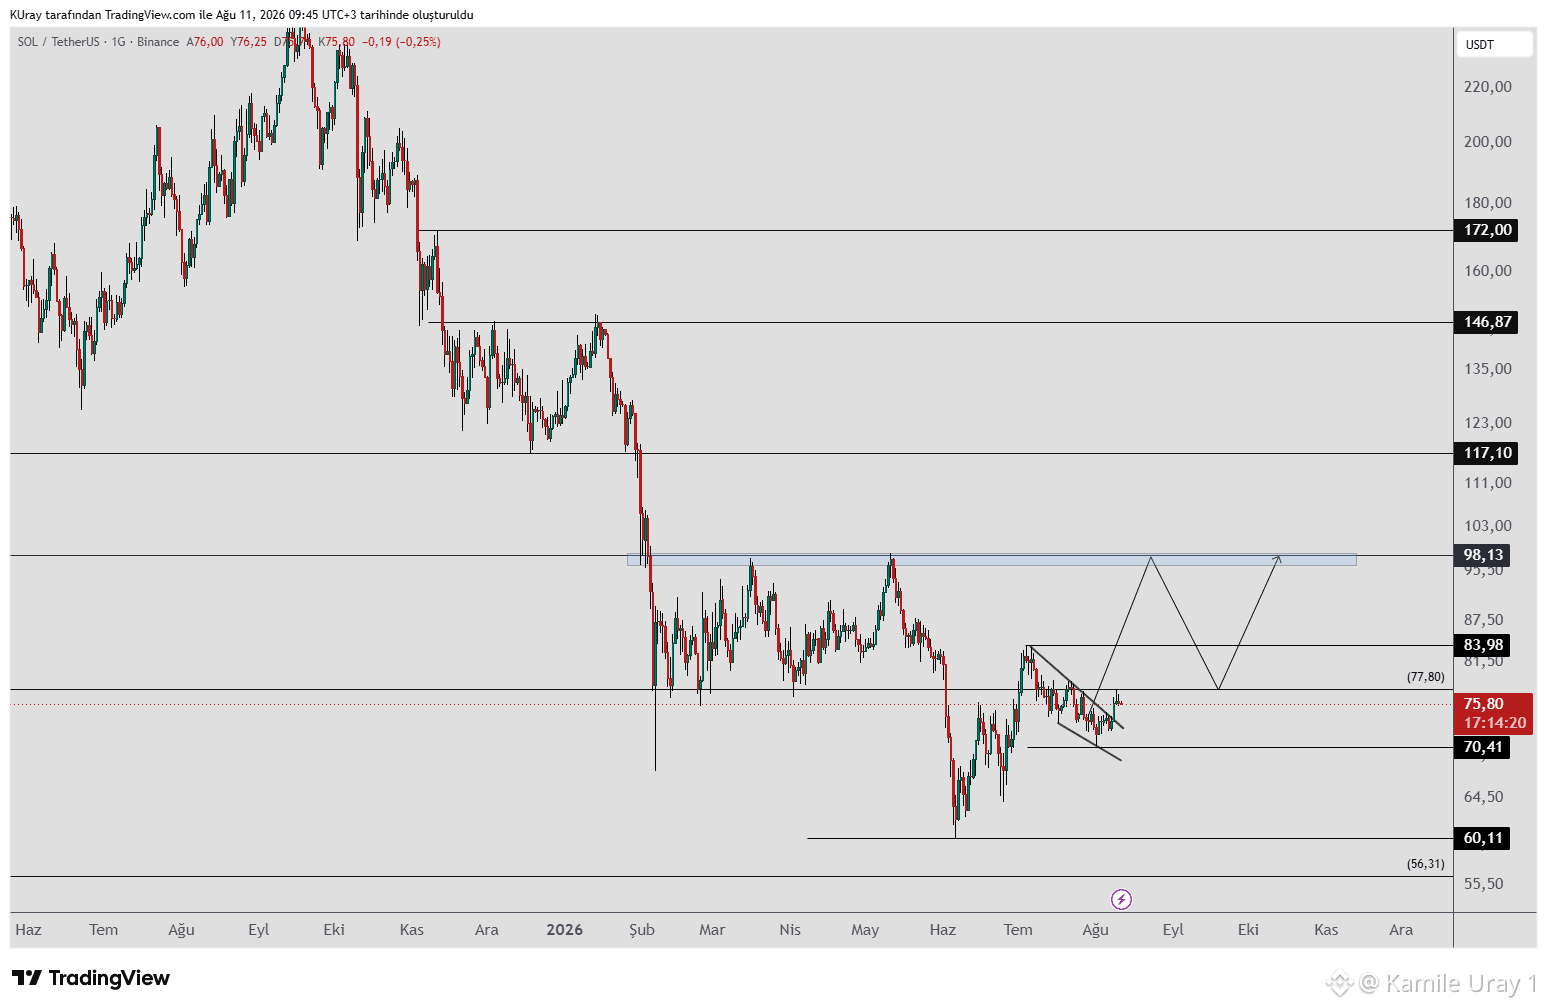
左側のウェッジ構造をブレイクしました。70(安値)を維持している限り、上方向への動きの可能性があります。83と93のレジスタンス水準を監視してください。私が矢印で示した動きに沿うなら、逆ヘッドアンドショルダー(H&S)パターンが形成されるでしょう。青いボックスがブレイクされ、その上で価格が定着した場合、117〜146のレジスタンス水準をテストする可能性があります。
左側のウェッジ構造をブレイクしました。70(安値)を維持している限り、上方向への動きの可能性があります。83と93のレジスタンス水準を監視してください。私が矢印で示した動きに沿うなら、逆ヘッドアンドショルダー(H&S)パターンが形成されるでしょう。青いボックスがブレイクされ、その上で価格が定着した場合、117〜146のレジスタンス水準をテストする可能性があります。
58
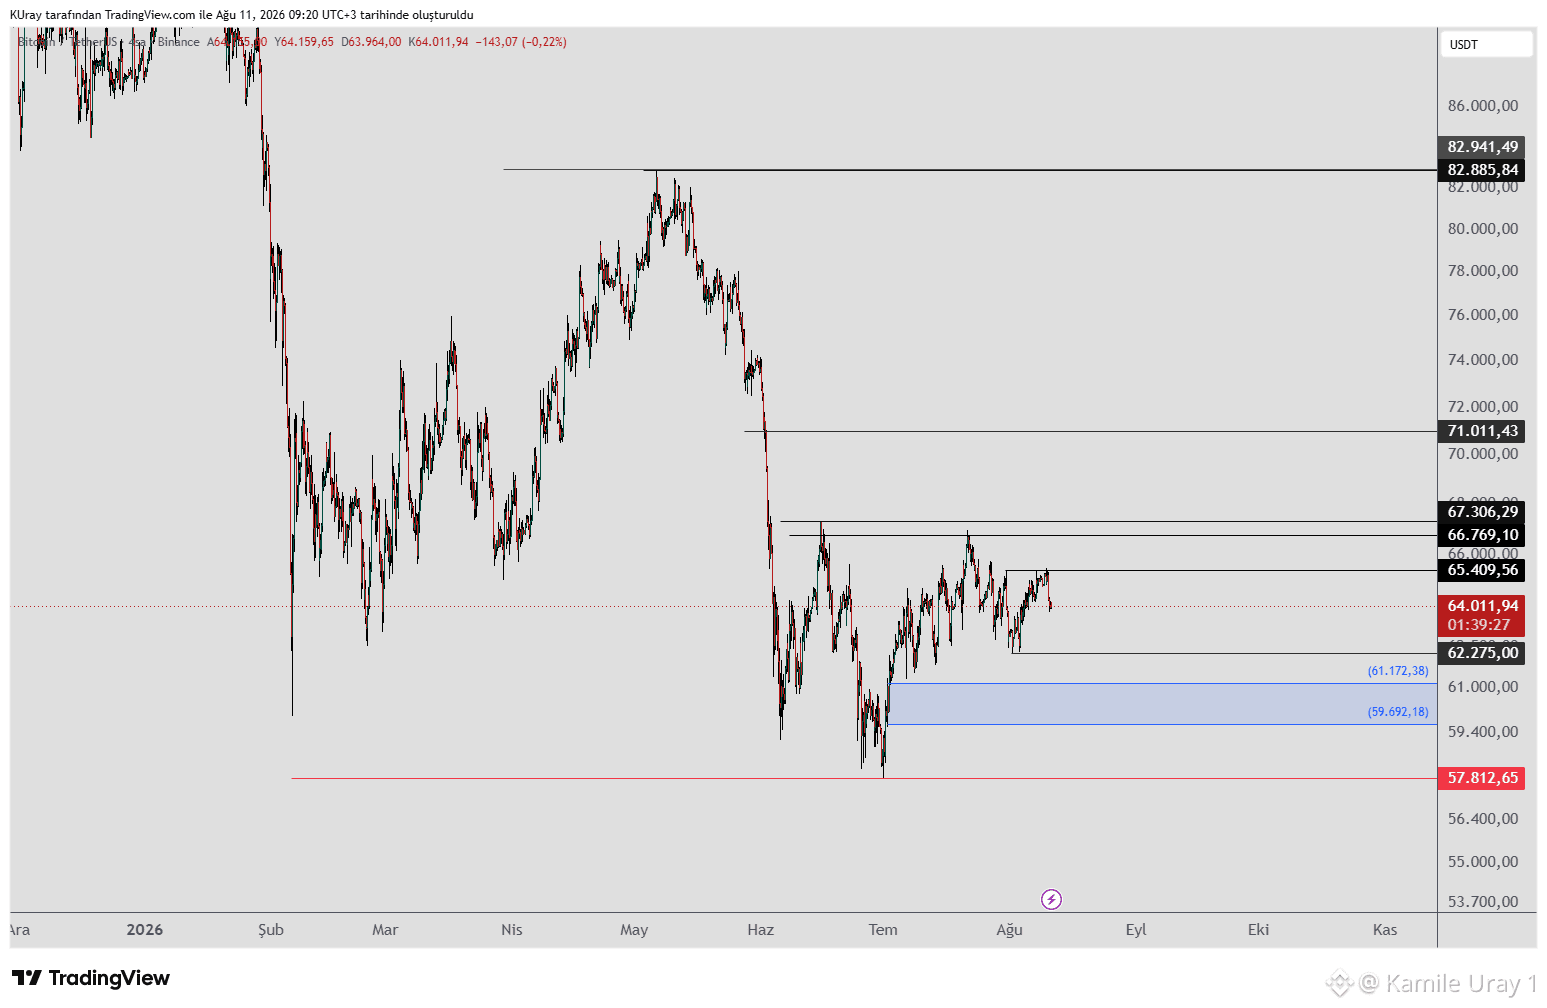
#BTC 62,275の水準を上回って推移していれば、強気シナリオは維持されます。65,409を上回る終値が出た場合、逆ヘッド・アンド・ショルダー(H&S)パターンの「肩」が完成する可能性があります。67,000を上回る終値ならパターンが発動し、上昇トレンドの継続が見込まれます。
67,000を維持していれば、71,000、75,000、82,885といったレジスタンス水準のテストが行われる可能性があります。
日足と週足の両方で82,885を上回る終値が確認されれば、直近の下落局面に対して最初の高値更新となります。これは、上昇トレンドが継続する可能性が高いという前向きなシグナルです。
4時間足で65,409を上回って終われない場合、下落につながる恐れがあります。62,275を下回る終値が出ると、直近の上昇を下落トレンド内での単なる戻り(コレクティブなバウンス)として再分類することになり、下落の継続が見込まれます。
下落局面では、59,000〜61,000のレンジがサポートゾーンとして機能します(0.618〜0.786のフィボナッチ水準と一致)。ここは買い手が入ってくる可能性がある領域で、価格がこの水準を維持できれば、もう一度上方向への動きを試す展開が続くかもしれません。
下落がさらに深まり、週足の終値が57,000を下回る場合、価格は49,000〜50,000の範囲にあるサポート水準をテストする可能性があります。
#BTC 62,275の水準を上回って推移していれば、強気シナリオは維持されます。65,409を上回る終値が出た場合、逆ヘッド・アンド・ショルダー(H&S)パターンの「肩」が完成する可能性があります。67,000を上回る終値ならパターンが発動し、上昇トレンドの継続が見込まれます。
67,000を維持していれば、71,000、75,000、82,885といったレジスタンス水準のテストが行われる可能性があります。
日足と週足の両方で82,885を上回る終値が確認されれば、直近の下落局面に対して最初の高値更新となります。これは、上昇トレンドが継続する可能性が高いという前向きなシグナルです。
4時間足で65,409を上回って終われない場合、下落につながる恐れがあります。62,275を下回る終値が出ると、直近の上昇を下落トレンド内での単なる戻り(コレクティブなバウンス)として再分類することになり、下落の継続が見込まれます。
下落局面では、59,000〜61,000のレンジがサポートゾーンとして機能します(0.618〜0.786のフィボナッチ水準と一致)。ここは買い手が入ってくる可能性がある領域で、価格がこの水準を維持できれば、もう一度上方向への動きを試す展開が続くかもしれません。
下落がさらに深まり、週足の終値が57,000を下回る場合、価格は49,000〜50,000の範囲にあるサポート水準をテストする可能性があります。
67,000を維持していれば、71,000、75,000、82,885といったレジスタンス水準のテストが行われる可能性があります。
日足と週足の両方で82,885を上回る終値が確認されれば、直近の下落局面に対して最初の高値更新となります。これは、上昇トレンドが継続する可能性が高いという前向きなシグナルです。
4時間足で65,409を上回って終われない場合、下落につながる恐れがあります。62,275を下回る終値が出ると、直近の上昇を下落トレンド内での単なる戻り(コレクティブなバウンス)として再分類することになり、下落の継続が見込まれます。
下落局面では、59,000〜61,000のレンジがサポートゾーンとして機能します(0.618〜0.786のフィボナッチ水準と一致)。ここは買い手が入ってくる可能性がある領域で、価格がこの水準を維持できれば、もう一度上方向への動きを試す展開が続くかもしれません。
下落がさらに深まり、週足の終値が57,000を下回る場合、価格は49,000〜50,000の範囲にあるサポート水準をテストする可能性があります。
77
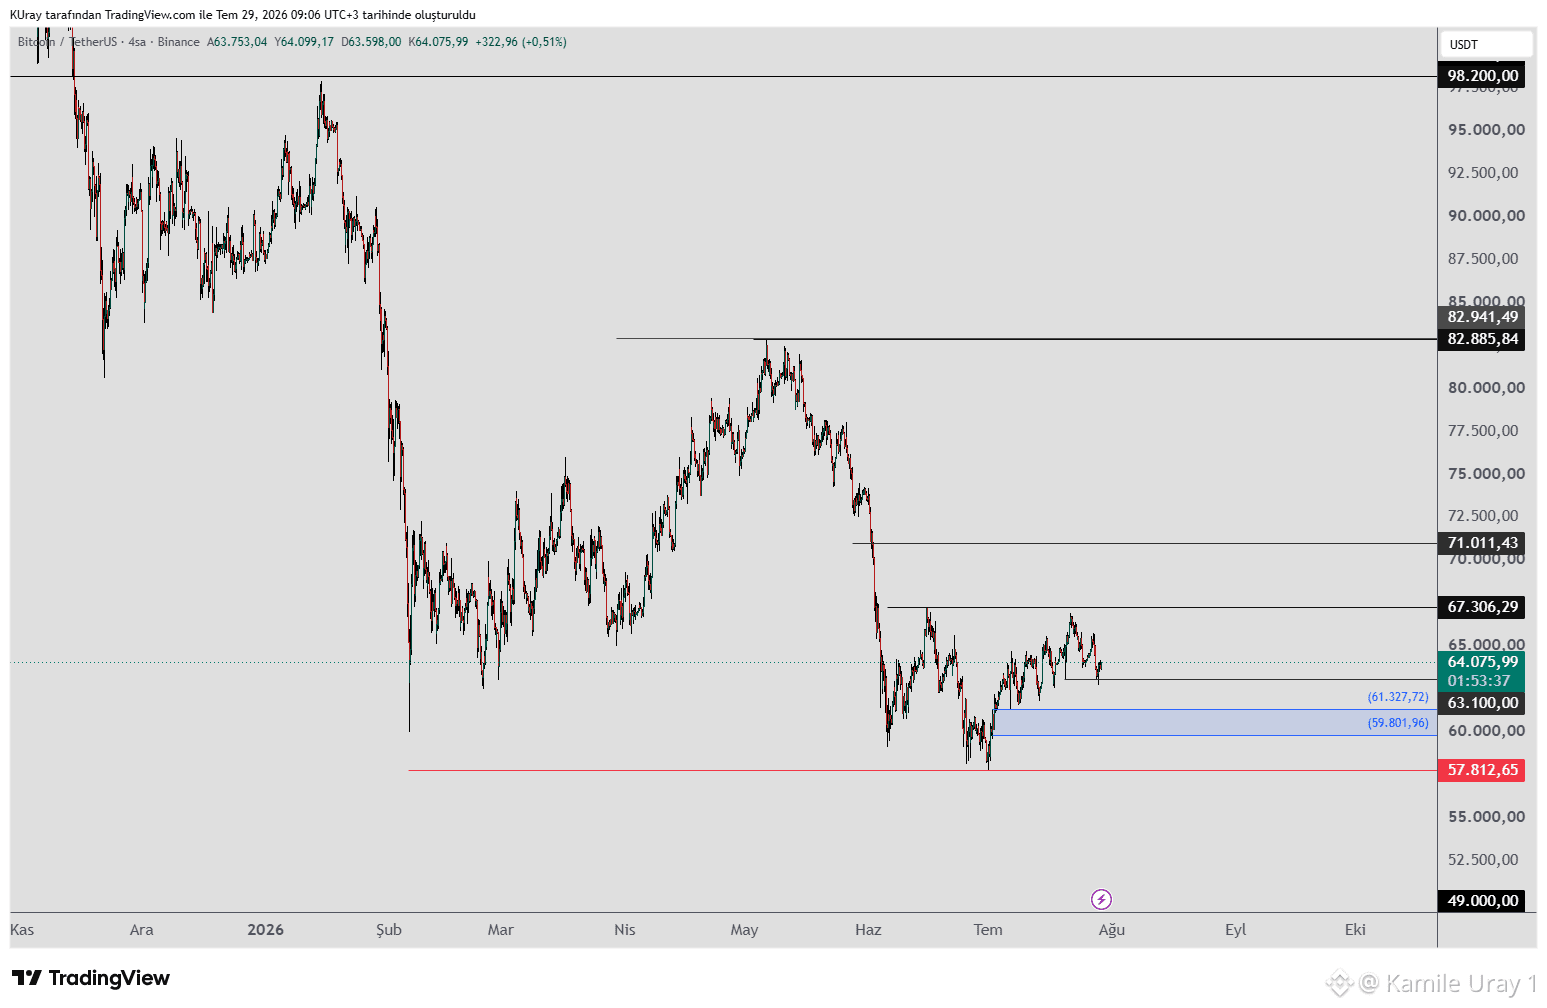
#BTC は 63,100 の水準を維持しており、67,500 のレジスタンスに向けた上方向の動きが継続する可能性があります。このレジスタンスを上回る位置で維持できれば、71,000、75,000、そして 82,885 の各レジスタンス水準を試しにいく可能性があります。
日足または週足で 82,885 を上回って終値がつく場合、直近の下落局面に対する「最初の切り上げ高値」を示すことになり得ます。これは、上昇トレンドが継続しそうだという前向きなシグナルとして機能します。
もし 63,100 を下回る場合、59,000〜61,000 のレンジがフィボナッチのサポート・ゾーンとして働きます。この水準を維持できれば、再度上方向への動きを試すことがあり得ます。
下落が続き、週足の終値が 57,000 を下回ると、下落トレンドの継続する可能性が高まり、49,000〜50,000 のサポート水準に向けて下落する可能性があります。
#BTC は 63,100 の水準を維持しており、67,500 のレジスタンスに向けた上方向の動きが継続する可能性があります。このレジスタンスを上回る位置で維持できれば、71,000、75,000、そして 82,885 の各レジスタンス水準を試しにいく可能性があります。
日足または週足で 82,885 を上回って終値がつく場合、直近の下落局面に対する「最初の切り上げ高値」を示すことになり得ます。これは、上昇トレンドが継続しそうだという前向きなシグナルとして機能します。
もし 63,100 を下回る場合、59,000〜61,000 のレンジがフィボナッチのサポート・ゾーンとして働きます。この水準を維持できれば、再度上方向への動きを試すことがあり得ます。
下落が続き、週足の終値が 57,000 を下回ると、下落トレンドの継続する可能性が高まり、49,000〜50,000 のサポート水準に向けて下落する可能性があります。
日足または週足で 82,885 を上回って終値がつく場合、直近の下落局面に対する「最初の切り上げ高値」を示すことになり得ます。これは、上昇トレンドが継続しそうだという前向きなシグナルとして機能します。
もし 63,100 を下回る場合、59,000〜61,000 のレンジがフィボナッチのサポート・ゾーンとして働きます。この水準を維持できれば、再度上方向への動きを試すことがあり得ます。
下落が続き、週足の終値が 57,000 を下回ると、下落トレンドの継続する可能性が高まり、49,000〜50,000 のサポート水準に向けて下落する可能性があります。
70
ログインして、さらにコンテンツを読む
厳選トピックで世界の暗号資産トレーダーの仲間入り
⚡️ 暗号資産に関する最新かつ有益な情報が見つかります。
💬 世界最大の暗号資産取引所から信頼されています。
👍 認証を受けたクリエイターから、有益なインサイトを得られます。
メール / 電話番号