

Badsha Bilal
66 投稿

Badsha Bilal
取引を発注
高頻度トレーダー
3.4年
5 フォロー
2 フォロワー
49 いいね
投稿
ポートフォリオ
すべて
引用

翻訳参照
Badsha Bilal
·
--
BTC/USDT Technical Analysis: Bulls Defend the Trend as Bitcoin Tests Key Resistance
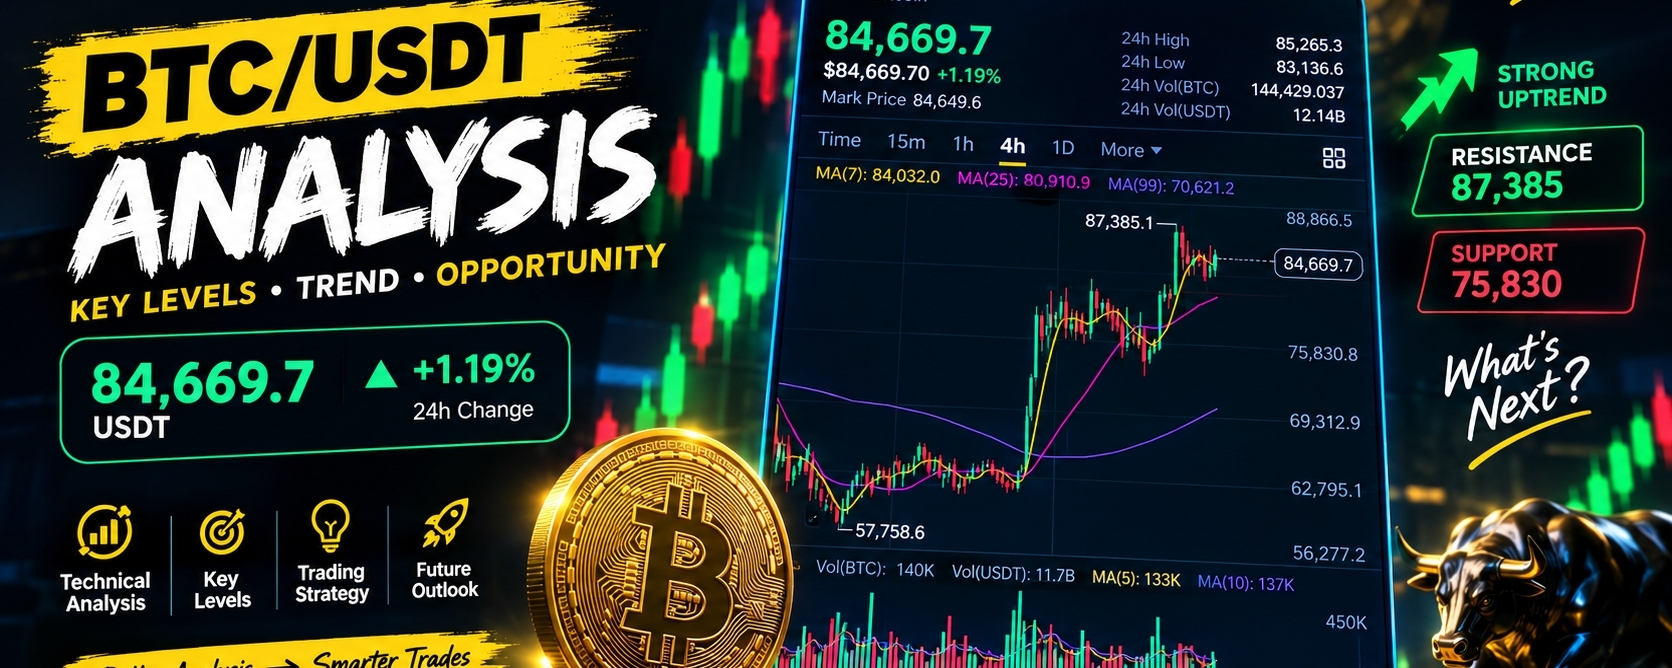
BTC/USDT is trading around $84,670, up roughly 1.19% over the last 24 hours at the time of this analysis. After a strong recovery from the September lows, Bitcoin is now consolidating below the important $85,000–$87,385 resistance zone.
📊 Market Structure
The higher-timeframe structure remains constructive:
Current price: ~$84,670
24H high: ~$85,265
24H low: ~$83,137
Major resistance: ~$87,385
Near-term support: ~$83,100–$82,500
Stronger support: ~$80,000
Longer-term support: ~$75,800
On the 4H chart, BTC is trading above the 7, 25, and 99 moving averages, which shows that the broader trend is still supported by the current structure.
🔥 The Key Level: $87,385
The previous high around $87,385 is the most important resistance visible on the chart.
A decisive move above this area, particularly if accompanied by increasing volume, could indicate that buyers are attempting to continue the broader upward move.
However, repeated rejection around resistance would keep BTC inside the current consolidation range and could lead to another pullback toward the lower support areas.
📈 1H Momentum
The 1H chart shows BTC recovering from the $82,700 area and moving back above its short-term moving averages.
The important short-term levels are approximately:
Resistance: $85,100 → $85,600 → $87,385
Support: $84,000 → $83,200 → $82,700
The market is therefore sitting near a decision zone where confirmation is more important than chasing a move.
🧠 Trading Perspective
Rather than assuming that Bitcoin must immediately break upward or downward, traders can watch how price behaves around the key levels.
Bullish scenario:
BTC holds above the $84K area, breaks $85.6K with strong volume, and eventually challenges $87.4K.
Bearish scenario:
BTC repeatedly fails to break resistance and loses $83.1K–$82.7K, increasing the possibility of a deeper retracement.
⚠️ Risk Management
Technical indicators are not guarantees. BTC can make sharp moves in either direction, especially in perpetual futures.
For leveraged positions, position size, stop-loss placement, and liquidation distance are important. A breakout should ideally be confirmed by price action + volume, rather than relying on one indicator alone.
🎯 Final Takeaway
Bitcoin remains in a strong recovery structure, but the $87,385 resistance is the major level to watch. Until that resistance is convincingly broken, the market can continue moving sideways between support and resistance.
Key levels to watch:
🟢 $87,385 — Major resistance
🟢 $85,600 — Near-term breakout area
🟡 $84,000 — Short-term pivot
🔴 $83,100–$82,700 — Important support zone
🔴 $80,000 — Deeper support
Trade the confirmation, not the emotion. 📊
#Bitcoin #BTC #BTCUSDT #CryptoTrading #BinanceSquare #TechnicalAnalysis #BitcoinAnalysis #Crypto #TradingStrategy #BTCAnalysis $BTC
📊 Market Structure
The higher-timeframe structure remains constructive:
Current price: ~$84,670
24H high: ~$85,265
24H low: ~$83,137
Major resistance: ~$87,385
Near-term support: ~$83,100–$82,500
Stronger support: ~$80,000
Longer-term support: ~$75,800
On the 4H chart, BTC is trading above the 7, 25, and 99 moving averages, which shows that the broader trend is still supported by the current structure.
🔥 The Key Level: $87,385
The previous high around $87,385 is the most important resistance visible on the chart.
A decisive move above this area, particularly if accompanied by increasing volume, could indicate that buyers are attempting to continue the broader upward move.
However, repeated rejection around resistance would keep BTC inside the current consolidation range and could lead to another pullback toward the lower support areas.
📈 1H Momentum
The 1H chart shows BTC recovering from the $82,700 area and moving back above its short-term moving averages.
The important short-term levels are approximately:
Resistance: $85,100 → $85,600 → $87,385
Support: $84,000 → $83,200 → $82,700
The market is therefore sitting near a decision zone where confirmation is more important than chasing a move.
🧠 Trading Perspective
Rather than assuming that Bitcoin must immediately break upward or downward, traders can watch how price behaves around the key levels.
Bullish scenario:
BTC holds above the $84K area, breaks $85.6K with strong volume, and eventually challenges $87.4K.
Bearish scenario:
BTC repeatedly fails to break resistance and loses $83.1K–$82.7K, increasing the possibility of a deeper retracement.
⚠️ Risk Management
Technical indicators are not guarantees. BTC can make sharp moves in either direction, especially in perpetual futures.
For leveraged positions, position size, stop-loss placement, and liquidation distance are important. A breakout should ideally be confirmed by price action + volume, rather than relying on one indicator alone.
🎯 Final Takeaway
Bitcoin remains in a strong recovery structure, but the $87,385 resistance is the major level to watch. Until that resistance is convincingly broken, the market can continue moving sideways between support and resistance.
Key levels to watch:
🟢 $87,385 — Major resistance
🟢 $85,600 — Near-term breakout area
🟡 $84,000 — Short-term pivot
🔴 $83,100–$82,700 — Important support zone
🔴 $80,000 — Deeper support
Trade the confirmation, not the emotion. 📊
#Bitcoin #BTC #BTCUSDT #CryptoTrading #BinanceSquare #TechnicalAnalysis #BitcoinAnalysis #Crypto #TradingStrategy #BTCAnalysis $BTC
翻訳参照


风哥不吹牛
·
--
実はほとんどの人が左右に揺れ動いていて、なにか一つのことをしっかりと決めてやり切ることができない。僕にも、利確して手堅く得を持ち帰る喜びや興奮があるし、さらに一発でトラフィックを爆発させて配信の準備もする必要がある。けれど、故郷の土地に足を踏み入れるあの安らぎと平穏もあって……実はこうして見ると、僕もけっこうカッコいい。寝る。

ログインして、さらにコンテンツを読む