
Sir Ismail 1
108 投稿

Sir Ismail 1
報告
ユーザーをブロック
Digital Assets Content | Think Macro| Currently working with projects; $NAKA $AGATA $DIA $VETME
0 フォロー
2 フォロワー
13 いいね
投稿
·
--
翻訳参照
DIA had a strong week focused on stablecoin transparency, expanding its Global Stablecoin Map across 6+ issuers while highlighting the significant gap between euro FX turnover (14.5%) and its share of stablecoin supply (around 0.25%).
The updates reinforce an important point: stablecoin research must go beyond supply figures to examine chain distribution, peg stability, holders, and actual DeFi usage.
The next milestone is seeing whether risk teams, DeFi curators, and lending protocols turn this data into better decisions.
Explore the Global Stablecoin Map and follow how DIA is turning transparent data into practical DeFi infrastructure. $DIA
DIA had a strong week focused on stablecoin transparency, expanding its Global Stablecoin Map across 6+ issuers while highlighting the significant gap between euro FX turnover (14.5%) and its share of stablecoin supply (around 0.25%).
The updates reinforce an important point: stablecoin research must go beyond supply figures to examine chain distribution, peg stability, holders, and actual DeFi usage.
The next milestone is seeing whether risk teams, DeFi curators, and lending protocols turn this data into better decisions.
Explore the Global Stablecoin Map and follow how DIA is turning transparent data into practical DeFi infrastructure. $DIA
The updates reinforce an important point: stablecoin research must go beyond supply figures to examine chain distribution, peg stability, holders, and actual DeFi usage.
The next milestone is seeing whether risk teams, DeFi curators, and lending protocols turn this data into better decisions.
Explore the Global Stablecoin Map and follow how DIA is turning transparent data into practical DeFi infrastructure. $DIA
70
·
--
翻訳参照
Latin America’s stablecoin story reveals something interesting.
When local currencies lose value, people don’t necessarily look for a digital version of their own currency.
They look for dollars.
DIA’s October 2026 research highlights this clearly:
Argentina received $93.9 billion in crypto value over the 12 months to June 2025.
Yet its local-currency stablecoin supply was only $19.9 million as of October 2026.
That’s a huge difference.
The report finds a similar pattern across the region: demand is largely focused on dollar-linked stablecoins, which people use to preserve dollar exposure and access global markets.
Brazil offers an interesting contrast. Its local-currency stablecoin market has grown around PIX, the country’s instant payment system.
The bigger lesson?
Stablecoin adoption is not simply about putting local currencies onchain. It’s about understanding what people actually need: access to dollars, easier payments and useful financial infrastructure.
Latin America shows why looking beyond market cap matters.
What do you think will drive the next stage of stablecoin adoption in the region: dollar access, local payment systems or clearer regulation?
Explore the full research 👇
https://www.diadata.org/map/global-stablecoins/report/
@DIAdata_org
Latin America’s stablecoin story reveals something interesting.
When local currencies lose value, people don’t necessarily look for a digital version of their own currency.
They look for dollars.
DIA’s October 2026 research highlights this clearly:
Argentina received $93.9 billion in crypto value over the 12 months to June 2025.
Yet its local-currency stablecoin supply was only $19.9 million as of October 2026.
That’s a huge difference.
The report finds a similar pattern across the region: demand is largely focused on dollar-linked stablecoins, which people use to preserve dollar exposure and access global markets.
Brazil offers an interesting contrast. Its local-currency stablecoin market has grown around PIX, the country’s instant payment system.
The bigger lesson?
Stablecoin adoption is not simply about putting local currencies onchain. It’s about understanding what people actually need: access to dollars, easier payments and useful financial infrastructure.
Latin America shows why looking beyond market cap matters.
What do you think will drive the next stage of stablecoin adoption in the region: dollar access, local payment systems or clearer regulation?
Explore the full research 👇
https://www.diadata.org/map/global-stablecoins/report/
@DIAdata_org
When local currencies lose value, people don’t necessarily look for a digital version of their own currency.
They look for dollars.
DIA’s October 2026 research highlights this clearly:
Argentina received $93.9 billion in crypto value over the 12 months to June 2025.
Yet its local-currency stablecoin supply was only $19.9 million as of October 2026.
That’s a huge difference.
The report finds a similar pattern across the region: demand is largely focused on dollar-linked stablecoins, which people use to preserve dollar exposure and access global markets.
Brazil offers an interesting contrast. Its local-currency stablecoin market has grown around PIX, the country’s instant payment system.
The bigger lesson?
Stablecoin adoption is not simply about putting local currencies onchain. It’s about understanding what people actually need: access to dollars, easier payments and useful financial infrastructure.
Latin America shows why looking beyond market cap matters.
What do you think will drive the next stage of stablecoin adoption in the region: dollar access, local payment systems or clearer regulation?
Explore the full research 👇
https://www.diadata.org/map/global-stablecoins/report/
@DIAdata_org
61
·
--
翻訳参照
Did you know that most stablecoin dashboards stop at market cap.
DIA’s Global Stablecoin Map tracks the actual picture:
→ On-chain supply reads
→ Peg history
→ Chain coverage (native vs bridged)
→ Which lending markets actually use the coin
→ Regional breakdowns
146 active stablecoins across 25 currencies right now.
Dollar still ~$285B and Non-USD sitting around $1.7B — mostly in specific local markets.
This is really useful if you care about more than just USDT/USDC size imo.
https://www.diadata.org/map/global-stablecoins/
Did you know that most stablecoin dashboards stop at market cap.
DIA’s Global Stablecoin Map tracks the actual picture:
→ On-chain supply reads
→ Peg history
→ Chain coverage (native vs bridged)
→ Which lending markets actually use the coin
→ Regional breakdowns
146 active stablecoins across 25 currencies right now.
Dollar still ~$285B and Non-USD sitting around $1.7B — mostly in specific local markets.
This is really useful if you care about more than just USDT/USDC size imo.
https://www.diadata.org/map/global-stablecoins/
DIA’s Global Stablecoin Map tracks the actual picture:
→ On-chain supply reads
→ Peg history
→ Chain coverage (native vs bridged)
→ Which lending markets actually use the coin
→ Regional breakdowns
146 active stablecoins across 25 currencies right now.
Dollar still ~$285B and Non-USD sitting around $1.7B — mostly in specific local markets.
This is really useful if you care about more than just USDT/USDC size imo.
https://www.diadata.org/map/global-stablecoins/
74
·
--
翻訳参照
Asia’s stablecoin story has an interesting twist.
You might expect countries like South Korea and Japan to drive demand for their own local-currency stablecoins but the reality is more complicated.
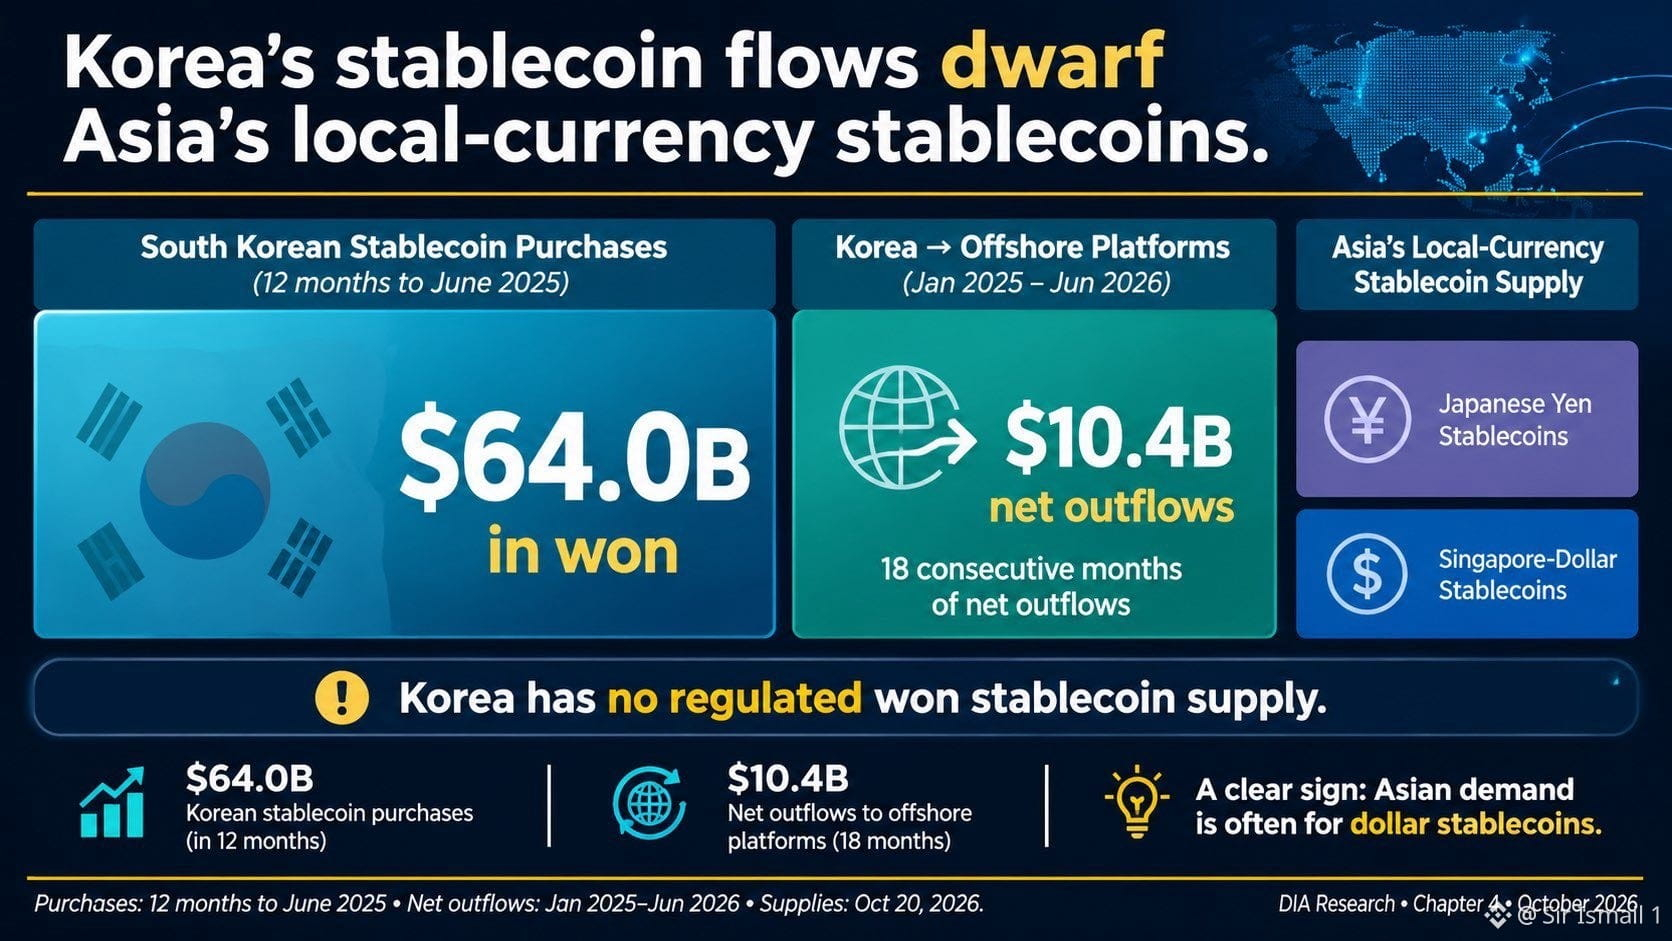
According to DIA’s October 2026 research, South Korean investors moved $10.4 billion in net stablecoin outflows to offshore platforms between January 2025 and June 2026.
Why?
Access to global crypto markets and dollar-denominated products is a major part of the story.
Meanwhile, South Korea still has no regulated won stablecoin supply.
This tells us something important:
People don’t always use the stablecoin linked to their local currency. They use the one that gives them access to the markets and services they need.
Stablecoin adoption is not just about issuing tokens. It’s also about demand, access and real-world use.
Explore the Asia findings in DIA’s research 👇
diadata.org/map/global-sta…
@DIAdata_org
Asia’s stablecoin story has an interesting twist.
You might expect countries like South Korea and Japan to drive demand for their own local-currency stablecoins but the reality is more complicated.
According to DIA’s October 2026 research, South Korean investors moved $10.4 billion in net stablecoin outflows to offshore platforms between January 2025 and June 2026.
Why?
Access to global crypto markets and dollar-denominated products is a major part of the story.
Meanwhile, South Korea still has no regulated won stablecoin supply.
This tells us something important:
People don’t always use the stablecoin linked to their local currency. They use the one that gives them access to the markets and services they need.
Stablecoin adoption is not just about issuing tokens. It’s also about demand, access and real-world use.
Explore the Asia findings in DIA’s research 👇
diadata.org/map/global-sta…
@DIAdata_org
You might expect countries like South Korea and Japan to drive demand for their own local-currency stablecoins but the reality is more complicated.
According to DIA’s October 2026 research, South Korean investors moved $10.4 billion in net stablecoin outflows to offshore platforms between January 2025 and June 2026.
Why?
Access to global crypto markets and dollar-denominated products is a major part of the story.
Meanwhile, South Korea still has no regulated won stablecoin supply.
This tells us something important:
People don’t always use the stablecoin linked to their local currency. They use the one that gives them access to the markets and services they need.
Stablecoin adoption is not just about issuing tokens. It’s also about demand, access and real-world use.
Explore the Asia findings in DIA’s research 👇
diadata.org/map/global-sta…
@DIAdata_org
59
·
--
翻訳参照
Europe introduced a major regulatory framework for stablecoins.
But here’s the interesting part: regulation and adoption don’t always move at the same speed.
According to DIA’s October 2026 research:
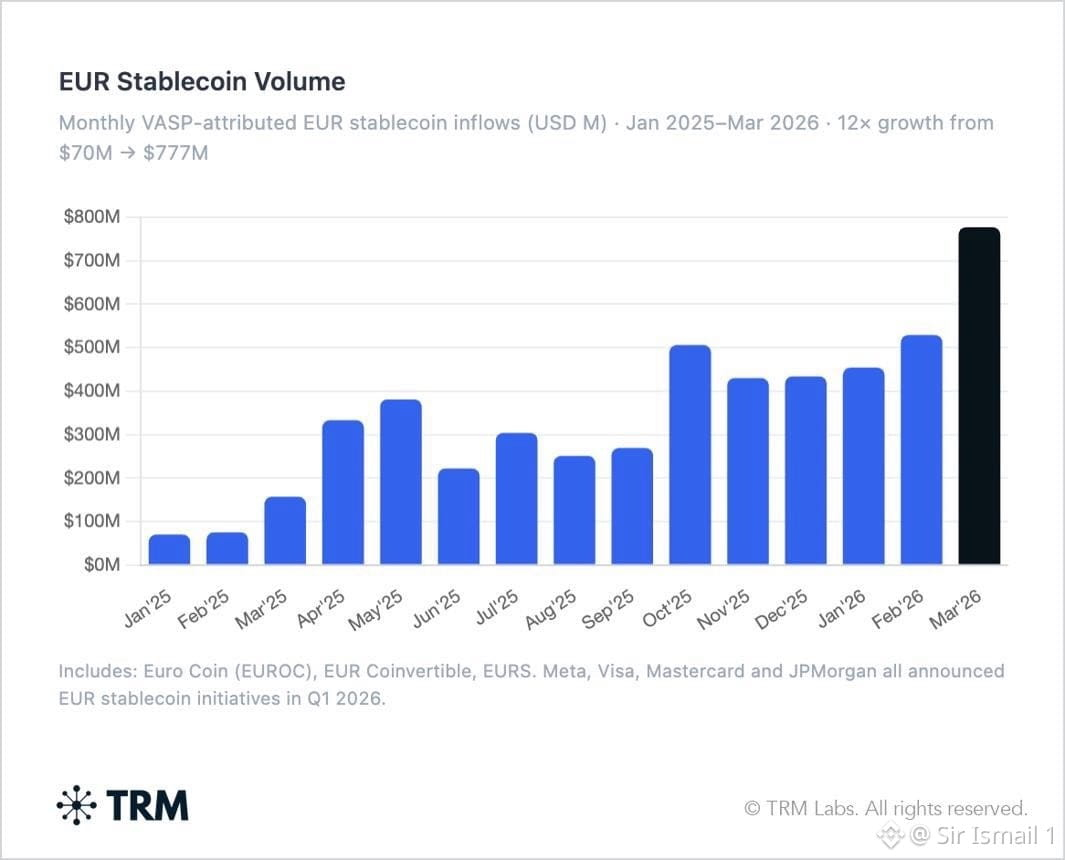
Euro stablecoin supply reached $790 million, growing 54% in one year and licensed issuers now account for 98% of euro stablecoin supply compared with just 27% in December 2023.
But there’s another side to the story.
During the USDT delisting period on European licensed platforms, global USDC supply grew by $20.5 billion while euro stablecoins added just $61 million.
The lesson?
A clearer regulatory framework can reshape who issues stablecoins without necessarily making local-currency stablecoins the preferred choice.
This is one of the findings worth exploring in DIA’s Global Stablecoin Map and research.
Read the report 👇
diadata.org/map/global-sta…
Europe introduced a major regulatory framework for stablecoins.
But here’s the interesting part: regulation and adoption don’t always move at the same speed.
According to DIA’s October 2026 research:
Euro stablecoin supply reached $790 million, growing 54% in one year and licensed issuers now account for 98% of euro stablecoin supply compared with just 27% in December 2023.
But there’s another side to the story.
During the USDT delisting period on European licensed platforms, global USDC supply grew by $20.5 billion while euro stablecoins added just $61 million.
The lesson?
A clearer regulatory framework can reshape who issues stablecoins without necessarily making local-currency stablecoins the preferred choice.
This is one of the findings worth exploring in DIA’s Global Stablecoin Map and research.
Read the report 👇
diadata.org/map/global-sta…
But here’s the interesting part: regulation and adoption don’t always move at the same speed.
According to DIA’s October 2026 research:
Euro stablecoin supply reached $790 million, growing 54% in one year and licensed issuers now account for 98% of euro stablecoin supply compared with just 27% in December 2023.
But there’s another side to the story.
During the USDT delisting period on European licensed platforms, global USDC supply grew by $20.5 billion while euro stablecoins added just $61 million.
The lesson?
A clearer regulatory framework can reshape who issues stablecoins without necessarily making local-currency stablecoins the preferred choice.
This is one of the findings worth exploring in DIA’s Global Stablecoin Map and research.
Read the report 👇
diadata.org/map/global-sta…
58
·
--
翻訳参照
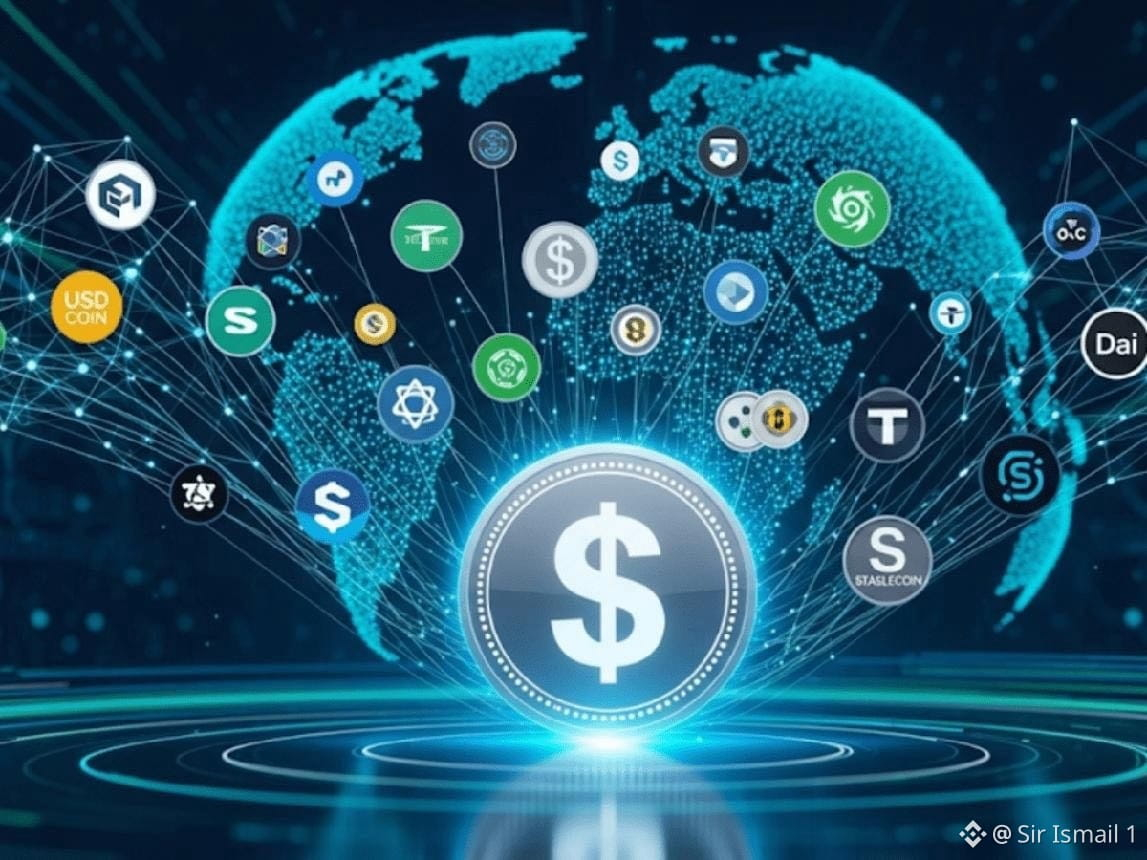
Two stablecoins can share the same peg and still be completely different products.
They can have different issuers, backing structures, regulatory positions, supported chains and real-world use cases.
That’s why knowing a stablecoin’s ticker and market cap isn’t enough.
You also need to understand the entity behind it.
DIA’s Global Stablecoin Map tracks 102 issuers across the market.
For anyone researching stablecoins, that’s a useful starting point.
Look beyond the ticker.
https://www.diadata.org/map/global-stablecoins/
Two stablecoins can share the same peg and still be completely different products.
They can have different issuers, backing structures, regulatory positions, supported chains and real-world use cases.
That’s why knowing a stablecoin’s ticker and market cap isn’t enough.
You also need to understand the entity behind it.
DIA’s Global Stablecoin Map tracks 102 issuers across the market.
For anyone researching stablecoins, that’s a useful starting point.
Look beyond the ticker.
https://www.diadata.org/map/global-stablecoins/
They can have different issuers, backing structures, regulatory positions, supported chains and real-world use cases.
That’s why knowing a stablecoin’s ticker and market cap isn’t enough.
You also need to understand the entity behind it.
DIA’s Global Stablecoin Map tracks 102 issuers across the market.
For anyone researching stablecoins, that’s a useful starting point.
Look beyond the ticker.
https://www.diadata.org/map/global-stablecoins/
63
·
--
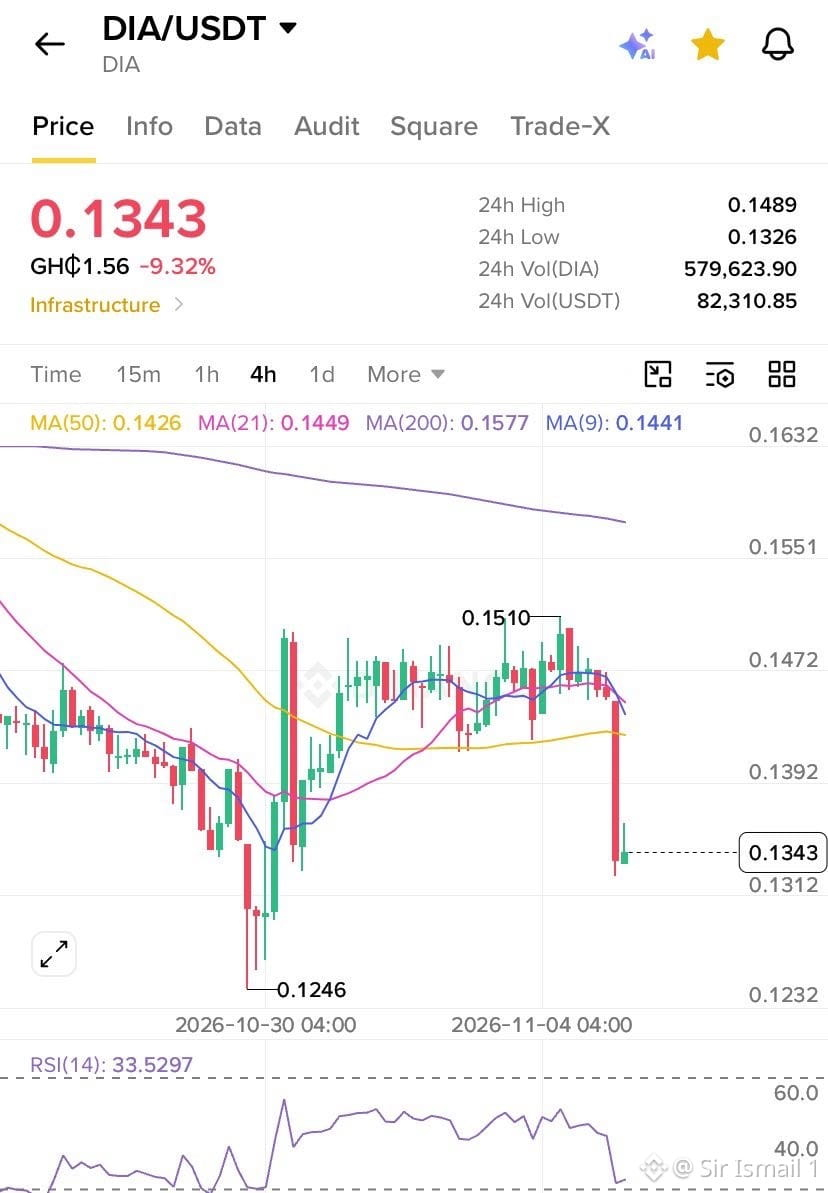
$DIAは4時間足チャートで大きく下落しました。
注目していた強気の構造は、大幅に弱まっています。
価格は現在約$0.1343で、9.32%下落し、主要な移動平均線をすべて下回っています。
注目しているポイントはこちらです。
売り圧力:価格は9 EMA($0.1441)、21 MA($0.1449)、50 MA($0.1426)、200 MA($0.1577)を下回っています。
RSI:33.5で、モメンタムは弱く、売られ過ぎの水準に近づいています。
重要なサポート:$0.131~$0.132。ここを割り込むと、$0.1246付近の直近のスイング安値が重要になります。
回復シナリオ:本格的な回復に向かうには、まず$0.139~$0.143を回復し、次に$0.145を取り戻す必要があります。
今のところ、主導権は売り手にあります。再び強気になる前に、買い手がサポートを守り、失った水準を回復するのを確認したいです。
これは回復前の流動性スイープでしょうか。それとも、もう一段の下落に向かっているのでしょうか?
4時間足のローソク足の確定を見守ります。
$DIAは4時間足チャートで大きく下落しました。
注目していた強気の構造は、大幅に弱まっています。
価格は現在約$0.1343で、9.32%下落し、主要な移動平均線をすべて下回っています。
注目しているポイントはこちらです。
売り圧力:価格は9 EMA($0.1441)、21 MA($0.1449)、50 MA($0.1426)、200 MA($0.1577)を下回っています。
RSI:33.5で、モメンタムは弱く、売られ過ぎの水準に近づいています。
重要なサポート:$0.131~$0.132。ここを割り込むと、$0.1246付近の直近のスイング安値が重要になります。
回復シナリオ:本格的な回復に向かうには、まず$0.139~$0.143を回復し、次に$0.145を取り戻す必要があります。
今のところ、主導権は売り手にあります。再び強気になる前に、買い手がサポートを守り、失った水準を回復するのを確認したいです。
これは回復前の流動性スイープでしょうか。それとも、もう一段の下落に向かっているのでしょうか?
4時間足のローソク足の確定を見守ります。
注目していた強気の構造は、大幅に弱まっています。
価格は現在約$0.1343で、9.32%下落し、主要な移動平均線をすべて下回っています。
注目しているポイントはこちらです。
売り圧力:価格は9 EMA($0.1441)、21 MA($0.1449)、50 MA($0.1426)、200 MA($0.1577)を下回っています。
RSI:33.5で、モメンタムは弱く、売られ過ぎの水準に近づいています。
重要なサポート:$0.131~$0.132。ここを割り込むと、$0.1246付近の直近のスイング安値が重要になります。
回復シナリオ:本格的な回復に向かうには、まず$0.139~$0.143を回復し、次に$0.145を取り戻す必要があります。
今のところ、主導権は売り手にあります。再び強気になる前に、買い手がサポートを守り、失った水準を回復するのを確認したいです。
これは回復前の流動性スイープでしょうか。それとも、もう一段の下落に向かっているのでしょうか?
4時間足のローソク足の確定を見守ります。
56
·
--
金曜日のひとこと!
ステーブルコインについて話すとき、誰もがUSDTとUSDCに注目します。
でも、最大手2つ以外で起きていることにも、十分目を向けているでしょうか?
ヨーロッパには、独自のステーブルコイン事情があります。
アジアでは、ドル建てステーブルコインへの需要が高まっています。
ラテンアメリカでは、普及を後押しする要因が異なります。
ステーブルコイン市場は、ひとつの物語ではありません。地域や通貨、規制によって、それぞれ異なる形で発展しています。
だからこそ、DIAの「グローバル・ステーブルコイン・マップ」を見てみる価値があります。
このマップでは、さまざまな市場を一か所に集め、ステーブルコインをめぐる状況がどのように変化しているのかを把握できます。
ここで、より大きな問いです。
私たちはステーブルコイン市場全体を見ているのでしょうか?それとも、すでに知っている部分だけでしょうか?
マップを見る 👇
https://www.diadata.org/map/global-stablecoins/
@DIAdata_org
金曜日のひとこと!
ステーブルコインについて話すとき、誰もがUSDTとUSDCに注目します。
でも、最大手2つ以外で起きていることにも、十分目を向けているでしょうか?
ヨーロッパには、独自のステーブルコイン事情があります。
アジアでは、ドル建てステーブルコインへの需要が高まっています。
ラテンアメリカでは、普及を後押しする要因が異なります。
ステーブルコイン市場は、ひとつの物語ではありません。地域や通貨、規制によって、それぞれ異なる形で発展しています。
だからこそ、DIAの「グローバル・ステーブルコイン・マップ」を見てみる価値があります。
このマップでは、さまざまな市場を一か所に集め、ステーブルコインをめぐる状況がどのように変化しているのかを把握できます。
ここで、より大きな問いです。
私たちはステーブルコイン市場全体を見ているのでしょうか?それとも、すでに知っている部分だけでしょうか?
マップを見る 👇
https://www.diadata.org/map/global-stablecoins/
@DIAdata_org
ステーブルコインについて話すとき、誰もがUSDTとUSDCに注目します。
でも、最大手2つ以外で起きていることにも、十分目を向けているでしょうか?
ヨーロッパには、独自のステーブルコイン事情があります。
アジアでは、ドル建てステーブルコインへの需要が高まっています。
ラテンアメリカでは、普及を後押しする要因が異なります。
ステーブルコイン市場は、ひとつの物語ではありません。地域や通貨、規制によって、それぞれ異なる形で発展しています。
だからこそ、DIAの「グローバル・ステーブルコイン・マップ」を見てみる価値があります。
このマップでは、さまざまな市場を一か所に集め、ステーブルコインをめぐる状況がどのように変化しているのかを把握できます。
ここで、より大きな問いです。
私たちはステーブルコイン市場全体を見ているのでしょうか?それとも、すでに知っている部分だけでしょうか?
マップを見る 👇
https://www.diadata.org/map/global-stablecoins/
@DIAdata_org
68
·
--
翻訳参照
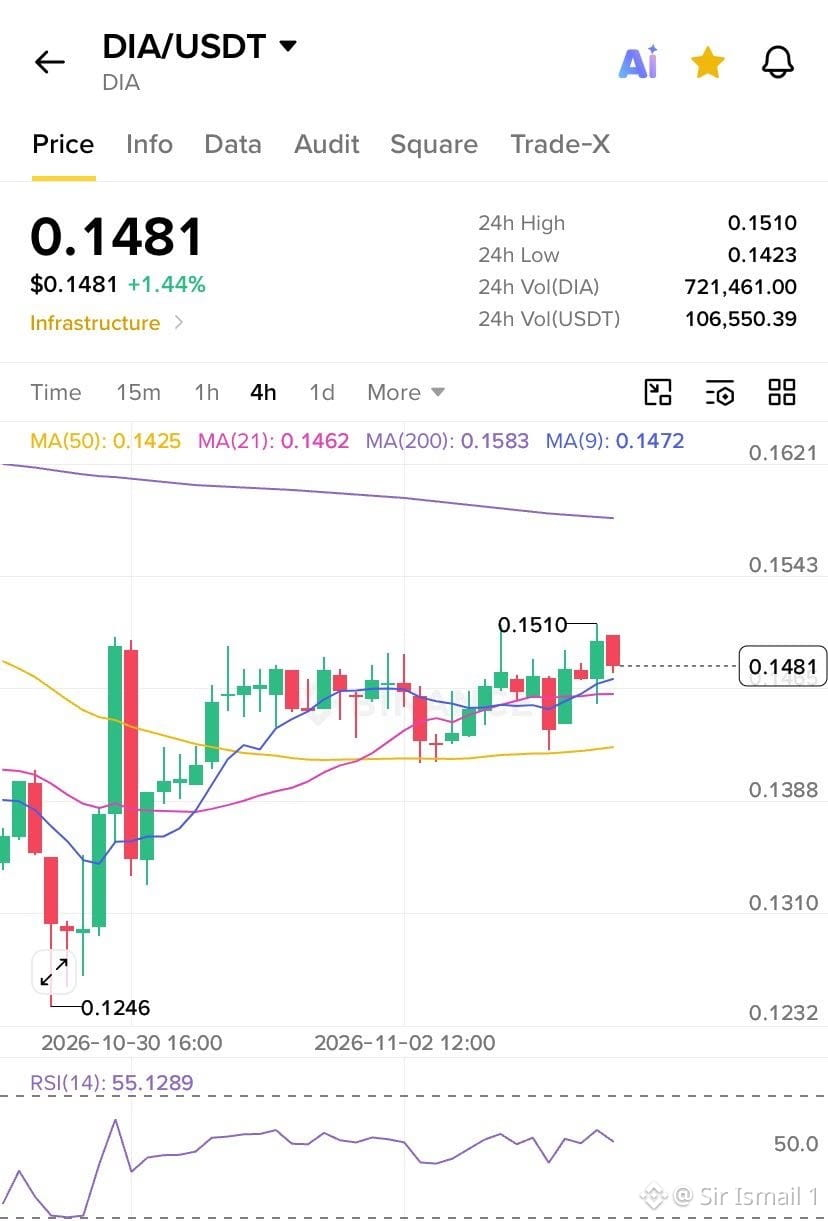
$DIA is back above three key moving averages and now bulls have one level to break: $0.151.
Key levels:
Resistance: $0.151, then $0.158
Support: $0.147, then $0.142
Hold above $0.147 and break $0.151 and that would put $0.158 in focus.
Lose $0.147 and price could revisit $0.142 with $0.138 as the next downside level.
The recovery is holding but bulls still need to clear the local high.
$0.151 is the continuation level. Watch how price reacts there.
$DIA is back above three key moving averages and now bulls have one level to break: $0.151.
Key levels:
Resistance: $0.151, then $0.158
Support: $0.147, then $0.142
Hold above $0.147 and break $0.151 and that would put $0.158 in focus.
Lose $0.147 and price could revisit $0.142 with $0.138 as the next downside level.
The recovery is holding but bulls still need to clear the local high.
$0.151 is the continuation level. Watch how price reacts there.
Key levels:
Resistance: $0.151, then $0.158
Support: $0.147, then $0.142
Hold above $0.147 and break $0.151 and that would put $0.158 in focus.
Lose $0.147 and price could revisit $0.142 with $0.138 as the next downside level.
The recovery is holding but bulls still need to clear the local high.
$0.151 is the continuation level. Watch how price reacts there.
73
·
--
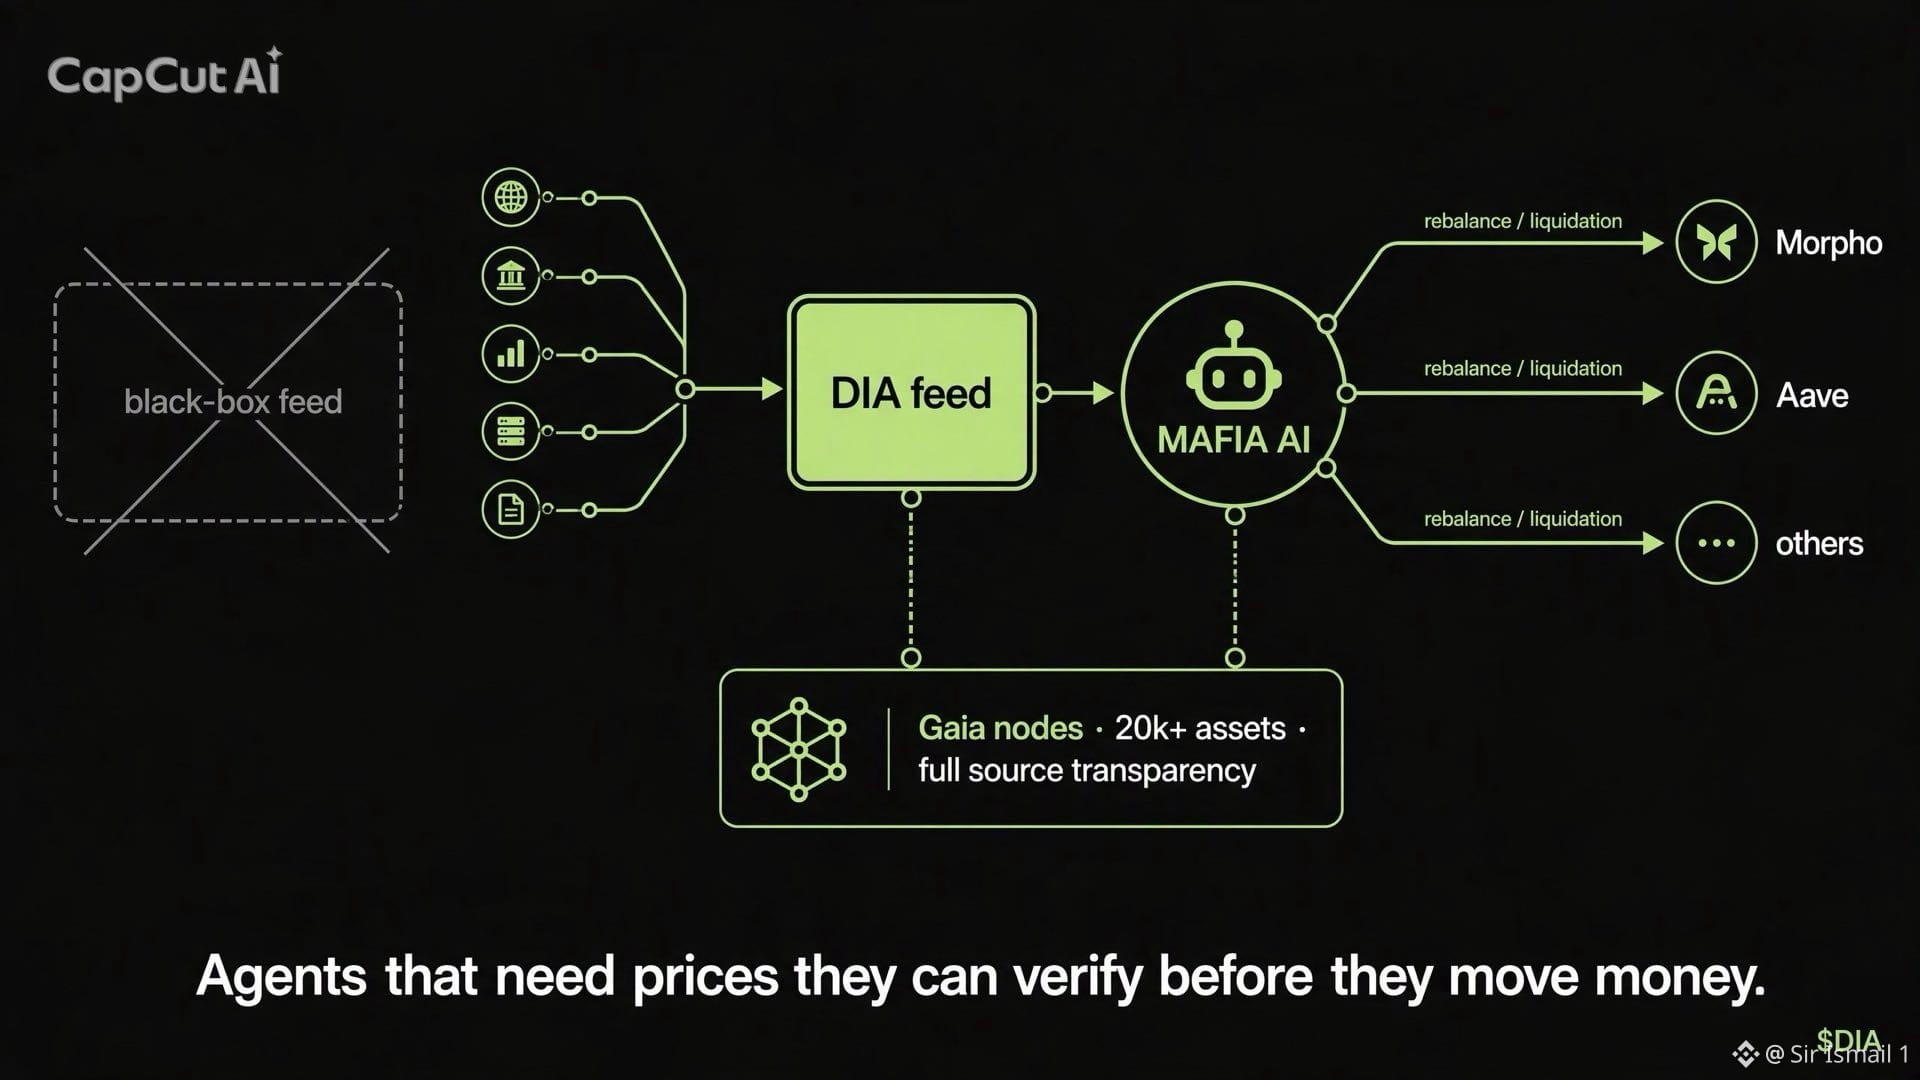
AIエージェントがDeFiで数百万ドルを管理するところを想像してみてください。
資金をいつ動かすか、ポジションを調整するか、ローンを清算するかを判断します。しかし、その判断の根拠となる価格データが間違っていたら、どうなるでしょうか?
AIエージェントの信頼性は、利用するデータの信頼性次第だということです。
だからこそ、オラクルは今も重要なのです。
DIAはすでにMAFIA AIに公式価格フィードを提供しています。MAFIA AIのエージェントは、ユーザーのリスク許容度や利回り目標に基づいて、MorphoやAaveなどのプロトコル間で資金を配分します。
リバランスや清算の判断はすべて、出所の説明がない価格フィードではなく、一次情報に基づく検証可能な価格データに依存しています。
さらに、
👉🏽Gaiaも、分散型AIノードを通じて、20,000以上の資産に関するDIAオラクルを利用しています。
つまり、エージェントは価格情報にアクセスできるだけでなく、データの出所をたどることもできます。
もっと広い視点で考えてみてください。
AIエージェントは自動で判断を下せますが、資金を動かす前には信頼できる情報が必要です。
AIと暗号資産を組み合わせるだけの話ではありません。AIエージェントが行動を起こす前に、検証でき、信頼できるデータを提供することが重要なのです。
自律型金融の未来において、DIAが活躍するのはまさにそこです。個人的には、今まさに$DIAの買い増しが進んでいると思います。
強気でいきましょう!
AIエージェントがDeFiで数百万ドルを管理するところを想像してみてください。
資金をいつ動かすか、ポジションを調整するか、ローンを清算するかを判断します。しかし、その判断の根拠となる価格データが間違っていたら、どうなるでしょうか?
AIエージェントの信頼性は、利用するデータの信頼性次第だということです。
だからこそ、オラクルは今も重要なのです。
DIAはすでにMAFIA AIに公式価格フィードを提供しています。MAFIA AIのエージェントは、ユーザーのリスク許容度や利回り目標に基づいて、MorphoやAaveなどのプロトコル間で資金を配分します。
リバランスや清算の判断はすべて、出所の説明がない価格フィードではなく、一次情報に基づく検証可能な価格データに依存しています。
さらに、
👉🏽Gaiaも、分散型AIノードを通じて、20,000以上の資産に関するDIAオラクルを利用しています。
つまり、エージェントは価格情報にアクセスできるだけでなく、データの出所をたどることもできます。
もっと広い視点で考えてみてください。
AIエージェントは自動で判断を下せますが、資金を動かす前には信頼できる情報が必要です。
AIと暗号資産を組み合わせるだけの話ではありません。AIエージェントが行動を起こす前に、検証でき、信頼できるデータを提供することが重要なのです。
自律型金融の未来において、DIAが活躍するのはまさにそこです。個人的には、今まさに$DIAの買い増しが進んでいると思います。
強気でいきましょう!
資金をいつ動かすか、ポジションを調整するか、ローンを清算するかを判断します。しかし、その判断の根拠となる価格データが間違っていたら、どうなるでしょうか?
AIエージェントの信頼性は、利用するデータの信頼性次第だということです。
だからこそ、オラクルは今も重要なのです。
DIAはすでにMAFIA AIに公式価格フィードを提供しています。MAFIA AIのエージェントは、ユーザーのリスク許容度や利回り目標に基づいて、MorphoやAaveなどのプロトコル間で資金を配分します。
リバランスや清算の判断はすべて、出所の説明がない価格フィードではなく、一次情報に基づく検証可能な価格データに依存しています。
さらに、
👉🏽Gaiaも、分散型AIノードを通じて、20,000以上の資産に関するDIAオラクルを利用しています。
つまり、エージェントは価格情報にアクセスできるだけでなく、データの出所をたどることもできます。
もっと広い視点で考えてみてください。
AIエージェントは自動で判断を下せますが、資金を動かす前には信頼できる情報が必要です。
AIと暗号資産を組み合わせるだけの話ではありません。AIエージェントが行動を起こす前に、検証でき、信頼できるデータを提供することが重要なのです。
自律型金融の未来において、DIAが活躍するのはまさにそこです。個人的には、今まさに$DIAの買い増しが進んでいると思います。
強気でいきましょう!
·
--
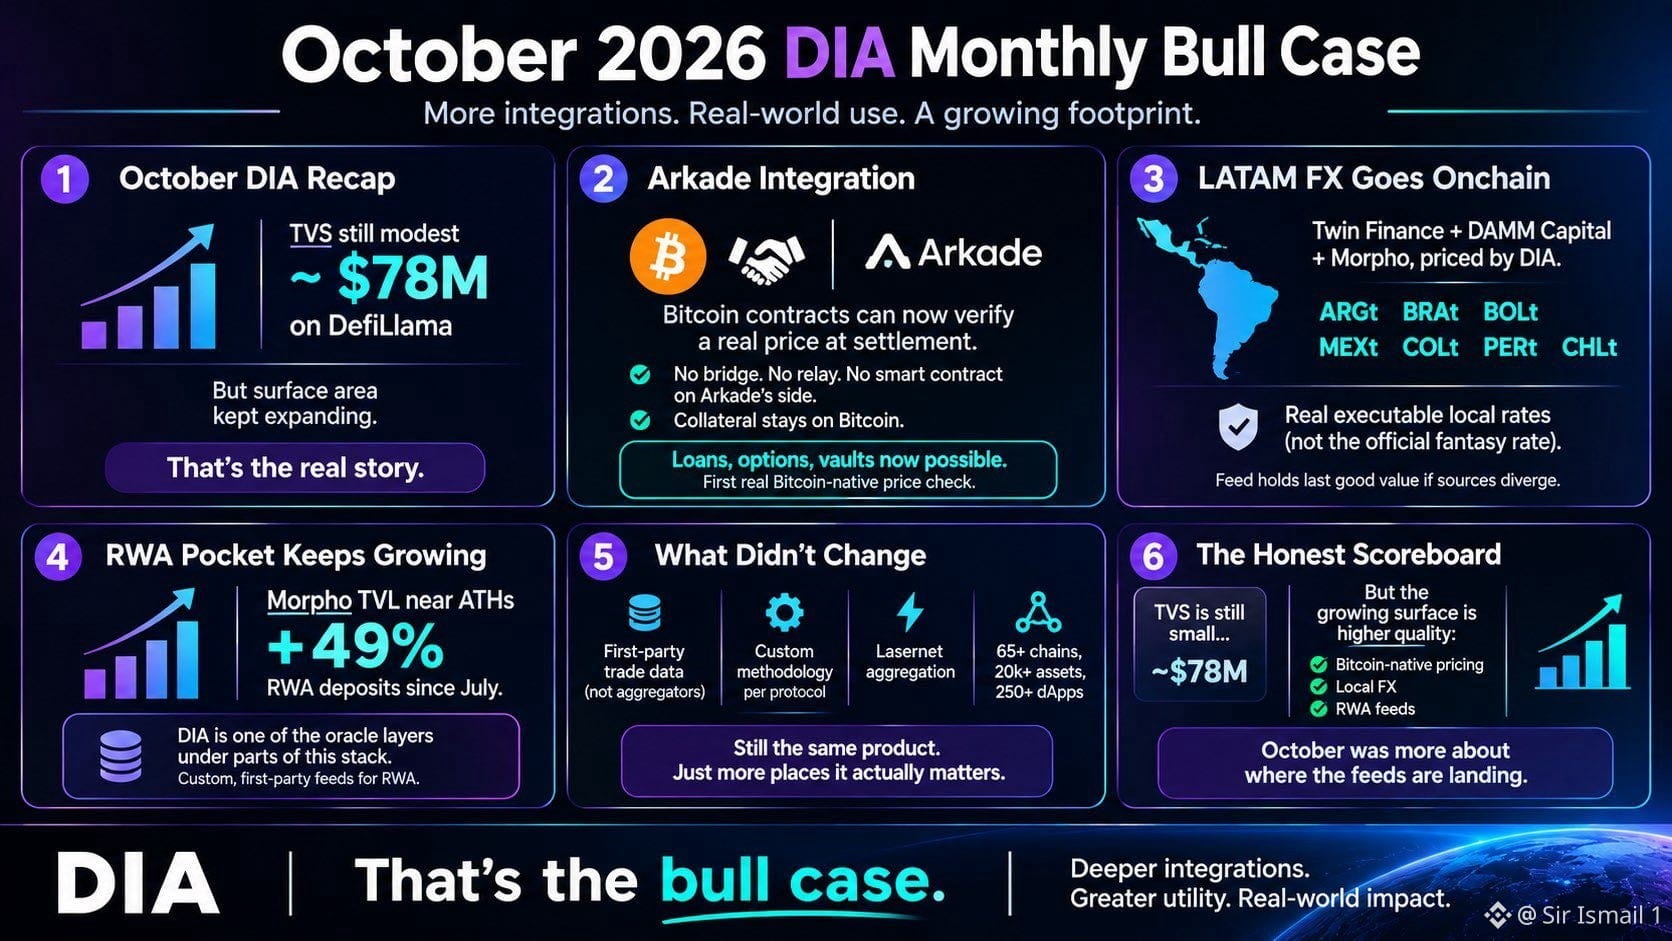
先月の@DIAdata_orgの重要な活動を見逃していた方のために
1) TVSは依然として控えめ(現時点でDefiLlamaによると約7,800万ドル)。
対応範囲は拡大し続けています。
2/ 今月最大の進展:
ArkadeがDIAの署名付きBTC/USDフィードを統合しました。
Bitcoinコントラクトが、決済時に実際の価格を検証できるようになりました。
ブリッジ不要。リレー不要。Arkade側のスマートコントラクトも不要。
担保はBitcoin上にとどまります。
ラップなしで、ローン、オプション、ボールトが実現可能に。
Bitcoinネイティブで初の本格的な価格検証です。
3/ LATAMのFXがオンチェーンに。
Twin Finance + DAMM Capital + Morpho、価格提供はDIA。
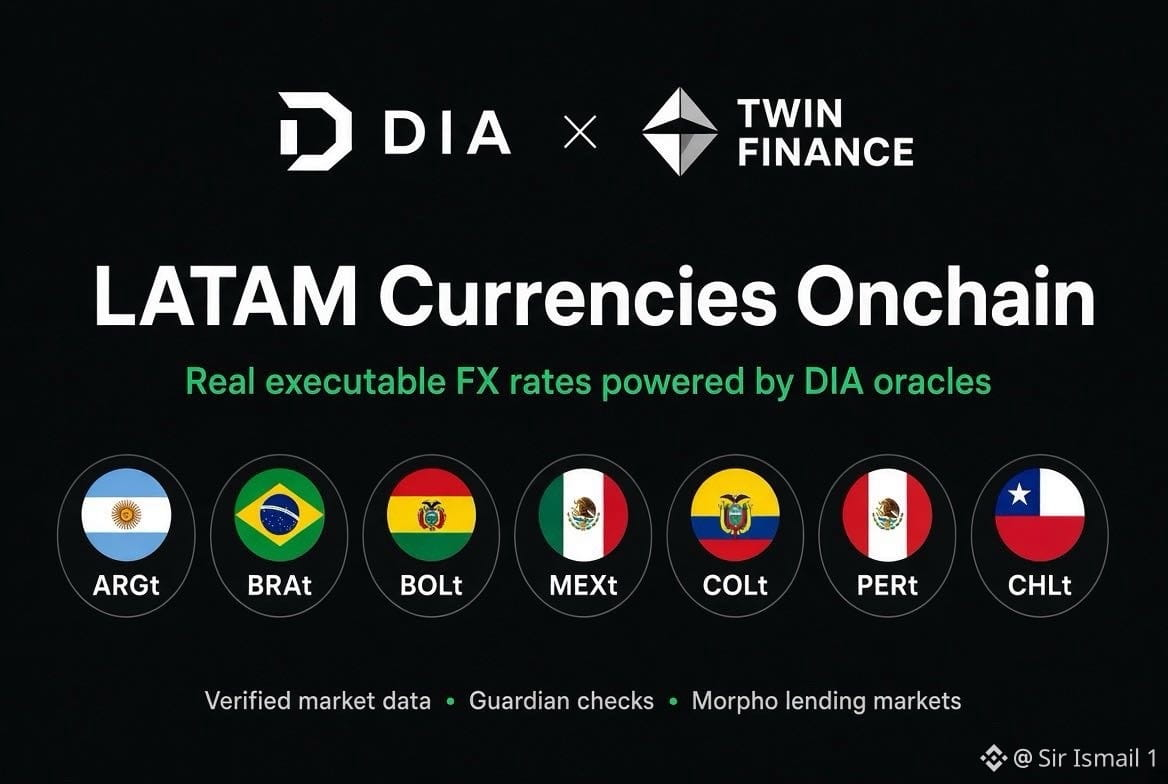
ARGt、BRAt、BOLt、MEXt、COLt、PERt、CHLt — 公式の非現実的なレートではなく、実際に取引可能な現地レートで価格を提供。
ソース間の乖離がしきい値を超えると、フィードは不正確な価格を清算に流し込まず、最後の有効な値を維持します。
4/ DeFiの大半が下落していた一方で、RWA分野は成長を続けました。
MorphoのTVLは史上最高値近辺。RWA預入額は7月以降49%増。アクティブなRWAローンも大幅に増加。その大半はプライベートクレジットです。
DIAは、この仕組みの一部を支えるオラクルレイヤーのひとつです。プロトコルがソースからチェーンまで実際に検証できる、カスタムのファーストパーティ・フィードを提供しています。
5/ 変わらないこと:
• ファーストパーティの取引データ(サードパーティのアグリゲーターではありません)
• プロトコルごとのカスタム手法
• Lasernetによる集約
• 65以上のチェーン、2万以上のアセット、250以上のdApp
製品はこれまでと同じ。ただ、実際に価値を発揮する場所が増えただけです。
6/ 正直な評価:TVSはまだ小さいです。
成長している領域(Bitcoinネイティブの価格提供、現地通貨FX、RWA/ファンダメンタルズ・フィード)は、より質の高い分野です。
10月は数字の大きさよりも、フィードがどこに導入されているかが焦点でした。
それが強気相場の根拠のすべてです。
$DIAファミリー、引き続き強気でいきましょう
先月の@DIAdata_orgの重要な活動を見逃していた方のために
1) TVSは依然として控えめ(現時点でDefiLlamaによると約7,800万ドル)。
対応範囲は拡大し続けています。
2/ 今月最大の進展:
ArkadeがDIAの署名付きBTC/USDフィードを統合しました。
Bitcoinコントラクトが、決済時に実際の価格を検証できるようになりました。
ブリッジ不要。リレー不要。Arkade側のスマートコントラクトも不要。
担保はBitcoin上にとどまります。
ラップなしで、ローン、オプション、ボールトが実現可能に。
Bitcoinネイティブで初の本格的な価格検証です。
3/ LATAMのFXがオンチェーンに。
Twin Finance + DAMM Capital + Morpho、価格提供はDIA。
ARGt、BRAt、BOLt、MEXt、COLt、PERt、CHLt — 公式の非現実的なレートではなく、実際に取引可能な現地レートで価格を提供。
ソース間の乖離がしきい値を超えると、フィードは不正確な価格を清算に流し込まず、最後の有効な値を維持します。
4/ DeFiの大半が下落していた一方で、RWA分野は成長を続けました。
MorphoのTVLは史上最高値近辺。RWA預入額は7月以降49%増。アクティブなRWAローンも大幅に増加。その大半はプライベートクレジットです。
DIAは、この仕組みの一部を支えるオラクルレイヤーのひとつです。プロトコルがソースからチェーンまで実際に検証できる、カスタムのファーストパーティ・フィードを提供しています。
5/ 変わらないこと:
• ファーストパーティの取引データ(サードパーティのアグリゲーターではありません)
• プロトコルごとのカスタム手法
• Lasernetによる集約
• 65以上のチェーン、2万以上のアセット、250以上のdApp
製品はこれまでと同じ。ただ、実際に価値を発揮する場所が増えただけです。
6/ 正直な評価:TVSはまだ小さいです。
成長している領域(Bitcoinネイティブの価格提供、現地通貨FX、RWA/ファンダメンタルズ・フィード)は、より質の高い分野です。
10月は数字の大きさよりも、フィードがどこに導入されているかが焦点でした。
それが強気相場の根拠のすべてです。
$DIAファミリー、引き続き強気でいきましょう
1) TVSは依然として控えめ(現時点でDefiLlamaによると約7,800万ドル)。
対応範囲は拡大し続けています。
2/ 今月最大の進展:
ArkadeがDIAの署名付きBTC/USDフィードを統合しました。
Bitcoinコントラクトが、決済時に実際の価格を検証できるようになりました。
ブリッジ不要。リレー不要。Arkade側のスマートコントラクトも不要。
担保はBitcoin上にとどまります。
ラップなしで、ローン、オプション、ボールトが実現可能に。
Bitcoinネイティブで初の本格的な価格検証です。
3/ LATAMのFXがオンチェーンに。
Twin Finance + DAMM Capital + Morpho、価格提供はDIA。
ARGt、BRAt、BOLt、MEXt、COLt、PERt、CHLt — 公式の非現実的なレートではなく、実際に取引可能な現地レートで価格を提供。
ソース間の乖離がしきい値を超えると、フィードは不正確な価格を清算に流し込まず、最後の有効な値を維持します。
4/ DeFiの大半が下落していた一方で、RWA分野は成長を続けました。
MorphoのTVLは史上最高値近辺。RWA預入額は7月以降49%増。アクティブなRWAローンも大幅に増加。その大半はプライベートクレジットです。
DIAは、この仕組みの一部を支えるオラクルレイヤーのひとつです。プロトコルがソースからチェーンまで実際に検証できる、カスタムのファーストパーティ・フィードを提供しています。
5/ 変わらないこと:
• ファーストパーティの取引データ(サードパーティのアグリゲーターではありません)
• プロトコルごとのカスタム手法
• Lasernetによる集約
• 65以上のチェーン、2万以上のアセット、250以上のdApp
製品はこれまでと同じ。ただ、実際に価値を発揮する場所が増えただけです。
6/ 正直な評価:TVSはまだ小さいです。
成長している領域(Bitcoinネイティブの価格提供、現地通貨FX、RWA/ファンダメンタルズ・フィード)は、より質の高い分野です。
10月は数字の大きさよりも、フィードがどこに導入されているかが焦点でした。
それが強気相場の根拠のすべてです。
$DIAファミリー、引き続き強気でいきましょう
87
·
--
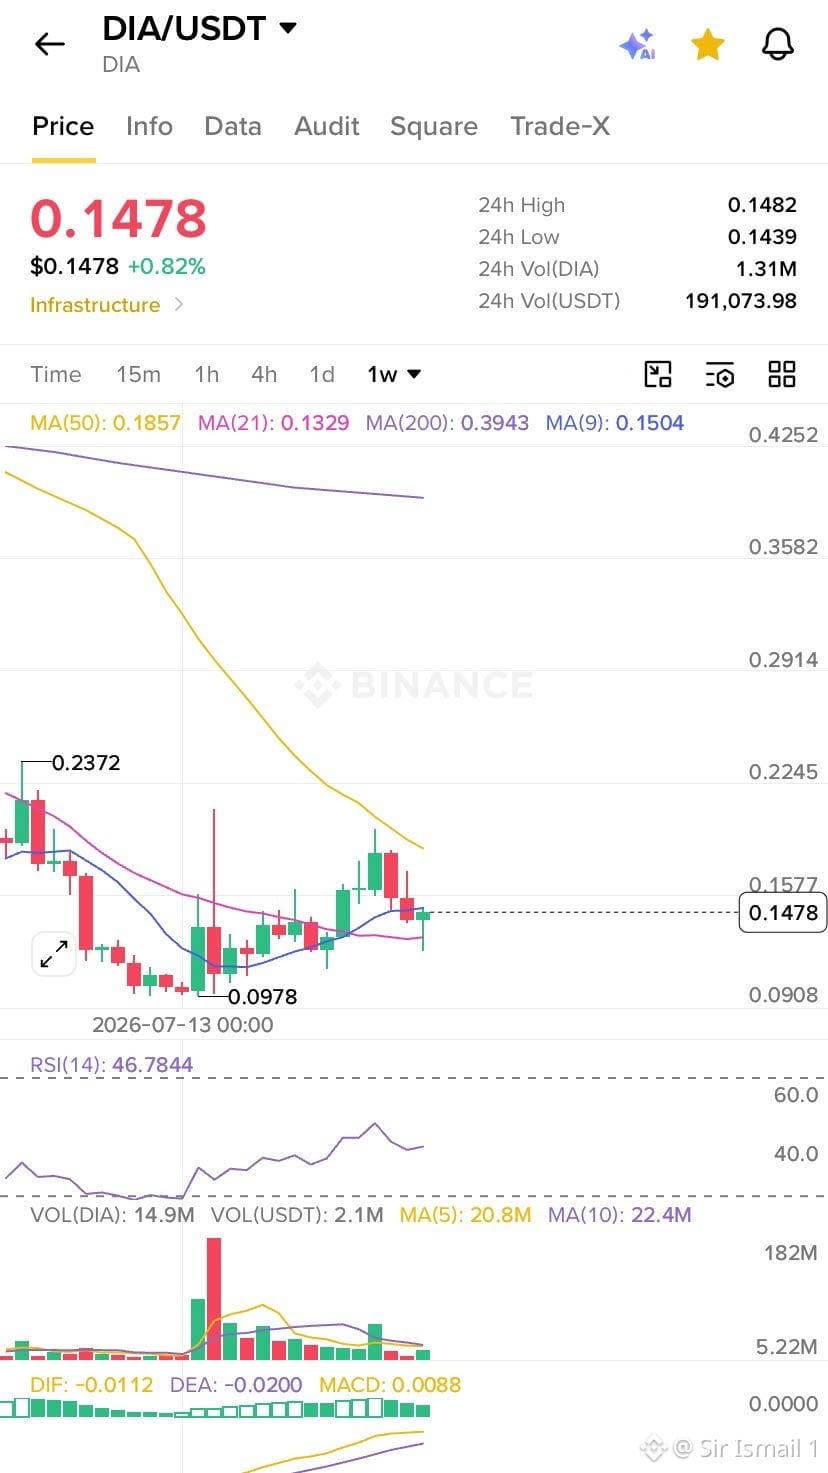
$DIAの強気派がようやく反撃していますが、本当の試練は$0.150から始まります。
週足では、先週の売り浴びせを経て、DIAに安定化の兆しが初めて見られます。しかし、強気派はまだ突破すべき抵抗線を抱えています。
重要な価格水準:
レジスタンス:$0.150–$0.152 → $0.166 → $0.180
サポート:$0.144 → $0.140 → $0.135
強気シナリオ:$0.150–$0.152を回復し、サポートとして維持できれば、回復の勢いが強まり、$0.140への下落がより高い安値となる可能性が出てきます。そうなれば、$0.166への道が開けます。
弱気シナリオ:$0.150–$0.152付近で反落し、その後$0.144を割り込めば、反発の勢いは弱まります。$0.140の再テストが有力となり、サポートが崩れれば次は$0.135が視野に入ります。
モメンタムは改善していますが、トレンドが反転したとはまだ確認されていません。MA9と$0.150–$0.152のレジスタンスゾーンが、目先の試金石です。
$0.150が上昇継続の分岐点です。反発そのものよりも、しっかりと回復できるかが重要です。
みんな、強気でいこう!
$DIAの強気派がようやく反撃していますが、本当の試練は$0.150から始まります。
週足では、先週の売り浴びせを経て、DIAに安定化の兆しが初めて見られます。しかし、強気派はまだ突破すべき抵抗線を抱えています。
重要な価格水準:
レジスタンス:$0.150–$0.152 → $0.166 → $0.180
サポート:$0.144 → $0.140 → $0.135
強気シナリオ:$0.150–$0.152を回復し、サポートとして維持できれば、回復の勢いが強まり、$0.140への下落がより高い安値となる可能性が出てきます。そうなれば、$0.166への道が開けます。
弱気シナリオ:$0.150–$0.152付近で反落し、その後$0.144を割り込めば、反発の勢いは弱まります。$0.140の再テストが有力となり、サポートが崩れれば次は$0.135が視野に入ります。
モメンタムは改善していますが、トレンドが反転したとはまだ確認されていません。MA9と$0.150–$0.152のレジスタンスゾーンが、目先の試金石です。
$0.150が上昇継続の分岐点です。反発そのものよりも、しっかりと回復できるかが重要です。
みんな、強気でいこう!
週足では、先週の売り浴びせを経て、DIAに安定化の兆しが初めて見られます。しかし、強気派はまだ突破すべき抵抗線を抱えています。
重要な価格水準:
レジスタンス:$0.150–$0.152 → $0.166 → $0.180
サポート:$0.144 → $0.140 → $0.135
強気シナリオ:$0.150–$0.152を回復し、サポートとして維持できれば、回復の勢いが強まり、$0.140への下落がより高い安値となる可能性が出てきます。そうなれば、$0.166への道が開けます。
弱気シナリオ:$0.150–$0.152付近で反落し、その後$0.144を割り込めば、反発の勢いは弱まります。$0.140の再テストが有力となり、サポートが崩れれば次は$0.135が視野に入ります。
モメンタムは改善していますが、トレンドが反転したとはまだ確認されていません。MA9と$0.150–$0.152のレジスタンスゾーンが、目先の試金石です。
$0.150が上昇継続の分岐点です。反発そのものよりも、しっかりと回復できるかが重要です。
みんな、強気でいこう!
59
·
--
DIAにとって最大の機会は、従来のオラクルモデルでは価格付けが難しい資産にあるかもしれません。
準備金に基づいて評価されるボルトシェア、取引時間を考慮したトークン化株式、新興FX市場、プライベートクレジット、コモディティなどがその例です。
こうした資産に必要なのは、直近の取引価格だけではありません。価値が実際にどのように決まるのかを反映した、信頼性と検証可能性を備えたデータが必要です。
DIAが注力しているのは、まさにこの領域です。
TVSは、DIAが現在どの位置にいるかを示しています。20,000以上の資産と65以上のブロックチェーンをカバーしていることは、その先にさらに大きな機会が広がっていることを示しています。
次世代のオンチェーン金融に必要なのは、流動性だけではありません。価格付けのインフラも必要です。DIAが構築しているのは、まさにその市場です。
あらゆる資産に価格を。すべてのデータフィードに検証を。$DIA
DIAにとって最大の機会は、従来のオラクルモデルでは価格付けが難しい資産にあるかもしれません。
準備金に基づいて評価されるボルトシェア、取引時間を考慮したトークン化株式、新興FX市場、プライベートクレジット、コモディティなどがその例です。
こうした資産に必要なのは、直近の取引価格だけではありません。価値が実際にどのように決まるのかを反映した、信頼性と検証可能性を備えたデータが必要です。
DIAが注力しているのは、まさにこの領域です。
TVSは、DIAが現在どの位置にいるかを示しています。20,000以上の資産と65以上のブロックチェーンをカバーしていることは、その先にさらに大きな機会が広がっていることを示しています。
次世代のオンチェーン金融に必要なのは、流動性だけではありません。価格付けのインフラも必要です。DIAが構築しているのは、まさにその市場です。
あらゆる資産に価格を。すべてのデータフィードに検証を。$DIA
準備金に基づいて評価されるボルトシェア、取引時間を考慮したトークン化株式、新興FX市場、プライベートクレジット、コモディティなどがその例です。
こうした資産に必要なのは、直近の取引価格だけではありません。価値が実際にどのように決まるのかを反映した、信頼性と検証可能性を備えたデータが必要です。
DIAが注力しているのは、まさにこの領域です。
TVSは、DIAが現在どの位置にいるかを示しています。20,000以上の資産と65以上のブロックチェーンをカバーしていることは、その先にさらに大きな機会が広がっていることを示しています。
次世代のオンチェーン金融に必要なのは、流動性だけではありません。価格付けのインフラも必要です。DIAが構築しているのは、まさにその市場です。
あらゆる資産に価格を。すべてのデータフィードに検証を。$DIA
56
·
--
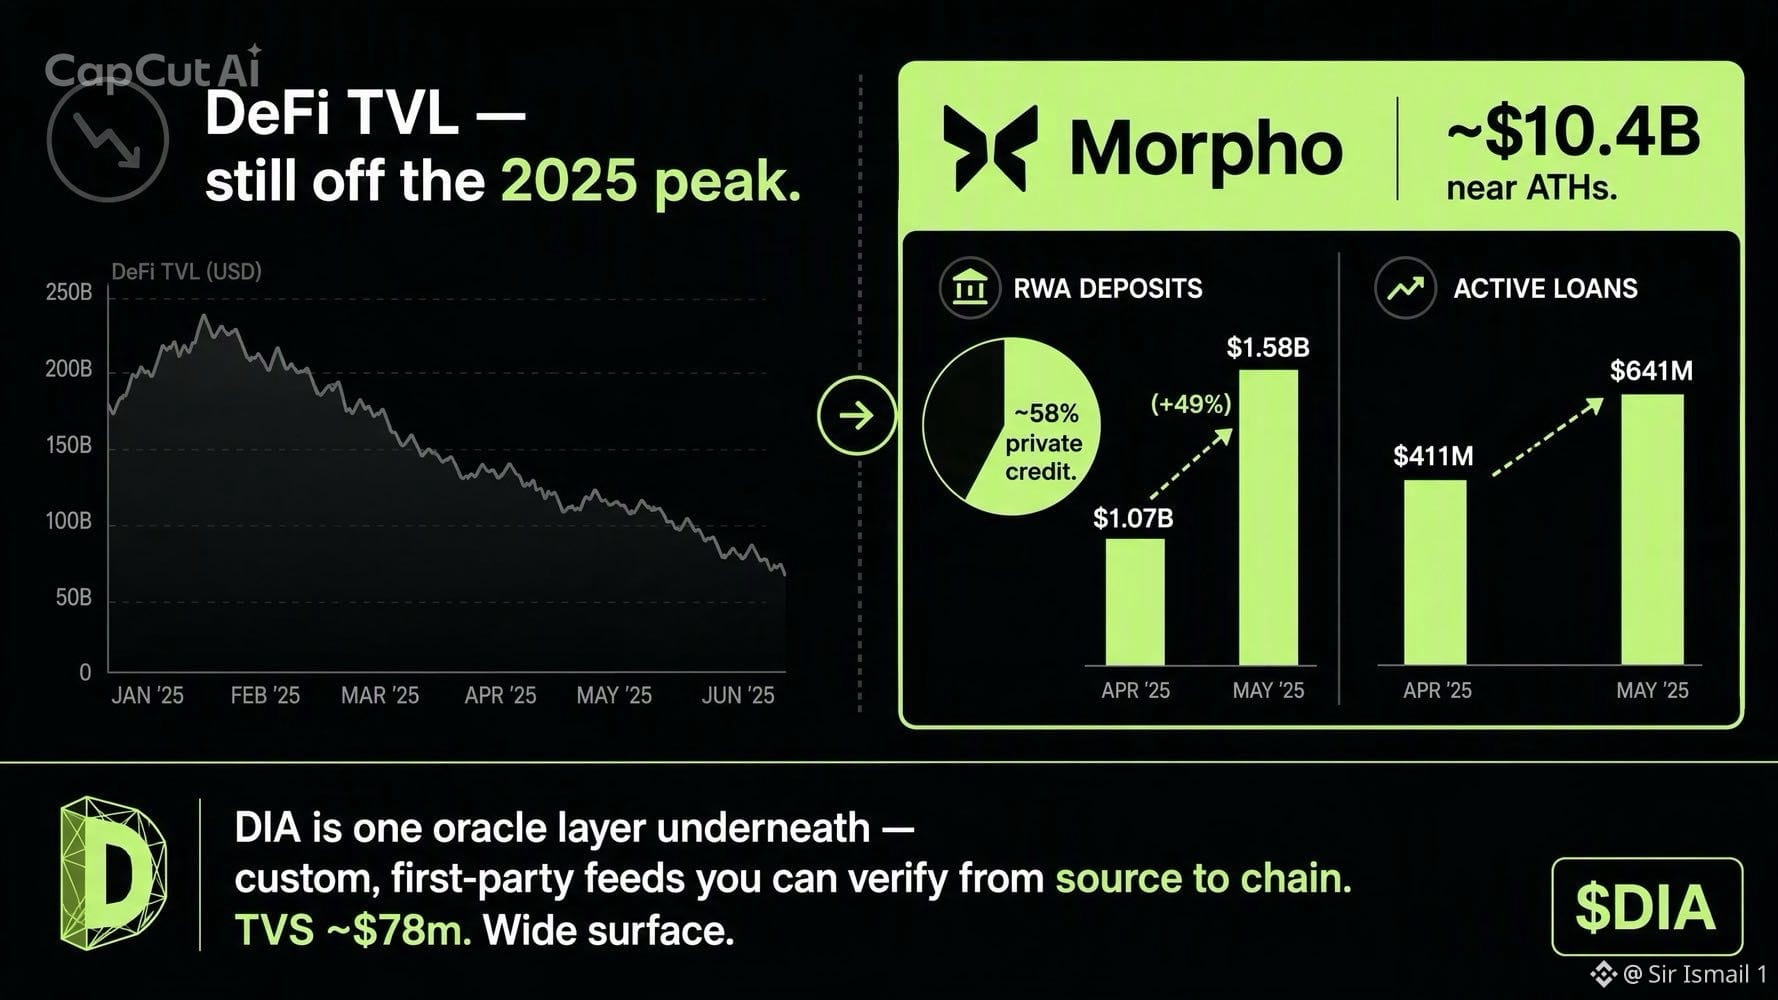
DeFiは2025年のピークからまだ回復途上ですが、市場のすべての分野が同じ方向に動いているわけではありません。
セクターの大部分が依然として下落局面にある一方で、Morphoは異なる様相を見せています。
TVLは過去最高に近い約$10.4Bに達しています。
その内部で何が起きているか見てみましょう。
→ RWA預入額は7月以降、$1.07Bから$1.58Bへ増加(+49%)。
→ アクティブなRWAローンは$411Mから$641Mに増加。
→ その預入額の約58%はプライベートクレジットです。
DeFi市場全体は苦戦していますが、トークン化されたクレジットには今も資金が流入しています。
この成長に伴い、より優れた価格データも必要になります。
プライベートクレジットはBTCやETHのように取引されるわけではありません。プロトコルに必要なのは、直近の市場価格だけでなく、原資産に関する信頼できる情報です。
そこで@DIAdata_orgが活躍します。
DIAは、元のデータソースからブロックチェーンに至るまで、プロトコルが検証できるカスタムの一次オラクルフィードを提供しています。
公平を期すために言えば、DIAのTVSはDefiLlamaによると約$78Mと、まだ比較的小規模です。しかし、データのカバレッジははるかに幅広い資産や市場に及んでいます。
その可能性は現在のTVSを上回ります。トークン化されたクレジットが成長するにつれて、信頼できるデータの重要性は増し、DIAはその市場にサービスを提供できる立場にあります。$DIA
DeFiは2025年のピークからまだ回復途上ですが、市場のすべての分野が同じ方向に動いているわけではありません。
セクターの大部分が依然として下落局面にある一方で、Morphoは異なる様相を見せています。
TVLは過去最高に近い約$10.4Bに達しています。
その内部で何が起きているか見てみましょう。
→ RWA預入額は7月以降、$1.07Bから$1.58Bへ増加(+49%)。
→ アクティブなRWAローンは$411Mから$641Mに増加。
→ その預入額の約58%はプライベートクレジットです。
DeFi市場全体は苦戦していますが、トークン化されたクレジットには今も資金が流入しています。
この成長に伴い、より優れた価格データも必要になります。
プライベートクレジットはBTCやETHのように取引されるわけではありません。プロトコルに必要なのは、直近の市場価格だけでなく、原資産に関する信頼できる情報です。
そこで@DIAdata_orgが活躍します。
DIAは、元のデータソースからブロックチェーンに至るまで、プロトコルが検証できるカスタムの一次オラクルフィードを提供しています。
公平を期すために言えば、DIAのTVSはDefiLlamaによると約$78Mと、まだ比較的小規模です。しかし、データのカバレッジははるかに幅広い資産や市場に及んでいます。
その可能性は現在のTVSを上回ります。トークン化されたクレジットが成長するにつれて、信頼できるデータの重要性は増し、DIAはその市場にサービスを提供できる立場にあります。$DIA
セクターの大部分が依然として下落局面にある一方で、Morphoは異なる様相を見せています。
TVLは過去最高に近い約$10.4Bに達しています。
その内部で何が起きているか見てみましょう。
→ RWA預入額は7月以降、$1.07Bから$1.58Bへ増加(+49%)。
→ アクティブなRWAローンは$411Mから$641Mに増加。
→ その預入額の約58%はプライベートクレジットです。
DeFi市場全体は苦戦していますが、トークン化されたクレジットには今も資金が流入しています。
この成長に伴い、より優れた価格データも必要になります。
プライベートクレジットはBTCやETHのように取引されるわけではありません。プロトコルに必要なのは、直近の市場価格だけでなく、原資産に関する信頼できる情報です。
そこで@DIAdata_orgが活躍します。
DIAは、元のデータソースからブロックチェーンに至るまで、プロトコルが検証できるカスタムの一次オラクルフィードを提供しています。
公平を期すために言えば、DIAのTVSはDefiLlamaによると約$78Mと、まだ比較的小規模です。しかし、データのカバレッジははるかに幅広い資産や市場に及んでいます。
その可能性は現在のTVSを上回ります。トークン化されたクレジットが成長するにつれて、信頼できるデータの重要性は増し、DIAはその市場にサービスを提供できる立場にあります。$DIA
56
·
--
Bitcoinには担保がありますが、ローンやオプションの決済前にコントラクトがBTCの価格を確認する必要がある場合、どうなるでしょうか?
ArkadeがDIAの署名付きBTC/USD価格フィードを統合しました。
そして、この仕組みは注目に値します👇🏼
→ ブリッジ不要
→ リレー不要
→ Arkade側でスマートコントラクトを用意する必要なし
担保はBitcoin上に置いたまま、決済には100以上の取引所から取得し、Lasernet上で集約された価格を使用します。
これにより、ローン、オプション、ボルトなど、より検証可能な金融商品の可能性が広がります。
なぜ重要なのでしょうか?
Bitcoinの可能性はBTCを保有することにとどまりません。信頼できる価格データがあれば、開発者はBitcoinを担保とした金融商品をさらに構築できます。
それこそが、Bitcoinでできることを広げるインフラです。
Bitcoin上で開発しているなら、DIAのオラクルインフラをぜひご覧ください。
Bitcoinには担保がありますが、ローンやオプションの決済前にコントラクトがBTCの価格を確認する必要がある場合、どうなるでしょうか?
ArkadeがDIAの署名付きBTC/USD価格フィードを統合しました。
そして、この仕組みは注目に値します👇🏼
→ ブリッジ不要
→ リレー不要
→ Arkade側でスマートコントラクトを用意する必要なし
担保はBitcoin上に置いたまま、決済には100以上の取引所から取得し、Lasernet上で集約された価格を使用します。
これにより、ローン、オプション、ボルトなど、より検証可能な金融商品の可能性が広がります。
なぜ重要なのでしょうか?
Bitcoinの可能性はBTCを保有することにとどまりません。信頼できる価格データがあれば、開発者はBitcoinを担保とした金融商品をさらに構築できます。
それこそが、Bitcoinでできることを広げるインフラです。
Bitcoin上で開発しているなら、DIAのオラクルインフラをぜひご覧ください。
ArkadeがDIAの署名付きBTC/USD価格フィードを統合しました。
そして、この仕組みは注目に値します👇🏼
→ ブリッジ不要
→ リレー不要
→ Arkade側でスマートコントラクトを用意する必要なし
担保はBitcoin上に置いたまま、決済には100以上の取引所から取得し、Lasernet上で集約された価格を使用します。
これにより、ローン、オプション、ボルトなど、より検証可能な金融商品の可能性が広がります。
なぜ重要なのでしょうか?
Bitcoinの可能性はBTCを保有することにとどまりません。信頼できる価格データがあれば、開発者はBitcoinを担保とした金融商品をさらに構築できます。
それこそが、Bitcoinでできることを広げるインフラです。
Bitcoin上で開発しているなら、DIAのオラクルインフラをぜひご覧ください。

69
·
--
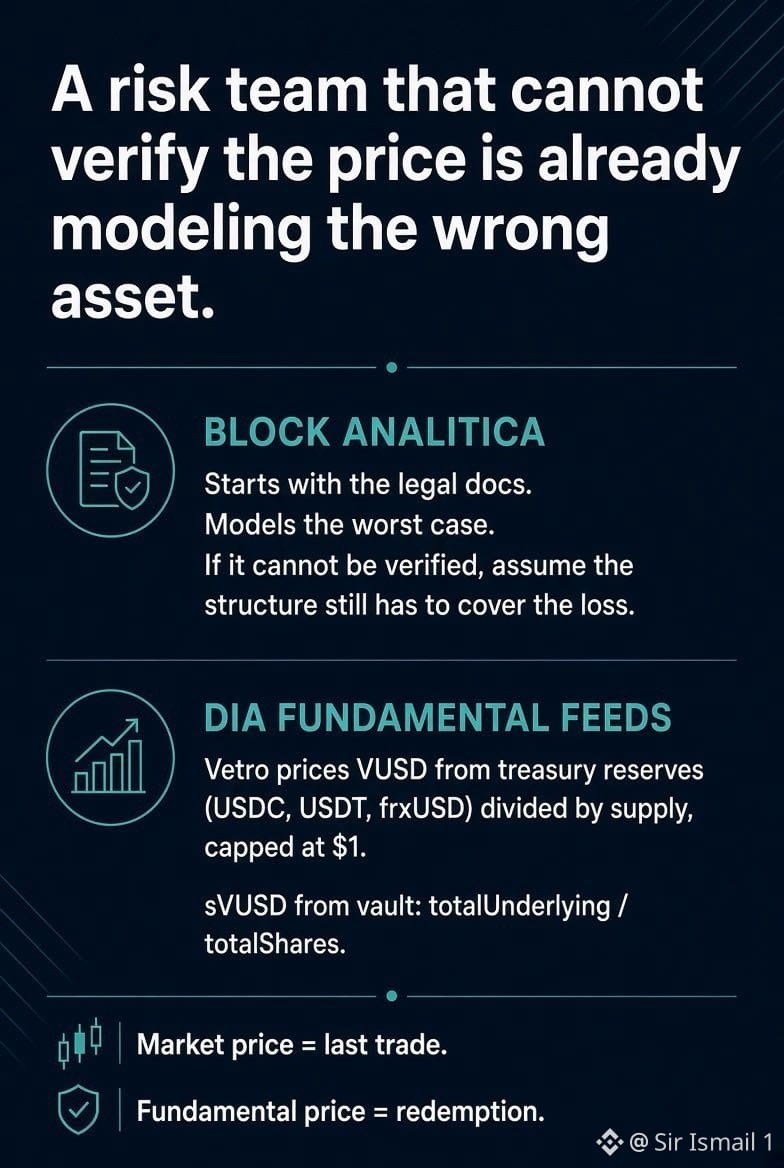
リスクモデルの精度は、信頼する価格データの精度に左右されます。その価格を検証できないなら、モデルが導き出すのは推測にすぎません。
Block Analiticaは、まず法的文書を確認し、最悪のケースをモデル化します。資産の仕組みを完全に検証できない場合でも、リスクモデルには潜在的な損失を織り込む必要があります。
オラクルデータが満たすべき基準は、これです。
市場価格と償還価値は、同じものではありません。
マーケットフィードが報告するのは取引価格です。DIAでは、一次ソースの市場データをオンチェーンで集約し、観測がいつ行われたかをユーザーが検証できるタイムスタンプを付与しています。
しかし、ボールトのシェアには別のアプローチが必要です。
→ VetroのVUSD:財務省の裏付け資産を基準に価格を算出。
→ RiverのsatUSD+:ボールトの交換レートを用いて評価。
これらの資産では、流動性の低いプールでの直近の取引よりも、準備金、供給量、償還の仕組みがはるかに重要になることがあります。
リスクチームに必要なのは、資産の実際の価値と、その価値をどのように検証できるかを反映したデータです。
フィードがブラックボックスなら、最悪のケースを想定したモデルも推測にすぎません。$DIA
リスクモデルの精度は、信頼する価格データの精度に左右されます。その価格を検証できないなら、モデルが導き出すのは推測にすぎません。
Block Analiticaは、まず法的文書を確認し、最悪のケースをモデル化します。資産の仕組みを完全に検証できない場合でも、リスクモデルには潜在的な損失を織り込む必要があります。
オラクルデータが満たすべき基準は、これです。
市場価格と償還価値は、同じものではありません。
マーケットフィードが報告するのは取引価格です。DIAでは、一次ソースの市場データをオンチェーンで集約し、観測がいつ行われたかをユーザーが検証できるタイムスタンプを付与しています。
しかし、ボールトのシェアには別のアプローチが必要です。
→ VetroのVUSD:財務省の裏付け資産を基準に価格を算出。
→ RiverのsatUSD+:ボールトの交換レートを用いて評価。
これらの資産では、流動性の低いプールでの直近の取引よりも、準備金、供給量、償還の仕組みがはるかに重要になることがあります。
リスクチームに必要なのは、資産の実際の価値と、その価値をどのように検証できるかを反映したデータです。
フィードがブラックボックスなら、最悪のケースを想定したモデルも推測にすぎません。$DIA
Block Analiticaは、まず法的文書を確認し、最悪のケースをモデル化します。資産の仕組みを完全に検証できない場合でも、リスクモデルには潜在的な損失を織り込む必要があります。
オラクルデータが満たすべき基準は、これです。
市場価格と償還価値は、同じものではありません。
マーケットフィードが報告するのは取引価格です。DIAでは、一次ソースの市場データをオンチェーンで集約し、観測がいつ行われたかをユーザーが検証できるタイムスタンプを付与しています。
しかし、ボールトのシェアには別のアプローチが必要です。
→ VetroのVUSD:財務省の裏付け資産を基準に価格を算出。
→ RiverのsatUSD+:ボールトの交換レートを用いて評価。
これらの資産では、流動性の低いプールでの直近の取引よりも、準備金、供給量、償還の仕組みがはるかに重要になることがあります。
リスクチームに必要なのは、資産の実際の価値と、その価値をどのように検証できるかを反映したデータです。
フィードがブラックボックスなら、最悪のケースを想定したモデルも推測にすぎません。$DIA
78
·
--
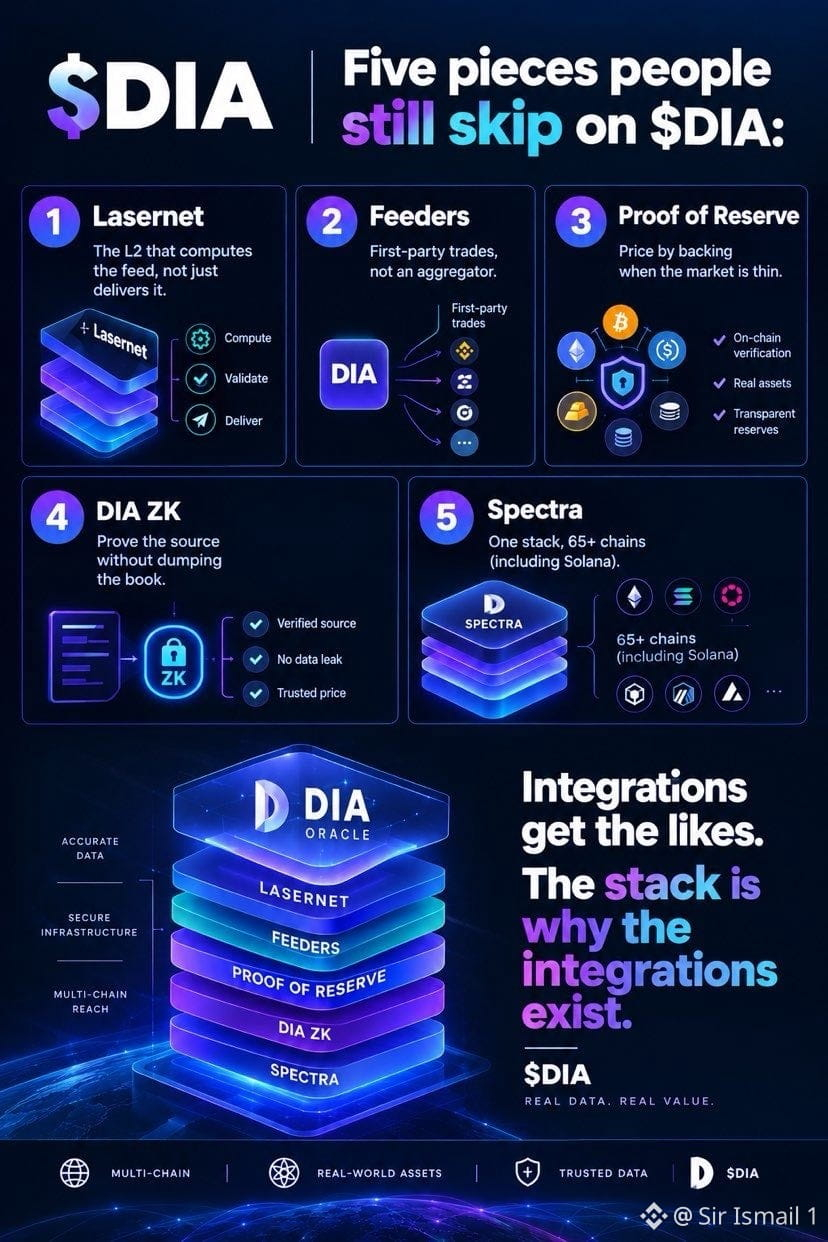
DIAに強気の姿勢をキープ🚨
統合だけに注目していると見落としがちな、$DIAの5つのポイント。
👉🏽Lasernet — オラクルデータを単に中継するのではなく、計算処理を行うL2。
👉🏽ファーストパーティのデータフィーダー — サードパーティのアグリゲーターだけに頼らず、市場から直接取得したデータ。
👉🏽Proof of Reserve — 資産の裏付けを検証するのに役立つ準備金データ。特に、市場価格だけでは全体像が見えない場合に重要です。
👉🏽DIA ZK — 元の情報を非公開に保ちながら、データの検証に役立つゼロ知識証明。
👉🏽クロスチェーン対応(Spectra)— Spectraが開発を進めるSolanaを含む65以上の接続先に対応する、単一のオラクルスタック。
統合は目に見える部分にすぎません。それを可能にしているのは、その下にあるインフラです。
統合の数を数えるだけではなく、それらをつなぐインフラに注目しましょう。
$DIAの真の強みは、そこに築かれています🤝
DIAに強気の姿勢をキープ🚨
統合だけに注目していると見落としがちな、$DIAの5つのポイント。
👉🏽Lasernet — オラクルデータを単に中継するのではなく、計算処理を行うL2。
👉🏽ファーストパーティのデータフィーダー — サードパーティのアグリゲーターだけに頼らず、市場から直接取得したデータ。
👉🏽Proof of Reserve — 資産の裏付けを検証するのに役立つ準備金データ。特に、市場価格だけでは全体像が見えない場合に重要です。
👉🏽DIA ZK — 元の情報を非公開に保ちながら、データの検証に役立つゼロ知識証明。
👉🏽クロスチェーン対応(Spectra)— Spectraが開発を進めるSolanaを含む65以上の接続先に対応する、単一のオラクルスタック。
統合は目に見える部分にすぎません。それを可能にしているのは、その下にあるインフラです。
統合の数を数えるだけではなく、それらをつなぐインフラに注目しましょう。
$DIAの真の強みは、そこに築かれています🤝
統合だけに注目していると見落としがちな、$DIAの5つのポイント。
👉🏽Lasernet — オラクルデータを単に中継するのではなく、計算処理を行うL2。
👉🏽ファーストパーティのデータフィーダー — サードパーティのアグリゲーターだけに頼らず、市場から直接取得したデータ。
👉🏽Proof of Reserve — 資産の裏付けを検証するのに役立つ準備金データ。特に、市場価格だけでは全体像が見えない場合に重要です。
👉🏽DIA ZK — 元の情報を非公開に保ちながら、データの検証に役立つゼロ知識証明。
👉🏽クロスチェーン対応(Spectra)— Spectraが開発を進めるSolanaを含む65以上の接続先に対応する、単一のオラクルスタック。
統合は目に見える部分にすぎません。それを可能にしているのは、その下にあるインフラです。
統合の数を数えるだけではなく、それらをつなぐインフラに注目しましょう。
$DIAの真の強みは、そこに築かれています🤝
84
·
--
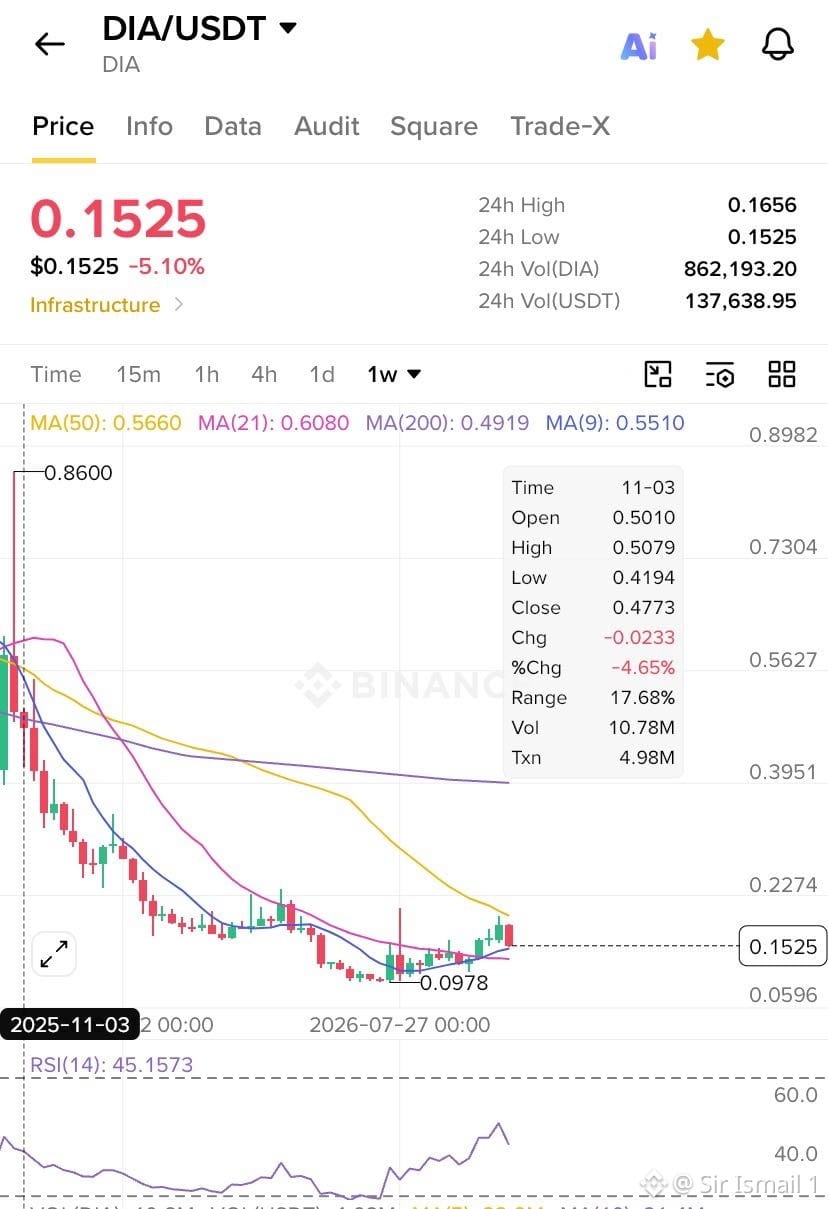
$DIA 週間アップデート
現在の構造
価格は$0.1525。$0.165~0.180のゾーンを維持できず、週を通して下落しています。
10月6日の高値である約$0.197から、さらに深く押し戻されています。週足の構造は、サイクルの底値$0.0978から切り上げた安値を保っていますが、反発の勢いは弱まりつつあります。RSIは45で、中立圏にあり、売られ過ぎではありません。週足では依然としてMA9($0.55)、MA21、MA50を大きく下回っています。
重要な価格水準
• レジスタンス:$0.1656、次に$0.180~0.197
• サポート:$0.1525、次に$0.140/$0.120、さらに底値の$0.0978
強気シナリオ
$0.152を維持し、$0.166を回復すること。そうなれば安値を切り上げる形となり、$0.180を再び目指せるでしょう。
弱気シナリオ
$0.152を割り込むこと。次の下値目安は$0.140、その次は$0.120に向けた、より深い押し戻しです。$0.098の底値を再び試すのは、大きく崩れた場合に限られます。
現時点では、反落を受けて短期の週足バイアスは中立から弱気です。$0.098を起点とする大きな底値は、依然として維持されています。今週の分岐点は$0.152です。
$DIA 週間アップデート
現在の構造
価格は$0.1525。$0.165~0.180のゾーンを維持できず、週を通して下落しています。
10月6日の高値である約$0.197から、さらに深く押し戻されています。週足の構造は、サイクルの底値$0.0978から切り上げた安値を保っていますが、反発の勢いは弱まりつつあります。RSIは45で、中立圏にあり、売られ過ぎではありません。週足では依然としてMA9($0.55)、MA21、MA50を大きく下回っています。
重要な価格水準
• レジスタンス:$0.1656、次に$0.180~0.197
• サポート:$0.1525、次に$0.140/$0.120、さらに底値の$0.0978
強気シナリオ
$0.152を維持し、$0.166を回復すること。そうなれば安値を切り上げる形となり、$0.180を再び目指せるでしょう。
弱気シナリオ
$0.152を割り込むこと。次の下値目安は$0.140、その次は$0.120に向けた、より深い押し戻しです。$0.098の底値を再び試すのは、大きく崩れた場合に限られます。
現時点では、反落を受けて短期の週足バイアスは中立から弱気です。$0.098を起点とする大きな底値は、依然として維持されています。今週の分岐点は$0.152です。
現在の構造
価格は$0.1525。$0.165~0.180のゾーンを維持できず、週を通して下落しています。
10月6日の高値である約$0.197から、さらに深く押し戻されています。週足の構造は、サイクルの底値$0.0978から切り上げた安値を保っていますが、反発の勢いは弱まりつつあります。RSIは45で、中立圏にあり、売られ過ぎではありません。週足では依然としてMA9($0.55)、MA21、MA50を大きく下回っています。
重要な価格水準
• レジスタンス:$0.1656、次に$0.180~0.197
• サポート:$0.1525、次に$0.140/$0.120、さらに底値の$0.0978
強気シナリオ
$0.152を維持し、$0.166を回復すること。そうなれば安値を切り上げる形となり、$0.180を再び目指せるでしょう。
弱気シナリオ
$0.152を割り込むこと。次の下値目安は$0.140、その次は$0.120に向けた、より深い押し戻しです。$0.098の底値を再び試すのは、大きく崩れた場合に限られます。
現時点では、反落を受けて短期の週足バイアスは中立から弱気です。$0.098を起点とする大きな底値は、依然として維持されています。今週の分岐点は$0.152です。
61
·
--
トークン化株式は暗号資産のようには取引されません。
市場は閉まります。
取引セッションは切り替わります。
古い価格表示が、不適切な清算につながることもあります。
@DIAdata_org は、署名付きタイムスタンプとセッションごとの価格鮮度判定ロジックを ST0x に提供しています。
それが、単なる価格と、実際に使える価格の違いです。
$DIA に強気の姿勢を保ちましょう
トークン化株式は暗号資産のようには取引されません。
市場は閉まります。
取引セッションは切り替わります。
古い価格表示が、不適切な清算につながることもあります。
@DIAdata_org は、署名付きタイムスタンプとセッションごとの価格鮮度判定ロジックを ST0x に提供しています。
それが、単なる価格と、実際に使える価格の違いです。
$DIA に強気の姿勢を保ちましょう
市場は閉まります。
取引セッションは切り替わります。
古い価格表示が、不適切な清算につながることもあります。
@DIAdata_org は、署名付きタイムスタンプとセッションごとの価格鮮度判定ロジックを ST0x に提供しています。
それが、単なる価格と、実際に使える価格の違いです。
$DIA に強気の姿勢を保ちましょう
72
·
--
Solana上のAIエージェントにも、信頼できるデータが必要です。
スワップを実行するための価格。
Vaultを評価するためのNAV。
ステーブルコインの裏付けを確認するための準備金チェック。
そこで登場するのが@DIAdata_orgです。
DIAはSolana上で稼働を開始し、より広範なネットワーク全体で利用されているものと同じオラクルインフラを提供します。
→ 一次ソースの取引データ
→ Lasernetによるオンチェーン計算
→ データを宛先チェーンへ配信
Solana専用の別個のオラクルスタックは不要。65以上の接続先を持つ複数のエコシステムに対応する、ひとつのデータレイヤーです。
Solanaのエージェント経済圏が成長するなかで、これは重要です。エージェントが適切な判断を下せるのは、その判断を支えるデータが信頼できる場合だけです。
ひとつのデータレイヤー。複数のチェーン。そのなかには、Spectraが構築を進めるエコシステムも含まれます。
それが$DIAの存在意義です。
Solana上のAIエージェントにも、信頼できるデータが必要です。
スワップを実行するための価格。
Vaultを評価するためのNAV。
ステーブルコインの裏付けを確認するための準備金チェック。
そこで登場するのが@DIAdata_orgです。
DIAはSolana上で稼働を開始し、より広範なネットワーク全体で利用されているものと同じオラクルインフラを提供します。
→ 一次ソースの取引データ
→ Lasernetによるオンチェーン計算
→ データを宛先チェーンへ配信
Solana専用の別個のオラクルスタックは不要。65以上の接続先を持つ複数のエコシステムに対応する、ひとつのデータレイヤーです。
Solanaのエージェント経済圏が成長するなかで、これは重要です。エージェントが適切な判断を下せるのは、その判断を支えるデータが信頼できる場合だけです。
ひとつのデータレイヤー。複数のチェーン。そのなかには、Spectraが構築を進めるエコシステムも含まれます。
それが$DIAの存在意義です。
スワップを実行するための価格。
Vaultを評価するためのNAV。
ステーブルコインの裏付けを確認するための準備金チェック。
そこで登場するのが@DIAdata_orgです。
DIAはSolana上で稼働を開始し、より広範なネットワーク全体で利用されているものと同じオラクルインフラを提供します。
→ 一次ソースの取引データ
→ Lasernetによるオンチェーン計算
→ データを宛先チェーンへ配信
Solana専用の別個のオラクルスタックは不要。65以上の接続先を持つ複数のエコシステムに対応する、ひとつのデータレイヤーです。
Solanaのエージェント経済圏が成長するなかで、これは重要です。エージェントが適切な判断を下せるのは、その判断を支えるデータが信頼できる場合だけです。
ひとつのデータレイヤー。複数のチェーン。そのなかには、Spectraが構築を進めるエコシステムも含まれます。
それが$DIAの存在意義です。
76
ログインして、さらにコンテンツを読む
厳選トピックで世界の暗号資産トレーダーの仲間入り
⚡️ 暗号資産に関する最新かつ有益な情報が見つかります。
💬 世界最大の暗号資産取引所から信頼されています。
👍 認証を受けたクリエイターから、有益なインサイトを得られます。
メール / 電話番号