Binance Square
Elon jamess 1
106 投稿

Elon jamess 1

Dream big trust big move big and your outcomes will grow big too.
0 フォロー
5 フォロワー
7 いいね
投稿
·
--
翻訳参照
$LINK — Bounces to 9.200 or breaks to 7.800. ​Long $LINK (Or Wait for Structural Confirmation) ​Entry: 8.370–8.479 ​SL: 8.130 ​TP1: 8.605 ​TP2: 8.950 ​TP3: 9.200 ​Market Context & Reasoning ​The 1-hour chart displays a highly constructive, trending bullish structure. After established accumulation swept liquidity at the session base of 7.897, an aggressive buy-side surge drove the price through previous overhead resistance. ​Since setting a local high of 8.605, the price has established a healthy, high-level consolidation range between 8.370 and 8.605. It is currently trading near the middle of this range at 8.479 (up 1.86% on the day). The shallow nature of this pullback, coupled with consistent higher lows, indicates that demand remains strong and sellers are struggling to drive the price deeper. If the bulls successfully defend the 8.370 support pivot, a breakout above the local ceiling at 8.605 is expected to trigger a momentum expansion toward key upside targets. ​Trade $LINK here 👇
$LINK — Bounces to 9.200 or breaks to 7.800.

​Long $LINK (Or Wait for Structural Confirmation)
​Entry: 8.370–8.479

​SL: 8.130

​TP1: 8.605
​TP2: 8.950
​TP3: 9.200

​Market Context & Reasoning

​The 1-hour chart displays a highly constructive, trending bullish structure. After established accumulation swept liquidity at the session base of 7.897, an aggressive buy-side surge drove the price through previous overhead resistance.

​Since setting a local high of 8.605, the price has established a healthy, high-level consolidation range between 8.370 and 8.605. It is currently trading near the middle of this range at 8.479 (up 1.86% on the day). The shallow nature of this pullback, coupled with consistent higher lows, indicates that demand remains strong and sellers are struggling to drive the price deeper. If the bulls successfully defend the 8.370 support pivot, a breakout above the local ceiling at 8.605 is expected to trigger a momentum expansion toward key upside targets.

​Trade $LINK here 👇
翻訳参照
$LINK — Bounces to 9.150 or breaks to 7.100. ​Long $LINK (Or Wait for Breakout Confirmation) ​Entry: 7.780–7.892 ​SL: 7.620 ​TP1: 7.922 ​TP2: 8.350 ​TP3: 9.150 ​Market Context & Reasoning ​Price action on the 1-hour chart of displays a stark structural shift, with bulls completely reversing the previous markdown phase. After establishing an intraday capitulation floor at 7.527, a violent influx of aggressive spot demand absorbed all available overhead supply. This structural bottom sparked a sustained higher-low sequence that culminated in an explosive, near-vertical impulse candle surging directly into the local overhead ceiling. ​The asset peaked at 7.922 and is currently undergoing a tight, high-ordered compression right beneath that level, trading at 7.892 (up 3.03% on the session). Finding acceptance and building a tight support base near the absolute highs of a major momentum move is a highly bullish posture, indicating that sellers are completely exhausted and unable to push the price back down. Attempting to step in front of this velocity to short runs a severe risk of being caught in an immediate breakout expansion. If bulls successfully anchor above the broken 7.800 psychological shelf and deploy enough continuation volume to cleanly breach 7.922, it sets the stage for a major upward expansion leg targeting deeper macro levels. ​Trade $LINK here 👇
$LINK — Bounces to 9.150 or breaks to 7.100.

​Long $LINK (Or Wait for Breakout Confirmation)

​Entry: 7.780–7.892

​SL: 7.620

​TP1: 7.922
​TP2: 8.350
​TP3: 9.150

​Market Context & Reasoning

​Price action on the 1-hour chart of displays a stark structural shift, with bulls completely reversing the previous markdown phase. After establishing an intraday capitulation floor at 7.527, a violent influx of aggressive spot demand absorbed all available overhead supply. This structural bottom sparked a sustained higher-low sequence that culminated in an explosive, near-vertical impulse candle surging directly into the local overhead ceiling.

​The asset peaked at 7.922 and is currently undergoing a tight, high-ordered compression right beneath that level, trading at 7.892 (up 3.03% on the session). Finding acceptance and building a tight support base near the absolute highs of a major momentum move is a highly bullish posture, indicating that sellers are completely exhausted and unable to push the price back down. Attempting to step in front of this velocity to short runs a severe risk of being caught in an immediate breakout expansion. If bulls successfully anchor above the broken 7.800 psychological shelf and deploy enough continuation volume to cleanly breach 7.922, it sets the stage for a major upward expansion leg targeting deeper macro levels.

​Trade $LINK here 👇
翻訳参照
$TRX — Bounces to 0.3850 or breaks to 0.2950. ​Long $TRX (Or Wait for Breakout Confirmation) ​Entry: 0.3270–0.3290 ​SL: 0.3210 ​TP1: 0.3340 ​TP2: 0.3600 ​TP3: 0.3850 ​Market Context & Reasoning ​Price action on the 1-hour chart of displays a structurally strong bullish expansion and continuation pattern establishing itself after a solid build-up from an absolute session low at 0.3226. Following a sharp, high-volume vertical expansion candle that shattered initial horizontal layers, the price tapped a local structural resistance ceiling at 0.3300. ​Rather than succumbing to an aggressive distribution dump, the asset has spent subsequent trading blocks carving out a well-defined high-level consolidation flag above the 0.3276 horizontal support shelf. It is currently trading firmly at 0.3290, testing the upper bounds of this accumulation structure despite headline noise tracking over centralized freezes on the network. Dips are being absorbed cleanly by buy-side liquidity, indicating that institutional demand remains in driving control. Short-term bears trying to fight this upward structure face a high risk of being crushed in an accelerating breakout squeeze. If bulls can maintain this defensive shelf and gather enough volume to slice cleanly through the 0.3300 structural roof, it clears a high-probability expansion vector toward fresh macro targets up the tape. ​Trade $TRX here 👇
$TRX — Bounces to 0.3850 or breaks to 0.2950.

​Long $TRX (Or Wait for Breakout Confirmation)

​Entry: 0.3270–0.3290

​SL: 0.3210

​TP1: 0.3340
​TP2: 0.3600
​TP3: 0.3850

​Market Context & Reasoning

​Price action on the 1-hour chart of displays a structurally strong bullish expansion and continuation pattern establishing itself after a solid build-up from an absolute session low at 0.3226. Following a sharp, high-volume vertical expansion candle that shattered initial horizontal layers, the price tapped a local structural resistance ceiling at 0.3300.

​Rather than succumbing to an aggressive distribution dump, the asset has spent subsequent trading blocks carving out a well-defined high-level consolidation flag above the 0.3276 horizontal support shelf. It is currently trading firmly at 0.3290, testing the upper bounds of this accumulation structure despite headline noise tracking over centralized freezes on the network. Dips are being absorbed cleanly by buy-side liquidity, indicating that institutional demand remains in driving control. Short-term bears trying to fight this upward structure face a high risk of being crushed in an accelerating breakout squeeze. If bulls can maintain this defensive shelf and gather enough volume to slice cleanly through the 0.3300 structural roof, it clears a high-probability expansion vector toward fresh macro targets up the tape.

​Trade $TRX here 👇
翻訳参照
$XRP — Bounces to 1.250 or breaks to 0.920. ​Short $XRP (Or Wait for Reversal Confirmation) ​Entry: 1.042–1.058 ​SL: 1.075 ​TP1: 1.026 ​TP2: 0.980 ​TP3: 0.920 ​Market Context & Reasoning ​Price action on the 1-hour chart of demonstrates a prominent distribution sequence rolling over from a local session peak at 1.0740. Following a heavy markdown phase that bottomed out around the internal support layers, the token experienced an aggressive liquidity flush down to an absolute baseline low at 1.0265. ​Buyers staged a brief technical relief bounce from those localized lows, which peaked prematurely beneath the intermediate horizontal supply band near 1.0500. The asset has since rolled over again, printing consecutive red markdown candles to trade at 1.0365. This failure to find follow-through and the subsequent decline represents a classic lower-high structure, signaling that institutional supply remains firmly in control overhead. Traders looking to aggressively bid this dip run a high risk of being caught in a cascading flush. Unless the bulls can generate a major surge in buy volume to reclaim and anchor a support shelf back above 1.0580, this technical structure heavily favors a secondary expansion leg lower to retest the 1.0265 liquidity floor and open the vector for deeper macro discount targets. ​Trade $XRP here 👇
$XRP — Bounces to 1.250 or breaks to 0.920.

​Short $XRP (Or Wait for Reversal Confirmation)

​Entry: 1.042–1.058

​SL: 1.075

​TP1: 1.026
​TP2: 0.980
​TP3: 0.920

​Market Context & Reasoning

​Price action on the 1-hour chart of demonstrates a prominent distribution sequence rolling over from a local session peak at 1.0740. Following a heavy markdown phase that bottomed out around the internal support layers, the token experienced an aggressive liquidity flush down to an absolute baseline low at 1.0265.

​Buyers staged a brief technical relief bounce from those localized lows, which peaked prematurely beneath the intermediate horizontal supply band near 1.0500. The asset has since rolled over again, printing consecutive red markdown candles to trade at 1.0365. This failure to find follow-through and the subsequent decline represents a classic lower-high structure, signaling that institutional supply remains firmly in control overhead. Traders looking to aggressively bid this dip run a high risk of being caught in a cascading flush. Unless the bulls can generate a major surge in buy volume to reclaim and anchor a support shelf back above 1.0580, this technical structure heavily favors a secondary expansion leg lower to retest the 1.0265 liquidity floor and open the vector for deeper macro discount targets.

​Trade $XRP here 👇
翻訳参照
$XLM — Bounces to 0.2250 or breaks to 0.1600. ​Long $XLM (Or Wait for Structural Confirmation) ​Entry: 0.1820–0.1860 ​SL: 0.1780 ​TP1: 0.1920 ​TP2: 0.2080 ​TP3: 0.2250 ​Market Context & Reasoning ​Price action on the 1-hour chart of displays a notable transition phase after finding a significant local baseline low at 0.1820. Prior to this, the asset experienced a steady distribution wave cascading downward from the localized peak at 0.1970, with sellers consistently engineering lower highs and breaking beneath internal macro shelves. ​However, after testing the 0.1820 structural floor, immediate sell-side volume exhausted itself, allowing a strong buy-side response to carve out a clean sequence of rising higher lows. The token is currently executing an expansionary push to trade firmly at 0.1877. This developing curve suggests early stages of buy-side absorption over recent trading sessions. Bears trying to aggressively chase a continuation lower run a high risk of a short-squeeze as downside momentum actively stalls out. If bulls can maintain this defensive posture above the newly formed 0.1850 cluster and muster enough volume to breach the intermediate horizontal resistance at 0.1920, it opens a clear mean-reversion vector to retest the 0.1970 liquidity peak and target higher areas up the tape. ​Trade $XLM here 👇
$XLM — Bounces to 0.2250 or breaks to 0.1600.

​Long $XLM (Or Wait for Structural Confirmation)

​Entry: 0.1820–0.1860

​SL: 0.1780

​TP1: 0.1920
​TP2: 0.2080
​TP3: 0.2250

​Market Context & Reasoning

​Price action on the 1-hour chart of displays a notable transition phase after finding a significant local baseline low at 0.1820. Prior to this, the asset experienced a steady distribution wave cascading downward from the localized peak at 0.1970, with sellers consistently engineering lower highs and breaking beneath internal macro shelves.

​However, after testing the 0.1820 structural floor, immediate sell-side volume exhausted itself, allowing a strong buy-side response to carve out a clean sequence of rising higher lows. The token is currently executing an expansionary push to trade firmly at 0.1877. This developing curve suggests early stages of buy-side absorption over recent trading sessions. Bears trying to aggressively chase a continuation lower run a high risk of a short-squeeze as downside momentum actively stalls out. If bulls can maintain this defensive posture above the newly formed 0.1850 cluster and muster enough volume to breach the intermediate horizontal resistance at 0.1920, it opens a clear mean-reversion vector to retest the 0.1970 liquidity peak and target higher areas up the tape.

​Trade $XLM here 👇
翻訳参照
$XRP — Bounces to 1.350 or breaks to 0.950. ​Short $XRP (Or Wait for Reversal Confirmation) ​Entry: 1.116–1.135 ​SL: 1.165 ​TP1: 1.092 ​TP2: 1.020 ​TP3: 0.950 ​Market Context & Reasoning ​Price action on the 1-hour chart of shows a heavy distribution trend developing after hitting a definitive local session high at 1.1621. Following that peak, severe sell-side volume took control, dragging the price down through multiple internal support bands to map out a clear intraday floor at 1.0923. ​After establishing that temporary bottom, the asset attempted a weak mean-reversion bounce, which ultimately capped out under the broken horizontal liquidity level near 1.1160. The price has rolled over from that relief effort and is currently compressing tightly at 1.1026. This tight consolidation near the bottom of the range forms a classic bearish flag pattern, revealing a significant lack of buy-side follow-through. Bottom-fishers jumping in here face a high risk of getting caught in a trailing flush. Unless bulls can unexpectedly gather enough volume to reclaim and hold above the 1.1160 threshold, this distribution structure heavily favors a secondary expansion leg lower to sweep the 1.0923 floor and open the path toward deeper discount targets. ​Trade $XRP here 👇
$XRP — Bounces to 1.350 or breaks to 0.950.

​Short $XRP (Or Wait for Reversal Confirmation)

​Entry: 1.116–1.135

​SL: 1.165

​TP1: 1.092
​TP2: 1.020
​TP3: 0.950

​Market Context & Reasoning
​Price action on the 1-hour chart of shows a heavy distribution trend developing after hitting a definitive local session high at 1.1621. Following that peak, severe sell-side volume took control, dragging the price down through multiple internal support bands to map out a clear intraday floor at 1.0923.

​After establishing that temporary bottom, the asset attempted a weak mean-reversion bounce, which ultimately capped out under the broken horizontal liquidity level near 1.1160. The price has rolled over from that relief effort and is currently compressing tightly at 1.1026. This tight consolidation near the bottom of the range forms a classic bearish flag pattern, revealing a significant lack of buy-side follow-through. Bottom-fishers jumping in here face a high risk of getting caught in a trailing flush. Unless bulls can unexpectedly gather enough volume to reclaim and hold above the 1.1160 threshold, this distribution structure heavily favors a secondary expansion leg lower to sweep the 1.0923 floor and open the path toward deeper discount targets.

​Trade $XRP here 👇
翻訳参照
$LINK — Bounces to 9.200 or breaks to 7.200. ​Long $LINK (Or Wait for Breakout Confirmation) ​Entry: 7.820–7.920 ​SL: 7.720 ​TP1: 8.107 ​TP2: 8.650 ​TP3: 9.200 ​Market Context & Reasoning ​Price action on the 1-hour chart of displays a resilient base-building and accumulation structure establishing itself after sweeping liquidity down to an absolute session low at 7.781. Following a volatile distribution sequence from the local peak at 8.107, sell-side exhaustion became evident near the structural floor. Buyers have actively stepped in over the recent sessions, absorbing the circulating supply to print a steady sequence of higher structural lows. ​The asset is currently executing an impulsive green expansion candle to press upward into the top quadrant of its localized consolidation block, trading at 7.955. This strong, proactive reaction indicates that buy-side momentum is picking up as it approaches the key overhead horizontal resistance cluster around the 8.000 psychological barrier. Bears attempting to aggressively fade this structure run a high risk of getting caught in an accelerating short-squeeze, as downside pressure has dried up. If bulls can maintain this defensive structure above the 7.890 internal support shelf and comfortably clear the 8.107 swing high with rising volume, it validates a high-probability reversal vector targeting macro liquidity pools higher up the chart. ​Trade $LINK here 👇
$LINK — Bounces to 9.200 or breaks to 7.200.

​Long $LINK (Or Wait for Breakout Confirmation)

​Entry: 7.820–7.920

​SL: 7.720

​TP1: 8.107
​TP2: 8.650
​TP3: 9.200

​Market Context & Reasoning

​Price action on the 1-hour chart of displays a resilient base-building and accumulation structure establishing itself after sweeping liquidity down to an absolute session low at 7.781. Following a volatile distribution sequence from the local peak at 8.107, sell-side exhaustion became evident near the structural floor. Buyers have actively stepped in over the recent sessions, absorbing the circulating supply to print a steady sequence of higher structural lows.

​The asset is currently executing an impulsive green expansion candle to press upward into the top quadrant of its localized consolidation block, trading at 7.955. This strong, proactive reaction indicates that buy-side momentum is picking up as it approaches the key overhead horizontal resistance cluster around the 8.000 psychological barrier. Bears attempting to aggressively fade this structure run a high risk of getting caught in an accelerating short-squeeze, as downside pressure has dried up. If bulls can maintain this defensive structure above the 7.890 internal support shelf and comfortably clear the 8.107 swing high with rising volume, it validates a high-probability reversal vector targeting macro liquidity pools higher up the chart.

​Trade $LINK here 👇
翻訳参照
$XLM — Bounces to 0.2450 or breaks to 0.1650. ​Long $XLM (Or Wait for Structural Confirmation) ​Entry: 0.1850–0.1920 ​SL: 0.1800 ​TP1: 0.2080 ​TP2: 0.2250 ​TP3: 0.2450 ​Market Context & Reasoning ​Price action on the 1-hour chart of shows an interesting transition phase after finding a significant macro baseline low near 0.1850. Following a steep distribution cascade from the local session peak at 0.2123, sellers exhausted their momentum at the absolute lows, allowing buyers to step in and trigger an aggressive, V-shaped relief rally back into the mid-range. A secondary cooling-off phase printed a shallow lower-high and subsequent dip, but bulls managed to form a clean higher-low structure above the previous floor. ​The asset is currently recovering from that secondary dip, ticking up to compress near 0.1968. This structural development hints at building buy-side absorption over the last few sessions. While short-term sellers might attempt to push down from overhead minor resistance around 0.2050, chasing a short here carries risk as downside momentum is actively stalling out. If bulls can firmly hold the newly established higher-low zone and capture enough volume to clear the 0.2050 intermediate hurdle, this consolidation base favors an expansion vector to retest the 0.2123 peak and aim for macro targets higher up the tape. ​Trade $XLM here 👇
$XLM — Bounces to 0.2450 or breaks to 0.1650.

​Long $XLM (Or Wait for Structural Confirmation)
​Entry: 0.1850–0.1920

​SL: 0.1800
​TP1: 0.2080
​TP2: 0.2250
​TP3: 0.2450

​Market Context & Reasoning

​Price action on the 1-hour chart of shows an interesting transition phase after finding a significant macro baseline low near 0.1850. Following a steep distribution cascade from the local session peak at 0.2123, sellers exhausted their momentum at the absolute lows, allowing buyers to step in and trigger an aggressive, V-shaped relief rally back into the mid-range. A secondary cooling-off phase printed a shallow lower-high and subsequent dip, but bulls managed to form a clean higher-low structure above the previous floor.

​The asset is currently recovering from that secondary dip, ticking up to compress near 0.1968. This structural development hints at building buy-side absorption over the last few sessions. While short-term sellers might attempt to push down from overhead minor resistance around 0.2050, chasing a short here carries risk as downside momentum is actively stalling out. If bulls can firmly hold the newly established higher-low zone and capture enough volume to clear the 0.2050 intermediate hurdle, this consolidation base favors an expansion vector to retest the 0.2123 peak and aim for macro targets higher up the tape.

​Trade $XLM here 👇
翻訳参照
$LINK — Bounces to 9.200 or breaks to 7.200. ​Long $LINK (Or Wait for Breakout Confirmation) ​Entry: 7.820–7.920 ​SL: 7.720 ​TP1: 8.107 ​TP2: 8.650 ​TP3: 9.200 ​Market Context & Reasoning ​Price action on the 1-hour chart of displays a resilient base-building and accumulation structure establishing itself after sweeping liquidity down to an absolute session low at 7.781. Following a volatile distribution sequence from the local peak at 8.107, sell-side exhaustion became evident near the structural floor. Buyers have actively stepped in over the recent sessions, absorbing the circulating supply to print a steady sequence of higher structural lows. ​The asset is currently executing an impulsive green expansion candle to press upward into the top quadrant of its localized consolidation block, trading at 7.955. This strong, proactive reaction indicates that buy-side momentum is picking up as it approaches the key overhead horizontal resistance cluster around the 8.000 psychological barrier. Bears attempting to aggressively fade this structure run a high risk of getting caught in an accelerating short-squeeze, as downside pressure has dried up. If bulls can maintain this defensive structure above the 7.890 internal support shelf and comfortably clear the 8.107 swing high with rising volume, it validates a high-probability reversal vector targeting macro liquidity pools higher up the chart. ​Trade $LINK here 👇
$LINK — Bounces to 9.200 or breaks to 7.200.

​Long $LINK (Or Wait for Breakout Confirmation)

​Entry: 7.820–7.920

​SL: 7.720

​TP1: 8.107
​TP2: 8.650
​TP3: 9.200

​Market Context & Reasoning
​Price action on the 1-hour chart of displays a resilient base-building and accumulation structure establishing itself after sweeping liquidity down to an absolute session low at 7.781. Following a volatile distribution sequence from the local peak at 8.107, sell-side exhaustion became evident near the structural floor. Buyers have actively stepped in over the recent sessions, absorbing the circulating supply to print a steady sequence of higher structural lows.

​The asset is currently executing an impulsive green expansion candle to press upward into the top quadrant of its localized consolidation block, trading at 7.955. This strong, proactive reaction indicates that buy-side momentum is picking up as it approaches the key overhead horizontal resistance cluster around the 8.000 psychological barrier. Bears attempting to aggressively fade this structure run a high risk of getting caught in an accelerating short-squeeze, as downside pressure has dried up. If bulls can maintain this defensive structure above the 7.890 internal support shelf and comfortably clear the 8.107 swing high with rising volume, it validates a high-probability reversal vector targeting macro liquidity pools higher up the chart.

​Trade $LINK here 👇
翻訳参照
$XLM — Bounces to 0.2650 or breaks to 0.1950. ​Long $XLM (Or Wait for Breakout Confirmation) ​Entry: 0.2150–0.2220 ​SL: 0.2080 ​TP1: 0.2330 ​TP2: 0.2480 ​TP3: 0.2650 ​Market Context & Reasoning ​Price action on the 1-hour chart of displays a healthy, structurally sound consolidation base establishing itself after a massive vertical expansion away from the 0.1887 session low. Following that initial high-volume surge to 0.2330, the asset didn't suffer a deep distribution flush; instead, it has spent subsequent trading sessions building a sequence of higher structural lows, fluctuating within a well-defined consolidation range. ​The token is currently pushing back into the upper half of its accumulation structure, trading firmly at 0.2256. This price action demonstrates strong buy-side absorption, as dips are being aggressively bought well before retesting the lower macro liquidity bands. Short-term bears attempting to force a reversal here face significant risk of an upward short-squeeze, as overhead sell momentum is systematically drying up. If bulls can maintain this defensive posture above the 0.2180 structural shelf and gather enough volume to break the horizontal ceiling at 0.2330, it clears the path for a strong secondary expansion leg toward fresh macro targets up the tape. ​Trade $XLM here 👇
$XLM — Bounces to 0.2650 or breaks to 0.1950.

​Long $XLM (Or Wait for Breakout Confirmation)

​Entry: 0.2150–0.2220

​SL: 0.2080

​TP1: 0.2330
​TP2: 0.2480
​TP3: 0.2650

​Market Context & Reasoning

​Price action on the 1-hour chart of displays a healthy, structurally sound consolidation base establishing itself after a massive vertical expansion away from the 0.1887 session low. Following that initial high-volume surge to 0.2330, the asset didn't suffer a deep distribution flush; instead, it has spent subsequent trading sessions building a sequence of higher structural lows, fluctuating within a well-defined consolidation range.

​The token is currently pushing back into the upper half of its accumulation structure, trading firmly at 0.2256. This price action demonstrates strong buy-side absorption, as dips are being aggressively bought well before retesting the lower macro liquidity bands. Short-term bears attempting to force a reversal here face significant risk of an upward short-squeeze, as overhead sell momentum is systematically drying up. If bulls can maintain this defensive posture above the 0.2180 structural shelf and gather enough volume to break the horizontal ceiling at 0.2330, it clears the path for a strong secondary expansion leg toward fresh macro targets up the tape.

​Trade $XLM here 👇
翻訳参照
$LINK — Bounces to 9.500 or breaks to 7.400. ​Short $LINK (Or Wait for Reversal Confirmation) ​Entry: 8.330–8.450 ​SL: 8.650 ​TP1: 8.120 ​TP2: 7.800 ​TP3: 7.400 ​Market Context & Reasoning ​Price action on the 1-hour chart of displays a prominent distribution sequence rolling over from a local session peak at 8.571. Following a strong, volume-backed impulse wave that expanded upward from the absolute baseline low at 7.793, buy-side momentum completely exhausted itself at the highs. Sizable waves of sell pressure have since systematically forced a steep markdown phase, carving out a steady sequence of lower highs and slicing through local intermediate support levels. ​The asset has paused its sharp descent to find temporary stabilization, compressing tightly around 8.202. This minor horizontal pause is tracking as a classic bearish flag consolidation resting right below the newly broken structural shelf at 8.330, despite positive news flashes regarding expanding network utilities. Bottom-fishers attempting to aggressively front-run a reversal here run a high risk of getting trapped by active distribution layers that remain in firm control overhead. Unless bulls can generate a rapid, high-volume reclamation back above the 8.330 zone, this technical compression heavily favors a secondary continuation leg lower to challenge the lower support shelves and open up deeper macro discount targets. ​Trade $LINK here 👇
$LINK — Bounces to 9.500 or breaks to 7.400.

​Short $LINK (Or Wait for Reversal Confirmation)

​Entry: 8.330–8.450

​SL: 8.650

​TP1: 8.120
​TP2: 7.800
​TP3: 7.400

​Market Context & Reasoning
​Price action on the 1-hour chart of displays a prominent distribution sequence rolling over from a local session peak at 8.571. Following a strong, volume-backed impulse wave that expanded upward from the absolute baseline low at 7.793, buy-side momentum completely exhausted itself at the highs. Sizable waves of sell pressure have since systematically forced a steep markdown phase, carving out a steady sequence of lower highs and slicing through local intermediate support levels.

​The asset has paused its sharp descent to find temporary stabilization, compressing tightly around 8.202. This minor horizontal pause is tracking as a classic bearish flag consolidation resting right below the newly broken structural shelf at 8.330, despite positive news flashes regarding expanding network utilities. Bottom-fishers attempting to aggressively front-run a reversal here run a high risk of getting trapped by active distribution layers that remain in firm control overhead. Unless bulls can generate a rapid, high-volume reclamation back above the 8.330 zone, this technical compression heavily favors a secondary continuation leg lower to challenge the lower support shelves and open up deeper macro discount targets.

​Trade $LINK here 👇
翻訳参照
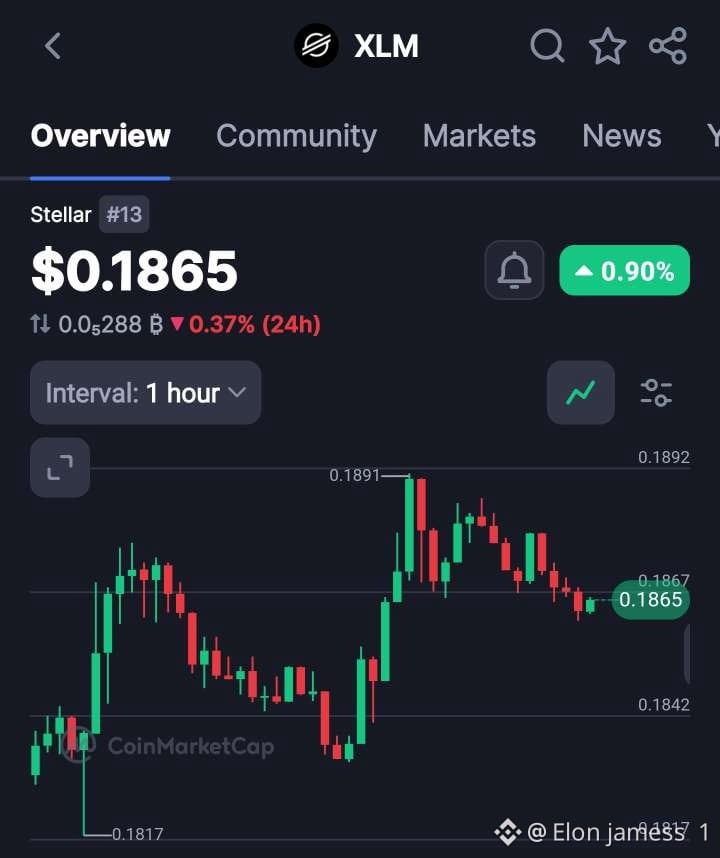
$XLM — Bounces to 0.2350 or breaks to 0.1650. ​Long $XLM (Or Wait for Breakout Confirmation) ​Entry: 0.1850–0.1910 ​SL: 0.1800 ​TP1: 0.1988 ​TP2: 0.2150 ​TP3: 0.2350 ​Market Context & Reasoning ​Price action on the 1-hour chart of shows an accumulation base establishing itself after printing an absolute session low at 0.1813. Sizable waves of buy volume have systematically stepped in to carve out a clean sequence of higher lows. Recently, an aggressive vertical impulse candle pierced overhead horizontal supply thresholds to print a local intraday high at 0.1988, demonstrating an explicit burst of buy-side momentum. ​The asset has since entered a mild upper-range cooling-off phase, ticking down to stabilize near 0.1921. This retracement is tracking as a healthy technical retest of the broken structural resistance tier, turning it into a newly formed support shelf. Bears trying to aggressively fade this macro structure run a heavy liquidation risk, as immediate sell momentum has dried up. If bulls can firmly hold this internal baseline above the 0.1870 cluster, it forms a high-probability launchpad for a secondary continuation expansion leg to retest the 0.1988 liquidity peak and target higher targets up the tape. ​Trade $XLM here 👇
$XLM — Bounces to 0.2350 or breaks to 0.1650.

​Long $XLM (Or Wait for Breakout Confirmation)

​Entry: 0.1850–0.1910

​SL: 0.1800

​TP1: 0.1988
​TP2: 0.2150
​TP3: 0.2350

​Market Context & Reasoning

​Price action on the 1-hour chart of shows an accumulation base establishing itself after printing an absolute session low at 0.1813. Sizable waves of buy volume have systematically stepped in to carve out a clean sequence of higher lows. Recently, an aggressive vertical impulse candle pierced overhead horizontal supply thresholds to print a local intraday high at 0.1988, demonstrating an explicit burst of buy-side momentum.

​The asset has since entered a mild upper-range cooling-off phase, ticking down to stabilize near 0.1921. This retracement is tracking as a healthy technical retest of the broken structural resistance tier, turning it into a newly formed support shelf. Bears trying to aggressively fade this macro structure run a heavy liquidation risk, as immediate sell momentum has dried up. If bulls can firmly hold this internal baseline above the 0.1870 cluster, it forms a high-probability launchpad for a secondary continuation expansion leg to retest the 0.1988 liquidity peak and target higher targets up the tape.

​Trade $XLM here 👇
翻訳参照
$XLM — Bounces to 0.2450 or breaks to 0.1650. ​Long $XLM (Or Wait for Structural Confirmation) ​Entry: 0.1850–0.1920 ​SL: 0.1800 ​TP1: 0.2080 ​TP2: 0.2250 ​TP3: 0.2450 ​Market Context & Reasoning ​Price action on the 1-hour chart of shows an interesting transition phase after finding a significant macro baseline low near 0.1850. Following a steep distribution cascade from the local session peak at 0.2123, sellers exhausted their momentum at the absolute lows, allowing buyers to step in and trigger an aggressive, V-shaped relief rally back into the mid-range. A secondary cooling-off phase printed a shallow lower-high and subsequent dip, but bulls managed to form a clean higher-low structure above the previous floor. ​The asset is currently recovering from that secondary dip, ticking up to compress near 0.1968. This structural development hints at building buy-side absorption over the last few sessions. While short-term sellers might attempt to push down from overhead minor resistance around 0.2050, chasing a short here carries risk as downside momentum is actively stalling out. If bulls can firmly hold the newly established higher-low zone and capture enough volume to clear the 0.2050 intermediate hurdle, this consolidation base favors an expansion vector to retest the 0.2123 peak and aim for macro targets higher up the tape. ​Trade $XLM here 👇
$XLM — Bounces to 0.2450 or breaks to 0.1650.

​Long $XLM (Or Wait for Structural Confirmation)
​Entry: 0.1850–0.1920

​SL: 0.1800

​TP1: 0.2080
​TP2: 0.2250
​TP3: 0.2450

​Market Context & Reasoning

​Price action on the 1-hour chart of shows an interesting transition phase after finding a significant macro baseline low near 0.1850. Following a steep distribution cascade from the local session peak at 0.2123, sellers exhausted their momentum at the absolute lows, allowing buyers to step in and trigger an aggressive, V-shaped relief rally back into the mid-range. A secondary cooling-off phase printed a shallow lower-high and subsequent dip, but bulls managed to form a clean higher-low structure above the previous floor.

​The asset is currently recovering from that secondary dip, ticking up to compress near 0.1968. This structural development hints at building buy-side absorption over the last few sessions. While short-term sellers might attempt to push down from overhead minor resistance around 0.2050, chasing a short here carries risk as downside momentum is actively stalling out. If bulls can firmly hold the newly established higher-low zone and capture enough volume to clear the 0.2050 intermediate hurdle, this consolidation base favors an expansion vector to retest the 0.2123 peak and aim for macro targets higher up the tape.

​Trade $XLM here 👇
ログインして、さらにコンテンツを読む
厳選トピックで世界の暗号資産トレーダーの仲間入り
⚡️ 暗号資産に関する最新かつ有益な情報が見つかります。
💬 世界最大の暗号資産取引所から信頼されています。
👍 認証を受けたクリエイターから、有益なインサイトを得られます。
メール / 電話番号
サイトマップ
Cookieの設定
プラットフォーム利用規約