
CryptoOG 1
408 投稿

CryptoOG 1
報告
ユーザーをブロック
Crypto Expert 📈 || Web3 Alpha 📊 || Moderator 🖥
0 フォロー
2 フォロワー
18 いいね
投稿
·
--
翻訳参照
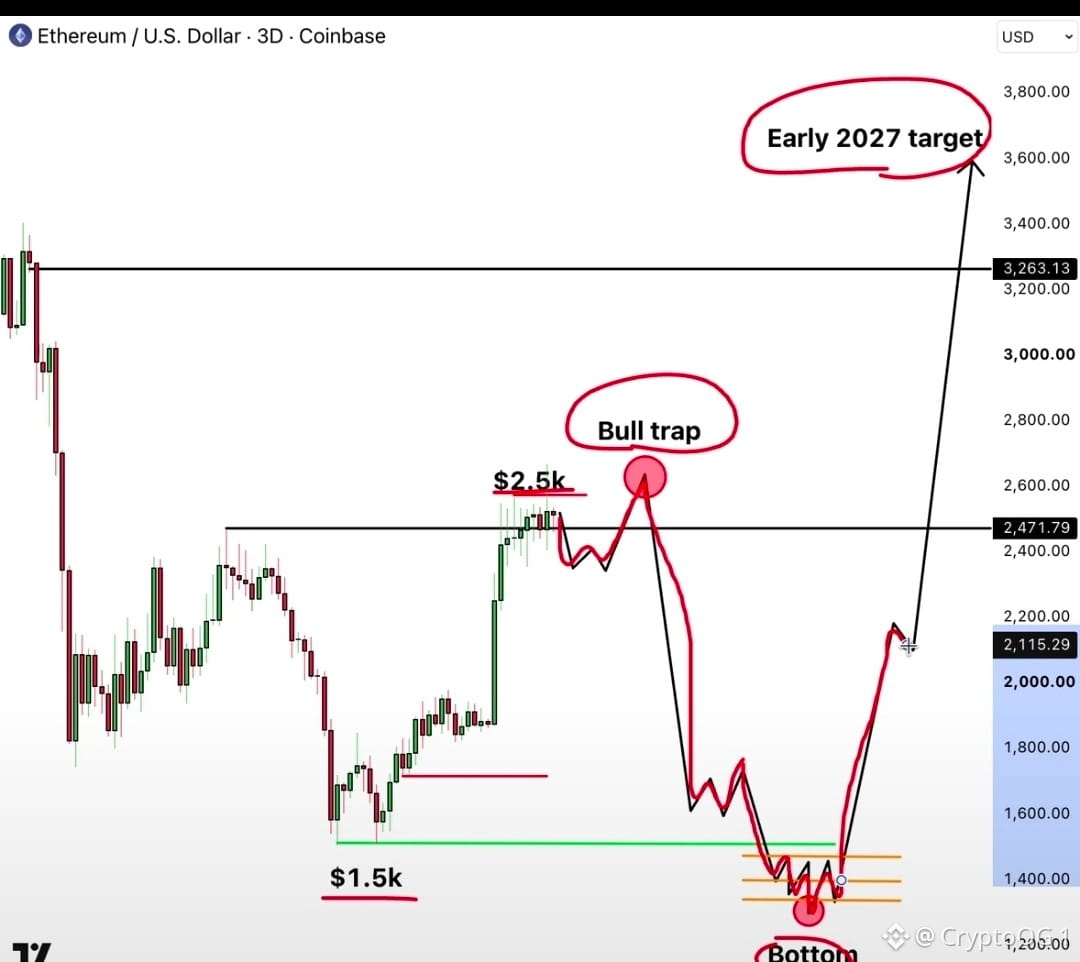
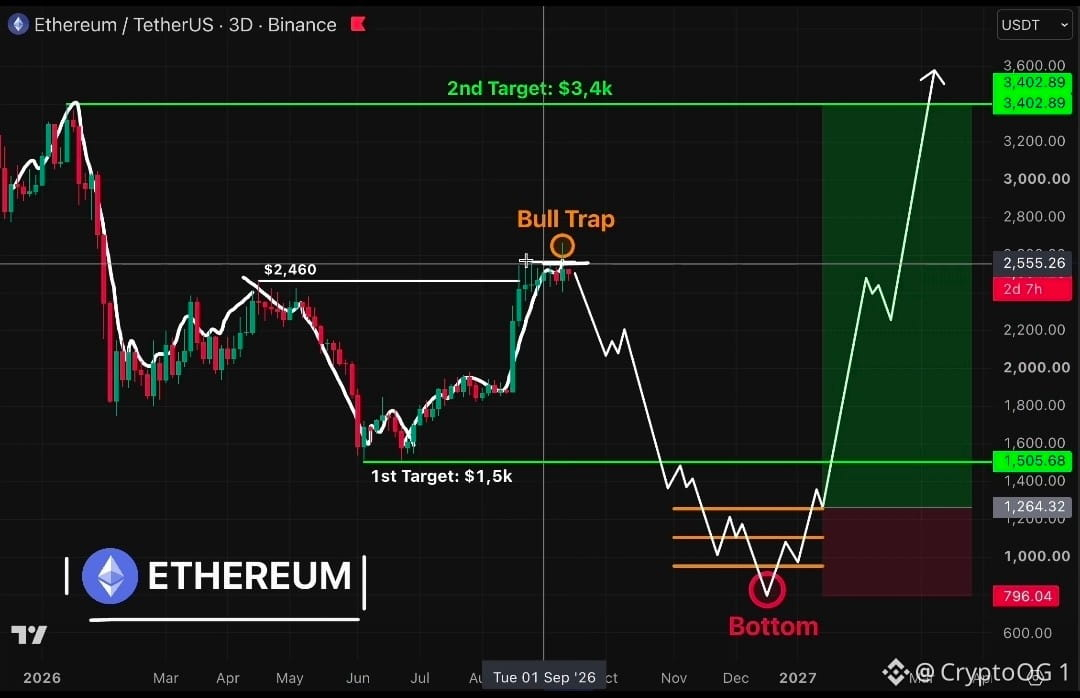
My $ETH roadmap for 2026-2027: 1. Final bull trap around $2,670 2. Drop to $1,800 then $1,500 3. Bottom forms, accumulation begins 4. Break above $1,600 confirms bull run 5. Rally above $3,250 by Q2-Q3 2027 Bottom expected November-December 2026 Turn notifications on next call is loading
My $ETH roadmap for 2026-2027: 1. Final bull trap around $2,670 2. Drop to $1,800 then $1,500 3. Bottom forms, accumulation begins 4. Break above $1,600 confirms bull run 5. Rally above $3,250 by Q2-Q3 2027 Bottom expected November-December 2026 Turn notifications on next call is loading
59
·
--
🚨 $ETHの最終的な強気トラップが仕掛けられました 皆が $2,660 をつけた後に強気相場(ブルラン)だと大騒ぎしてます このゾーンでトラップが形成されていくのが見えます… 次の一手で、何か月もの利益が完全に吹き飛ぶ可能性があります これが私のマーケットプランです: $2,670 → 最終的な強気トラップ ✅ $1,800 → 最初の主要なフラッシュ $1,500 → パニック売り(キャピチュレーション)ゾーン 11〜12月 → サイクル底 $1,600 を奪還 → ブルラン開始 $3,250+ → 2027年Q2〜Q3 の目標 最初の下落を買ってしまうのがよくあるミスです 底が形成される“最後の動き”まで待ちます。そうしてから買います… そして私が ETH を買い始めたら、回復が明白になる前にここに投稿します 通知をONにして、この投稿をブックマーク… 次の私のコールは、すでに値動きが終わった後に掴みたくないはず
🚨 $ETHの最終的な強気トラップが仕掛けられました 皆が $2,660 をつけた後に強気相場(ブルラン)だと大騒ぎしてます このゾーンでトラップが形成されていくのが見えます… 次の一手で、何か月もの利益が完全に吹き飛ぶ可能性があります これが私のマーケットプランです: $2,670 → 最終的な強気トラップ ✅ $1,800 → 最初の主要なフラッシュ $1,500 → パニック売り(キャピチュレーション)ゾーン 11〜12月 → サイクル底 $1,600 を奪還 → ブルラン開始 $3,250+ → 2027年Q2〜Q3 の目標 最初の下落を買ってしまうのがよくあるミスです 底が形成される“最後の動き”まで待ちます。そうしてから買います… そして私が ETH を買い始めたら、回復が明白になる前にここに投稿します 通知をONにして、この投稿をブックマーク… 次の私のコールは、すでに値動きが終わった後に掴みたくないはず
37
·
--
翻訳参照
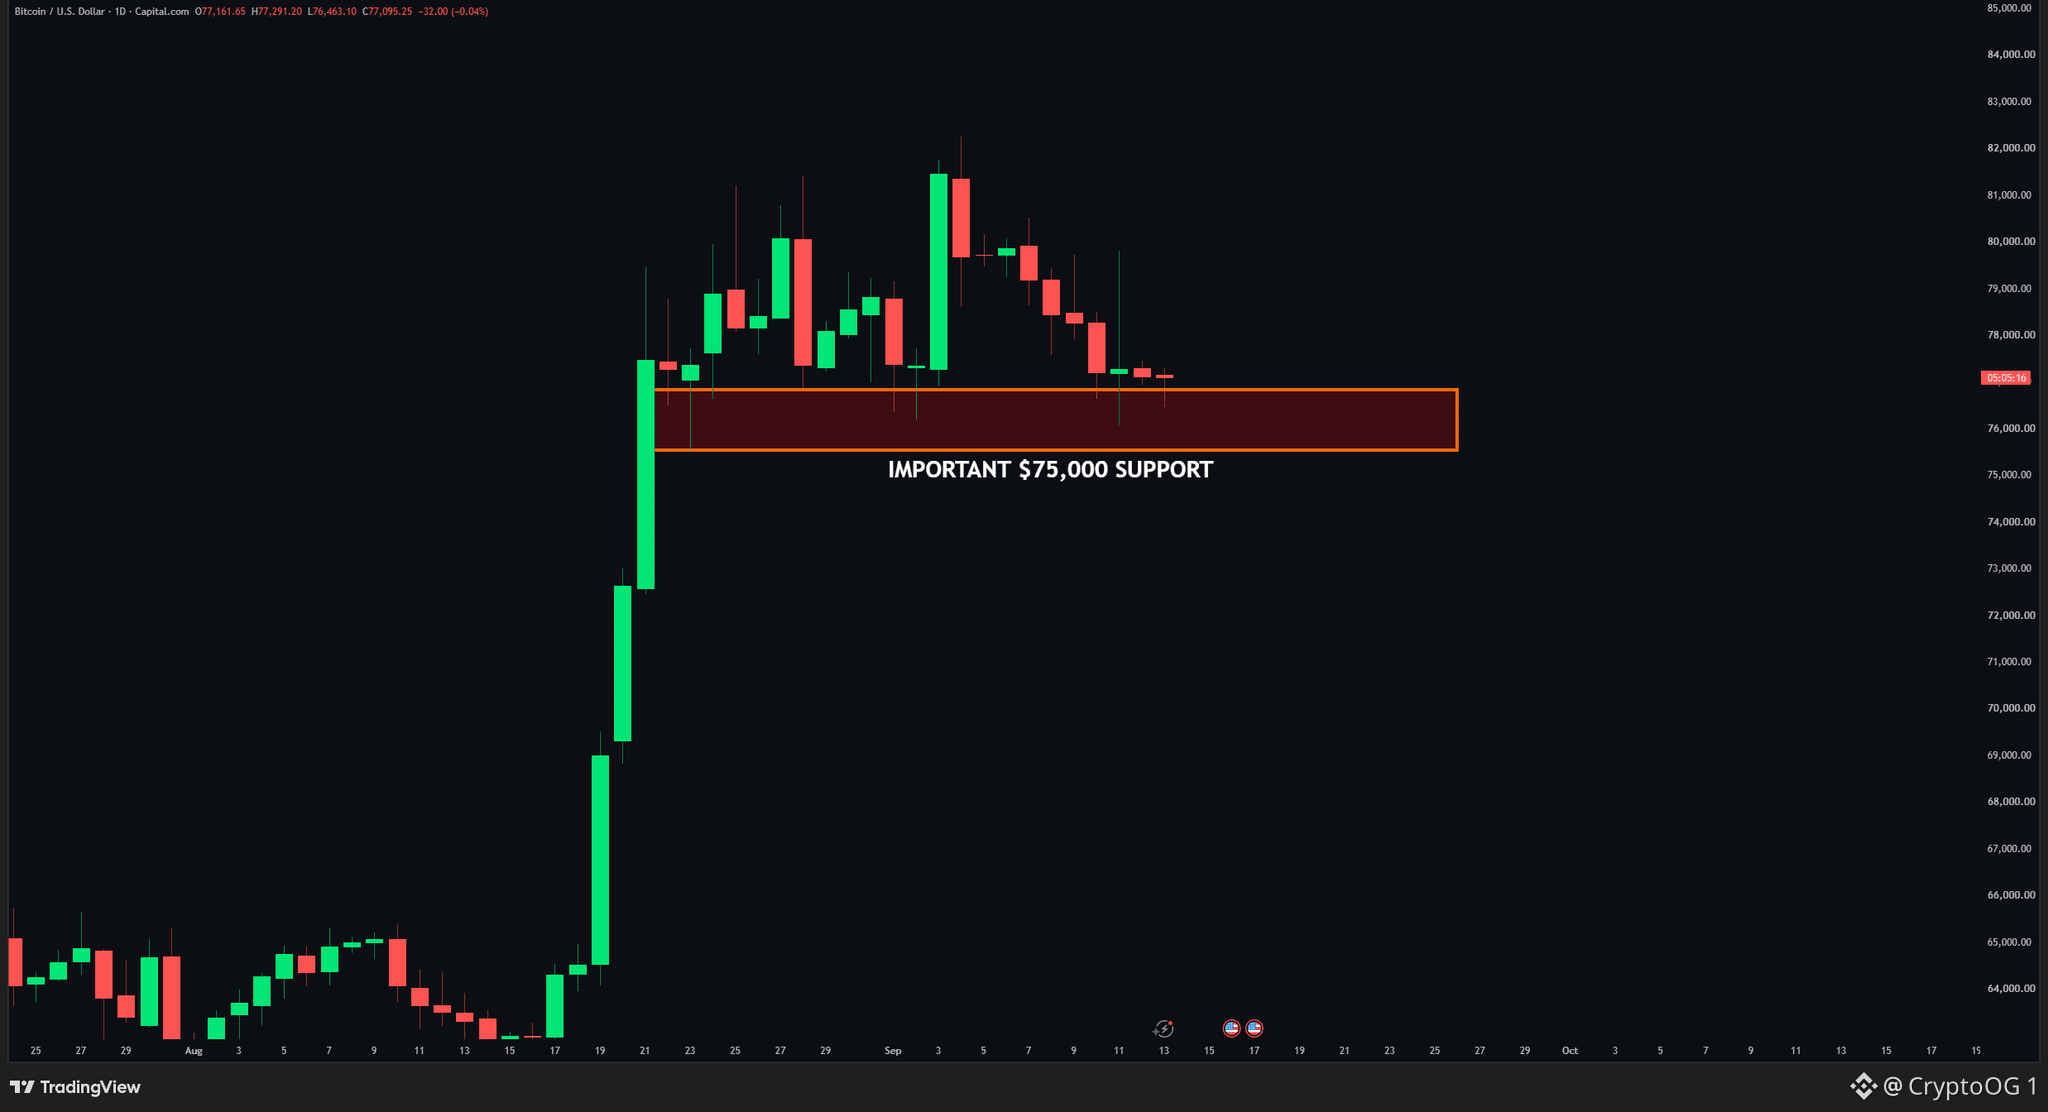
$BTC IS APPROACHING THE $75K DECISION ZONE. 👀 After the strong breakout, BTC has been grinding lower and is now coming back toward the $75,000 support zone. This level is extremely important: HOLD $75K → bullish structure remains intact 🚀 LOSE $75K → deeper correction likely 🔻 We’ve already seen multiple reactions from this area, which makes the current test even more important. BTC doesn’t need to go straight up from here. It just needs to defend $75K. $75K = the line in the sand. 👀
$BTC IS APPROACHING THE $75K DECISION ZONE. 👀 After the strong breakout, BTC has been grinding lower and is now coming back toward the $75,000 support zone. This level is extremely important: HOLD $75K → bullish structure remains intact 🚀 LOSE $75K → deeper correction likely 🔻 We’ve already seen multiple reactions from this area, which makes the current test even more important. BTC doesn’t need to go straight up from here. It just needs to defend $75K. $75K = the line in the sand. 👀
49
·
--
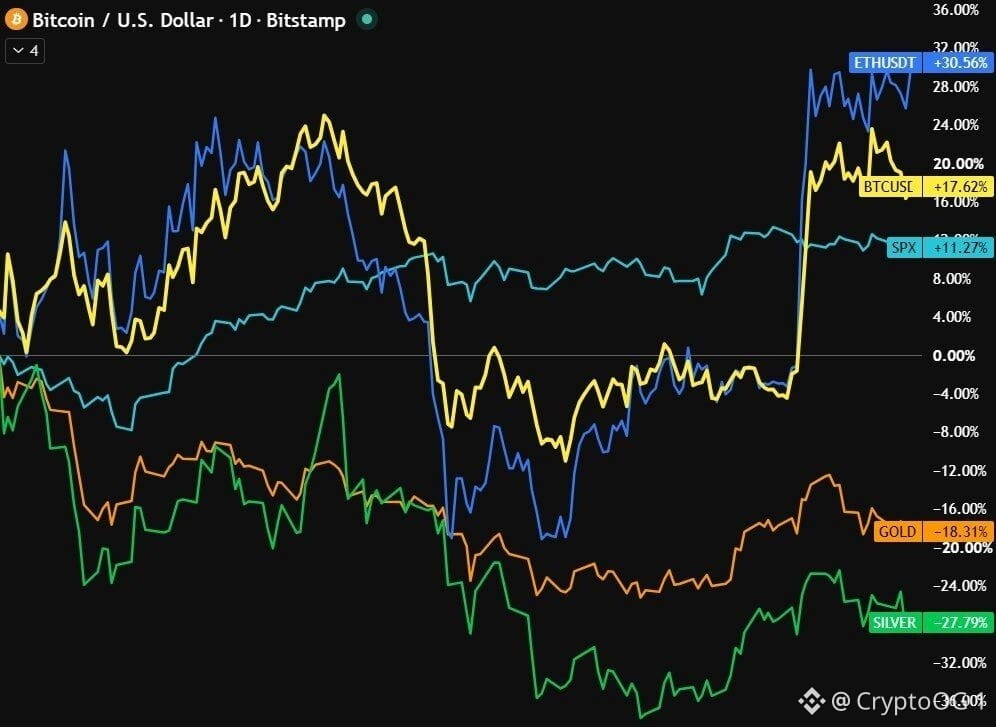
🚨 興味深い: 米国とイランの戦争が始まったときに10Kドル投資していれば、現在の価値は: $ETH : $13,056 $BTC : $11,762 S&P 500: $11,270 金: $8,200 銀: $7,310
🚨 興味深い: 米国とイランの戦争が始まったときに10Kドル投資していれば、現在の価値は: $ETH : $13,056 $BTC : $11,762 S&P 500: $11,270 金: $8,200 銀: $7,310
81
·
--
翻訳参照
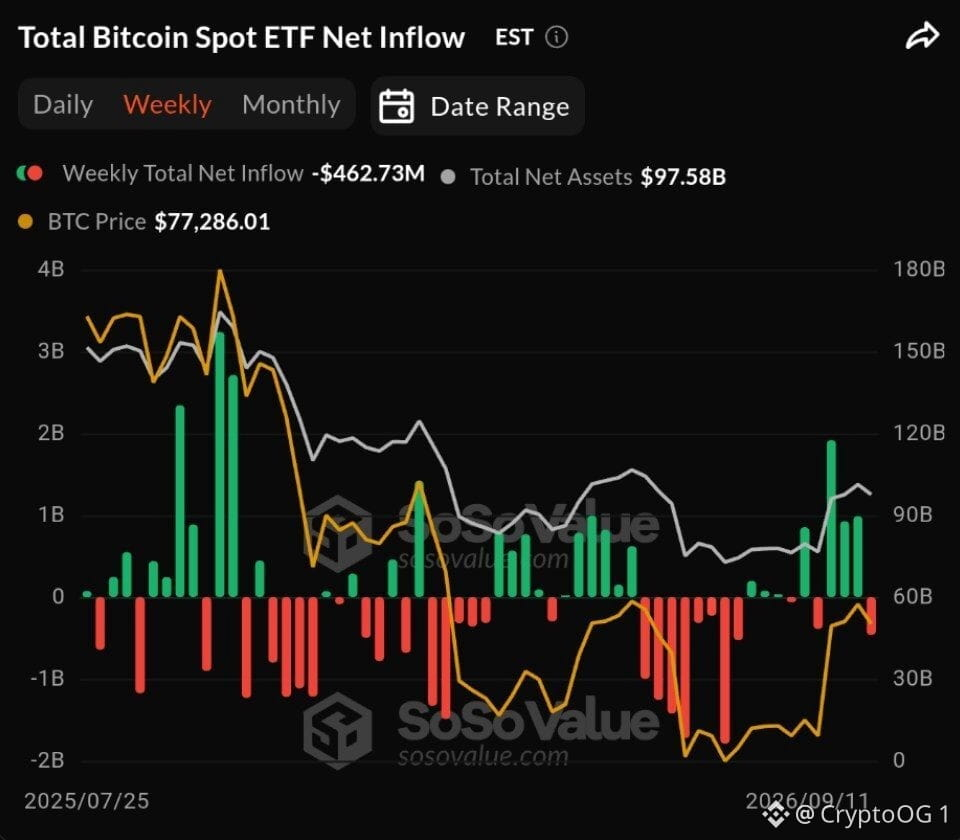
🚨 ETFS: The $BTC ETFs failed to see a 4th week of net inflows with almost every day this week seeing another net outflow.
🚨 ETFS: The $BTC ETFs failed to see a 4th week of net inflows with almost every day this week seeing another net outflow.
29
·
--
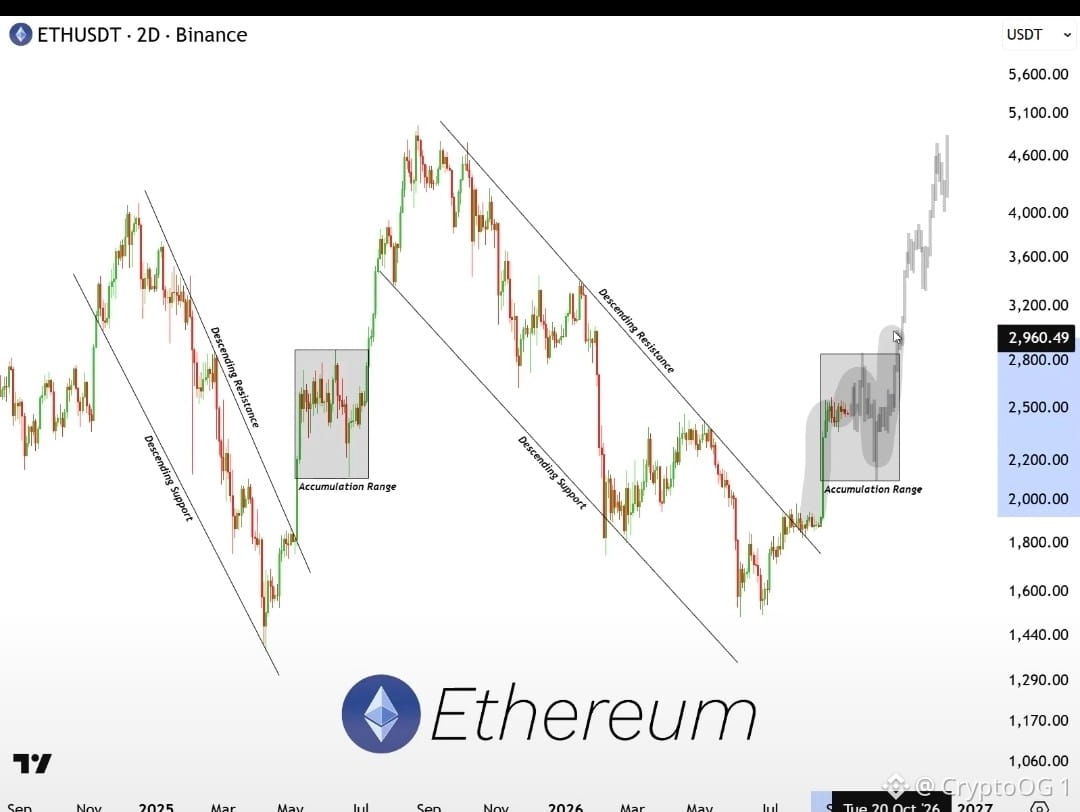
🚨 #イーサリアム はまもなく $3,000 に戻る。しかも、何か月もかかるとは思っていない。目標は明確だ:30日以内に $3,000。$ETH が作っているのは、弱気トレンドの反転と強気相場の開始であることがはっきりしている。弱気相場はもう終わっている。蓄積局面は過ぎた。次は拡大フェーズが始まる。📈 ETH → 11月までに $3,000。そしてこれは始まりにすぎない。イーサリアムは戻ってきた。🦇
🚨 #イーサリアム はまもなく $3,000 に戻る。しかも、何か月もかかるとは思っていない。目標は明確だ:30日以内に $3,000。$ETH が作っているのは、弱気トレンドの反転と強気相場の開始であることがはっきりしている。弱気相場はもう終わっている。蓄積局面は過ぎた。次は拡大フェーズが始まる。📈 ETH → 11月までに $3,000。そしてこれは始まりにすぎない。イーサリアムは戻ってきた。🦇
50
·
--
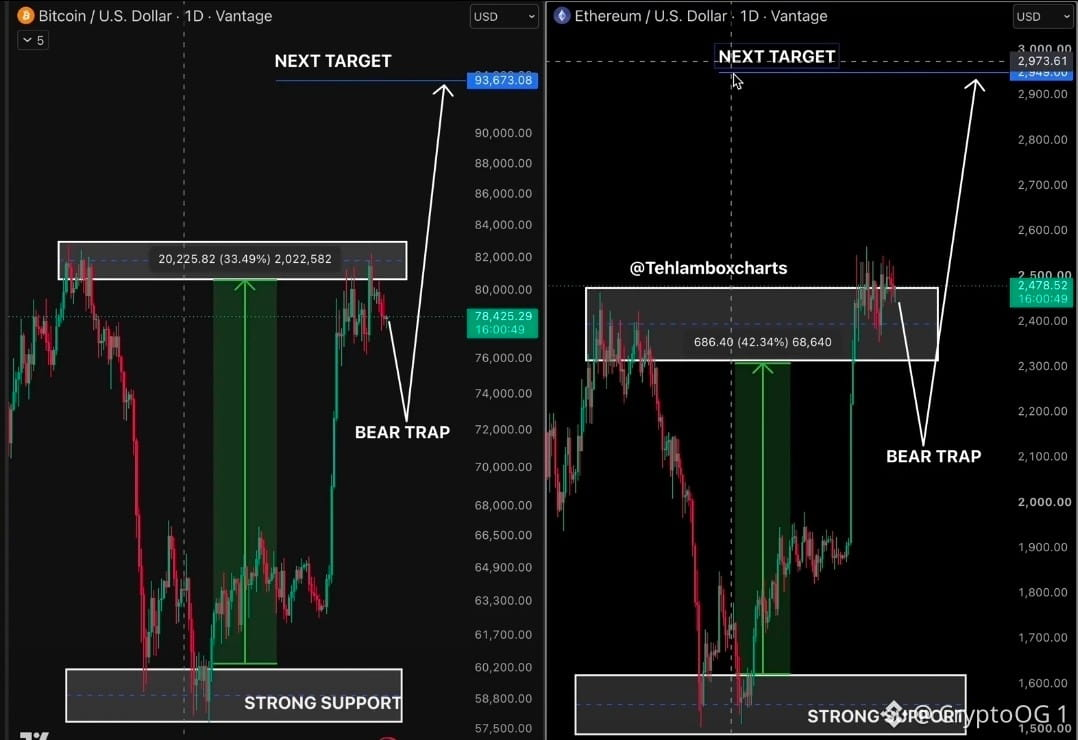
$BTC と$ETH は同じ些細な犯罪を犯そうとしている どちらも拒否された どちらも後退した どちらも現在は強いレジスタンス上にいる しかしチャートは潜在的なベアトラップの可能性を示している → BTC目標:9,360万ドル → ETH目標:29.5億ドル 突然下げ(ディップ)を狙ってきた 退出時の流動性(イグジット・リクイディティ)になる可能性がある すべてをオープンに、明確に共有する フォローして、通知をオンにして。
$BTC と$ETH は同じ些細な犯罪を犯そうとしている どちらも拒否された どちらも後退した どちらも現在は強いレジスタンス上にいる しかしチャートは潜在的なベアトラップの可能性を示している → BTC目標:9,360万ドル → ETH目標:29.5億ドル 突然下げ(ディップ)を狙ってきた 退出時の流動性(イグジット・リクイディティ)になる可能性がある すべてをオープンに、明確に共有する フォローして、通知をオンにして。
24
·
--
翻訳参照
Based on historical data…… The “1,064/365 Bitcoin $BTC Cycle Theory” claims: * Bitcoin rises for approximately 1,064 days from a major bottom to a cycle top. * It then declines for roughly 364–365 days. * Bitcoin reportedly peaked around October 6, 2025. #BTC Price Analysis# * Adding 364–365 days points to approximately October 5–6, 2026 as the theoretical bottom. * So technically starting October, the market will experience a massive shift.
Based on historical data…… The “1,064/365 Bitcoin $BTC Cycle Theory” claims: * Bitcoin rises for approximately 1,064 days from a major bottom to a cycle top. * It then declines for roughly 364–365 days. * Bitcoin reportedly peaked around October 6, 2025. #BTC Price Analysis# * Adding 364–365 days points to approximately October 5–6, 2026 as the theoretical bottom. * So technically starting October, the market will experience a massive shift.

35
·
--
🚨 ビットコイン $BTC は、2022年に皆を打ち砕いたのと同じ動きが再現されようとしています 私が警告した“強気トラップ”は、79,000ドルで出尽くしました。 さあ、2022年に何が起きたか見てください。 このパターンが繰り返され続けるなら、ビットコインは今後30日で57,000ドルへ向かう見通しです。 2027年じゃない。 “いずれ”でもない。 30日 パターンはほぼ同一です。 強気トラップ → 流通(分配)→ 急落 → 投げ売り(キャピチュレーション) このツイートをブックマークしてください。 6万ドルを下回って取引されるようになったら戻ってきてください。 2022年、私は1万7,000ドルの底を一般公開しました。 2025年には、12万6,000ドルのピークを指摘しました。 そしてこの市場をまた買い始めるときは、群衆が底だと気づく“前”に、ここで共有します。 フォローして通知をオンにしてください。 次の投稿を見逃したくないはずです。 その動きが起きた後にご確認ください。
🚨 ビットコイン $BTC は、2022年に皆を打ち砕いたのと同じ動きが再現されようとしています 私が警告した“強気トラップ”は、79,000ドルで出尽くしました。 さあ、2022年に何が起きたか見てください。 このパターンが繰り返され続けるなら、ビットコインは今後30日で57,000ドルへ向かう見通しです。 2027年じゃない。 “いずれ”でもない。 30日 パターンはほぼ同一です。 強気トラップ → 流通(分配)→ 急落 → 投げ売り(キャピチュレーション) このツイートをブックマークしてください。 6万ドルを下回って取引されるようになったら戻ってきてください。 2022年、私は1万7,000ドルの底を一般公開しました。 2025年には、12万6,000ドルのピークを指摘しました。 そしてこの市場をまた買い始めるときは、群衆が底だと気づく“前”に、ここで共有します。 フォローして通知をオンにしてください。 次の投稿を見逃したくないはずです。 その動きが起きた後にご確認ください。

43
·
--
翻訳参照
#ADA /USDT forming a clear triangle pattern 👀📐 Price is compressing around $0.20–$0.23, showing a tight battle between buyers and sellers. A breakout above $0.23 could trigger the next expansion move toward $0.32 📈🔥 Momentum is building as the range gets tighter. Bulls are waiting for the breakout. $ADA #ADA
#ADA /USDT forming a clear triangle pattern 👀📐 Price is compressing around $0.20–$0.23, showing a tight battle between buyers and sellers. A breakout above $0.23 could trigger the next expansion move toward $0.32 📈🔥 Momentum is building as the range gets tighter. Bulls are waiting for the breakout. $ADA #ADA

49
·
--
🚨 ビットコインまであと26日 このサイクルは一度も失敗したことがない $BTCを買え トップから365日後に $BTCを売れ ボトムから1,065日後に 3回のサイクル 3回とも完璧に的中 例外なし 今は365日のうち339日目 つまりビットコインがサイクルのボトムを形成するまで、ちょうど26日 もし安値が来れば、4年サイクルは再び生き残る もし来なければ、ビットコインの最も信頼できるパターンのひとつが正式にDEAD このチャートを保存 次の26日がすべてを決める
🚨 ビットコインまであと26日 このサイクルは一度も失敗したことがない $BTCを買え トップから365日後に $BTCを売れ ボトムから1,065日後に 3回のサイクル 3回とも完璧に的中 例外なし 今は365日のうち339日目 つまりビットコインがサイクルのボトムを形成するまで、ちょうど26日 もし安値が来れば、4年サイクルは再び生き残る もし来なければ、ビットコインの最も信頼できるパターンのひとつが正式にDEAD このチャートを保存 次の26日がすべてを決める
·
--
翻訳参照
$ETH showed some strength today, while the rest of the crypto market remained weak. We’re now rejecting the first key resistance at $2,475. That’s not a good sign heading into tomorrow’s CPI report. A stronger-than-expected inflation print could put further pressure on ETH and risk assets.
$ETH showed some strength today, while the rest of the crypto market remained weak. We’re now rejecting the first key resistance at $2,475. That’s not a good sign heading into tomorrow’s CPI report. A stronger-than-expected inflation print could put further pressure on ETH and risk assets.

15
·
--
🚨 2つのステーブルコインが2,580億ドルを支配 $USDT:1,834億ドル $USDC:745億ドル この2つは合わせて2,580億ドル以上を支配しており、他のすべてのステーブルコインを合計しても上回ります。さらに、静かに6位に君臨しています:🇺🇸 トランプ関連のWorld Liberty Financialのステーブルコイン:43億ドル(現在、PayPalより大きい)。ステーブルコインは世界の金融システムの巨大な一部になりつつあります。この市場はどれくらい大きくなり得るのでしょうか?👀🚀
🚨 2つのステーブルコインが2,580億ドルを支配 $USDT:1,834億ドル $USDC:745億ドル この2つは合わせて2,580億ドル以上を支配しており、他のすべてのステーブルコインを合計しても上回ります。さらに、静かに6位に君臨しています:🇺🇸 トランプ関連のWorld Liberty Financialのステーブルコイン:43億ドル(現在、PayPalより大きい)。ステーブルコインは世界の金融システムの巨大な一部になりつつあります。この市場はどれくらい大きくなり得るのでしょうか?👀🚀

39
·
--
$XRP はまだ同じセットアップを構築中です。👀 $1.32〜$1.56 の範囲に数カ月閉じ込められ、下限のヘビーなテストが行われました。 そして、欲しかった動きが来ました: 下の流動性をスイープ ✅ 大幅な拡大 ✅ 範囲を取り戻し ✅ 再テスト進行中 ✅ しかし、残っている主要なレベルが1つあります: $1.55〜$1.56 = 重要なレジスタンス。 XRP はまだそれをブレイクしていません。 レンジ上限を上回るクリーンなブレイク+ホールドができれば、次への道が開けます: $1.70 → $1.80 → $2.00 🎯 セットアップはシンプルです: レンジを維持 → $1.56 をブレイク → $2 を目標。🚀 下の流動性はすでに回収されました。 いまは、XRP がついに上の流動性を取りにいけるかどうかを待っています。👀🔥
$XRP はまだ同じセットアップを構築中です。👀 $1.32〜$1.56 の範囲に数カ月閉じ込められ、下限のヘビーなテストが行われました。 そして、欲しかった動きが来ました: 下の流動性をスイープ ✅ 大幅な拡大 ✅ 範囲を取り戻し ✅ 再テスト進行中 ✅ しかし、残っている主要なレベルが1つあります: $1.55〜$1.56 = 重要なレジスタンス。 XRP はまだそれをブレイクしていません。 レンジ上限を上回るクリーンなブレイク+ホールドができれば、次への道が開けます: $1.70 → $1.80 → $2.00 🎯 セットアップはシンプルです: レンジを維持 → $1.56 をブレイク → $2 を目標。🚀 下の流動性はすでに回収されました。 いまは、XRP がついに上の流動性を取りにいけるかどうかを待っています。👀🔥

51
·
--
翻訳参照
🚨 #Bitcoin Price Prediction: What is Bitcoins next move?# IS ABOUT TO REPEAT THE SAME MOVE THAT DESTROYED EVERYONE IN 2022 The bull trap I warned about just played out at $79K Now look at what happened NEXT in 2022 If this structure keeps repeating, $BTC is heading to $48,000 within the next 30 days Not in 2027 Not “eventually” 30 DAYS The setup is almost identical Bull trap → distribution → breakdown → capitulation Bookmark this tweet Come back when Bitcoin is trading below $50K I publicly called the $17K bottom in 2022 I called the $126K top in 2025 And when I start buying this market again, I’ll post it here BEFORE the crowd realizes the bottom is in Follow and turn notifications on You don’t want to find my next call after the move already happened.
🚨 #Bitcoin Price Prediction: What is Bitcoins next move?# IS ABOUT TO REPEAT THE SAME MOVE THAT DESTROYED EVERYONE IN 2022 The bull trap I warned about just played out at $79K Now look at what happened NEXT in 2022 If this structure keeps repeating, $BTC is heading to $48,000 within the next 30 days Not in 2027 Not “eventually” 30 DAYS The setup is almost identical Bull trap → distribution → breakdown → capitulation Bookmark this tweet Come back when Bitcoin is trading below $50K I publicly called the $17K bottom in 2022 I called the $126K top in 2025 And when I start buying this market again, I’ll post it here BEFORE the crowd realizes the bottom is in Follow and turn notifications on You don’t want to find my next call after the move already happened.

·
--
2028年のハビングについて考える時が来ました。$BTCの価格にとって、それが何を意味しうるのか。現時点では、次のハビングまであと1.6年しかありません。過去のハビングでは: - 2012年:12か月で約100倍の急騰 - 2016年:約30倍の急騰(18か月) - 2020年:約8倍の急騰(18か月) #BTC Price Analysis# ハビングは、ビットコインのマーケティングと収益化における4年ごとの鼓動でした。 しかし2024年には、何かが変わりました。ハビング→強気相場というパターンはすでに確立されていたため、人々がハビングを前倒しで織り込み始めたのです。 初めて、ハビング前に新たな史上最高値が更新されました。 - 2024年:ハビング前の18か月で約4倍、その後の18か月で約2倍の上昇 では、このサイクルでは何が起きるのでしょうか?誰にも本当のところは分かりませんが、ハビングを前倒しで織り込むという前例ができてしまっています。 それが今のゲーム理論です。 同じパターンがこのサイクルでも起きるなら、次の1.6年はBTCにとって最も爆発力のある時期になる可能性があります。 先行サイクルをなぞると、次のようになります: - 1.6年で4倍:$58k(直近の底) --> 2028年4月のハビング時点で$232k - ハビング後18か月で2倍:$232k --> 2029年下期(2H 2029)に$464k BTCは、過去の傾向のように先行サイクルに比べて収益(リターン)が逓減する可能性は確かにありますが、どこかのタイミングでそのトレンドが上向きに転じることもありえます。 今のポイントは、ハビングを前倒しで織り込む人が多い可能性が高いということです。 そしてそれによって、ビットコイン・サイクルの中でも次の1.6年が最もワクワクする局面になるかもしれません。
2028年のハビングについて考える時が来ました。$BTCの価格にとって、それが何を意味しうるのか。現時点では、次のハビングまであと1.6年しかありません。過去のハビングでは: - 2012年:12か月で約100倍の急騰 - 2016年:約30倍の急騰(18か月) - 2020年:約8倍の急騰(18か月) #BTC Price Analysis# ハビングは、ビットコインのマーケティングと収益化における4年ごとの鼓動でした。 しかし2024年には、何かが変わりました。ハビング→強気相場というパターンはすでに確立されていたため、人々がハビングを前倒しで織り込み始めたのです。 初めて、ハビング前に新たな史上最高値が更新されました。 - 2024年:ハビング前の18か月で約4倍、その後の18か月で約2倍の上昇 では、このサイクルでは何が起きるのでしょうか?誰にも本当のところは分かりませんが、ハビングを前倒しで織り込むという前例ができてしまっています。 それが今のゲーム理論です。 同じパターンがこのサイクルでも起きるなら、次の1.6年はBTCにとって最も爆発力のある時期になる可能性があります。 先行サイクルをなぞると、次のようになります: - 1.6年で4倍:$58k(直近の底) --> 2028年4月のハビング時点で$232k - ハビング後18か月で2倍:$232k --> 2029年下期(2H 2029)に$464k BTCは、過去の傾向のように先行サイクルに比べて収益(リターン)が逓減する可能性は確かにありますが、どこかのタイミングでそのトレンドが上向きに転じることもありえます。 今のポイントは、ハビングを前倒しで織り込む人が多い可能性が高いということです。 そしてそれによって、ビットコイン・サイクルの中でも次の1.6年が最もワクワクする局面になるかもしれません。

·
--
翻訳参照
$XRP IS BACK AT THE MAKE-OR-BREAK ZONE. 👀 XRP spent months consolidating between $1.32–$1.56, with repeated tests of the lower boundary. Then came the move: Liquidity below swept ✅ Massive expansion ✅ Range reclaimed ✅ Retest holding ✅ Now XRP is approaching the $1.55–$1.56 key resistance. This is the level that decides everything: BREAK & HOLD → $1.80 → $2.00 🎯 REJECT → back into the range. The setup is there. Now XRP just needs to clear the range high. $2 is the next major target if the breakout confirms. 🚀
$XRP IS BACK AT THE MAKE-OR-BREAK ZONE. 👀 XRP spent months consolidating between $1.32–$1.56, with repeated tests of the lower boundary. Then came the move: Liquidity below swept ✅ Massive expansion ✅ Range reclaimed ✅ Retest holding ✅ Now XRP is approaching the $1.55–$1.56 key resistance. This is the level that decides everything: BREAK & HOLD → $1.80 → $2.00 🎯 REJECT → back into the range. The setup is there. Now XRP just needs to clear the range high. $2 is the next major target if the breakout confirms. 🚀

·
--
$BTC は大型の月次対称トライアングルからちょうどブレイクしました。過去のサイクルでも非常に似た構造が見られ、トライアングルのブレイクの後に大きな拡大が起きています。 2017〜18年: +1900% 2021〜22年: +600% 2025〜26年: ブレイク確認済み。 ここからなら$200K超も気のせいではないように見えます。
$BTC は大型の月次対称トライアングルからちょうどブレイクしました。過去のサイクルでも非常に似た構造が見られ、トライアングルのブレイクの後に大きな拡大が起きています。 2017〜18年: +1900% 2021〜22年: +600% 2025〜26年: ブレイク確認済み。 ここからなら$200K超も気のせいではないように見えます。

26
·
--
翻訳参照
Bitcoin $BTC is sitting at $78,650 after failing to reclaim the $79,500 level. $79,500 is the level I’m watching now. BTC has spent the last few days repeatedly struggling around this area, so until we get a clean 4H close back above it, I’m not convinced the next leg higher has started. If bulls reclaim $79.5K, $82K comes back into focus. If we lose the current range, $70.5K is the first major support I’d be watching, with $67.2K below that. For now, Bitcoin is consolidating. The next move through $79.5K or below the range should give us a much clearer idea of where this is heading.
Bitcoin $BTC is sitting at $78,650 after failing to reclaim the $79,500 level. $79,500 is the level I’m watching now. BTC has spent the last few days repeatedly struggling around this area, so until we get a clean 4H close back above it, I’m not convinced the next leg higher has started. If bulls reclaim $79.5K, $82K comes back into focus. If we lose the current range, $70.5K is the first major support I’d be watching, with $67.2K below that. For now, Bitcoin is consolidating. The next move through $79.5K or below the range should give us a much clearer idea of where this is heading.

51
·
--
翻訳参照
🚨Bitcoin $BTC Golden Cross is flashing again. In the last two cycles, the Golden Cross that came before the bear-market Death Cross printed AFTER the bottom was already in. 2019 did it. 2023 did it. Now it’s showing up again. This is not a late-cycle buy signal. Historically, it was closer to a bottom confirmation. 👀 #crypto $BTC
🚨Bitcoin $BTC Golden Cross is flashing again. In the last two cycles, the Golden Cross that came before the bear-market Death Cross printed AFTER the bottom was already in. 2019 did it. 2023 did it. Now it’s showing up again. This is not a late-cycle buy signal. Historically, it was closer to a bottom confirmation. 👀 #crypto $BTC

19
ログインして、さらにコンテンツを読む
厳選トピックで世界の暗号資産トレーダーの仲間入り
⚡️ 暗号資産に関する最新かつ有益な情報が見つかります。
💬 世界最大の暗号資産取引所から信頼されています。
👍 認証を受けたクリエイターから、有益なインサイトを得られます。
メール / 電話番号
トレンドトピック
BitcoinReboundsTo$79K
閲覧回数 8,736
90人が討論中
🚨 $BTC はさらに上昇しようとしています。
ビットコインは約 $78,804 で取引されており、先ほど $78K の水準を回復したことでおよそ 1.9% 上昇しています。次に注目すべきは、日中の高値である約 $78,905 です。
その水準を明確に上抜けると、$79K〜$80K へ向かう道が開ける可能性があります。もしBTCが跳ね返される場合、サポートは $78,300 あたりにあり、その次は $77,975 です。
強気筋には勢いがありますが、BTC は $78K を上回って維持する必要があります。
#Bitcoin #BTC #CryptoTrading #CryptoMarket #CryptoAnalysis
PulseON
·いいね:8件
·閲覧回数 9.2k
GrayscalePutsXRPAt26.11%InAdvisorPortfolio
閲覧回数 133
32人が討論中
PhiladelphiaSemiconductorIndexFalls5.9%
閲覧回数 234
25人が討論中