
CryptoWithAM
8 投稿

CryptoWithAM
報告
ユーザーをブロック
0 フォロー
0 フォロワー
8 いいね
投稿
·
--
$SOL
{spot}(SOLUSDT)
SOL/USDT — スキャルピング戦略
市場構造: 強気 📈
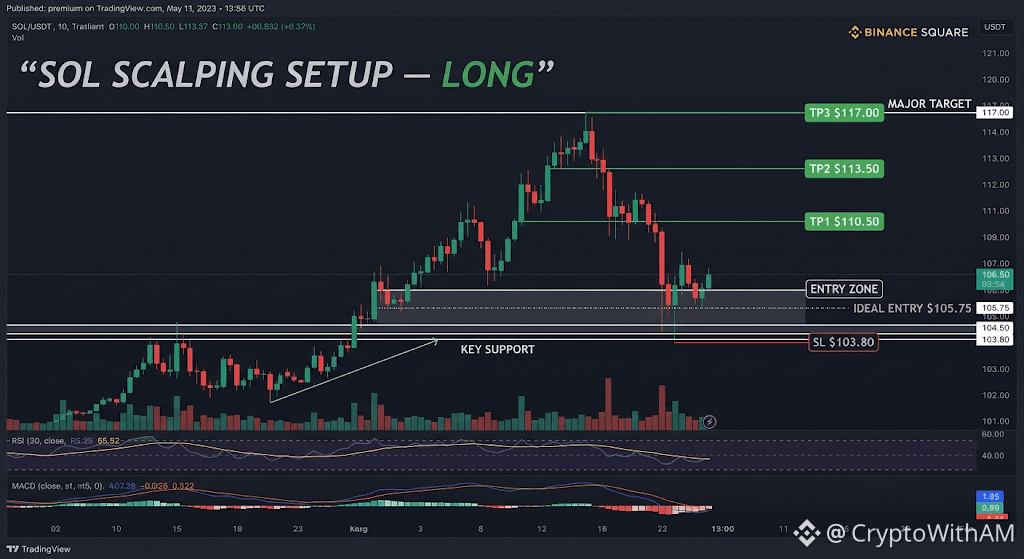
SOLは$105付近を力強く回復し、急騰後は$109〜$110近辺で推移しています。現在、$103〜$105が重要なサポートゾーンです。
方向: ロング
現在価格: 約$109
エントリーゾーン: $105.00〜$106.50
理想エントリー: $105.75
SL: $103.80
TP1: $110.50
TP2: $113.50
TP3: $117.00
理由:
• 強い強気の勢い
• $103〜$105が重要サポートに変化
• $105を上抜けしてブレイクアウト確定
• $117が次の主要な上値目標
• $110付近を追いかけず、押し目と強気の確認を待つ
RR: 約1:1.5 / 1:3.9 / 1:5.9
無効化条件: $103.80を明確に下抜けして維持された場合.#Binance #SOL #Solana #CryptoTrading #BinanceSquare
$SOL
SOL/USDT — スキャルピング戦略
市場構造: 強気 📈
SOLは$105付近を力強く回復し、急騰後は$109〜$110近辺で推移しています。現在、$103〜$105が重要なサポートゾーンです。
方向: ロング
現在価格: 約$109
エントリーゾーン: $105.00〜$106.50
理想エントリー: $105.75
SL: $103.80
TP1: $110.50
TP2: $113.50
TP3: $117.00
理由:
• 強い強気の勢い
• $103〜$105が重要サポートに変化
• $105を上抜けしてブレイクアウト確定
• $117が次の主要な上値目標
• $110付近を追いかけず、押し目と強気の確認を待つ
RR: 約1:1.5 / 1:3.9 / 1:5.9
無効化条件: $103.80を明確に下抜けして維持された場合.#Binance #SOL #Solana #CryptoTrading #BinanceSquare
SOL/USDT — スキャルピング戦略
市場構造: 強気 📈
SOLは$105付近を力強く回復し、急騰後は$109〜$110近辺で推移しています。現在、$103〜$105が重要なサポートゾーンです。
方向: ロング
現在価格: 約$109
エントリーゾーン: $105.00〜$106.50
理想エントリー: $105.75
SL: $103.80
TP1: $110.50
TP2: $113.50
TP3: $117.00
理由:
• 強い強気の勢い
• $103〜$105が重要サポートに変化
• $105を上抜けしてブレイクアウト確定
• $117が次の主要な上値目標
• $110付近を追いかけず、押し目と強気の確認を待つ
RR: 約1:1.5 / 1:3.9 / 1:5.9
無効化条件: $103.80を明確に下抜けして維持された場合.#Binance #SOL #Solana #CryptoTrading #BinanceSquare
1
232
·
--
$BTC
{spot}(BTCUSDT)
{future}(BTCUSDT)
BTC/USDT — スキャルピング・セットアップ
マーケット構造:強気 📈
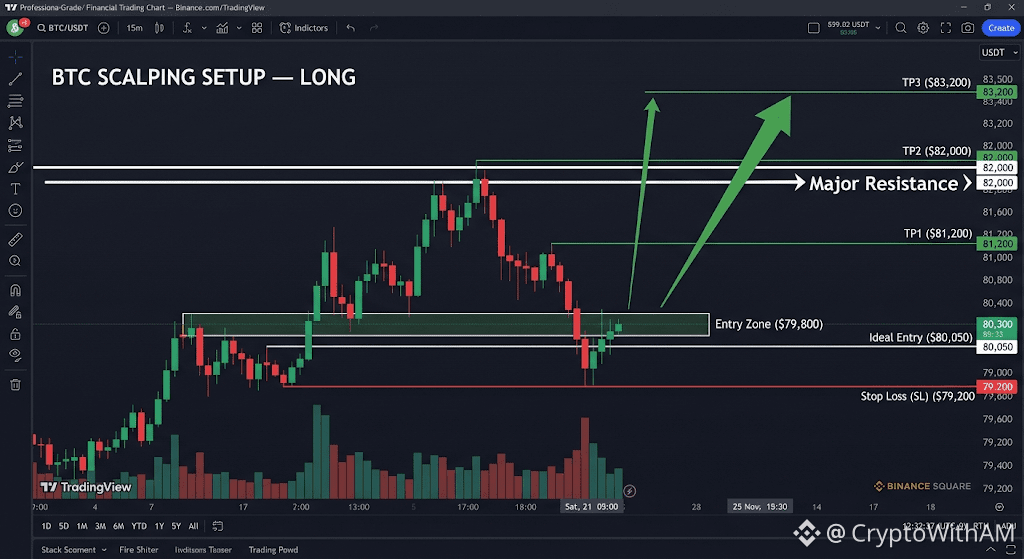
BTCは強いブレイクアウトの後に$80Kを回復し、重い買いによって勢いが支えられました。次の主要レジスタンスは$82Kです。
方向性:ロング
エントリー・ゾーン:$79,800 – $80,300
理想エントリー:$80,050
SL:$79,200
TP1:$81,200
TP2:$82,000
TP3:$83,200
理由:
• $80Kを上抜ける強いブレイクアウト
• 強気のモメンタムと買い圧
• $79.8K–$80.3Kへの押し目は、より良いエントリーを提供し得る
• $82Kは重要なレジスタンス — そこに直接追いかけるのは避ける
無効条件:$79,200を継続的に下抜けた場合。
RR:約 1:1.4 / 1:2.4 / 1:3.9
#Binance #BTC #Bitcoin #CryptoTrading #BinanceSquare
$BTC
BTC/USDT — スキャルピング・セットアップ
マーケット構造:強気 📈
BTCは強いブレイクアウトの後に$80Kを回復し、重い買いによって勢いが支えられました。次の主要レジスタンスは$82Kです。
方向性:ロング
エントリー・ゾーン:$79,800 – $80,300
理想エントリー:$80,050
SL:$79,200
TP1:$81,200
TP2:$82,000
TP3:$83,200
理由:
• $80Kを上抜ける強いブレイクアウト
• 強気のモメンタムと買い圧
• $79.8K–$80.3Kへの押し目は、より良いエントリーを提供し得る
• $82Kは重要なレジスタンス — そこに直接追いかけるのは避ける
無効条件:$79,200を継続的に下抜けた場合。
RR:約 1:1.4 / 1:2.4 / 1:3.9
#Binance #BTC #Bitcoin #CryptoTrading #BinanceSquare
BTC/USDT — スキャルピング・セットアップ
マーケット構造:強気 📈
BTCは強いブレイクアウトの後に$80Kを回復し、重い買いによって勢いが支えられました。次の主要レジスタンスは$82Kです。
方向性:ロング
エントリー・ゾーン:$79,800 – $80,300
理想エントリー:$80,050
SL:$79,200
TP1:$81,200
TP2:$82,000
TP3:$83,200
理由:
• $80Kを上抜ける強いブレイクアウト
• 強気のモメンタムと買い圧
• $79.8K–$80.3Kへの押し目は、より良いエントリーを提供し得る
• $82Kは重要なレジスタンス — そこに直接追いかけるのは避ける
無効条件:$79,200を継続的に下抜けた場合。
RR:約 1:1.4 / 1:2.4 / 1:3.9
#Binance #BTC #Bitcoin #CryptoTrading #BinanceSquare
1
127
·
--
$SOL
{spot}(SOLUSDT)
{future}(SOLUSDT)
🔥 SOL/USDT スキャルピング・セットアップ
方向: 🔴 ショート
現在価格: 約$97.2
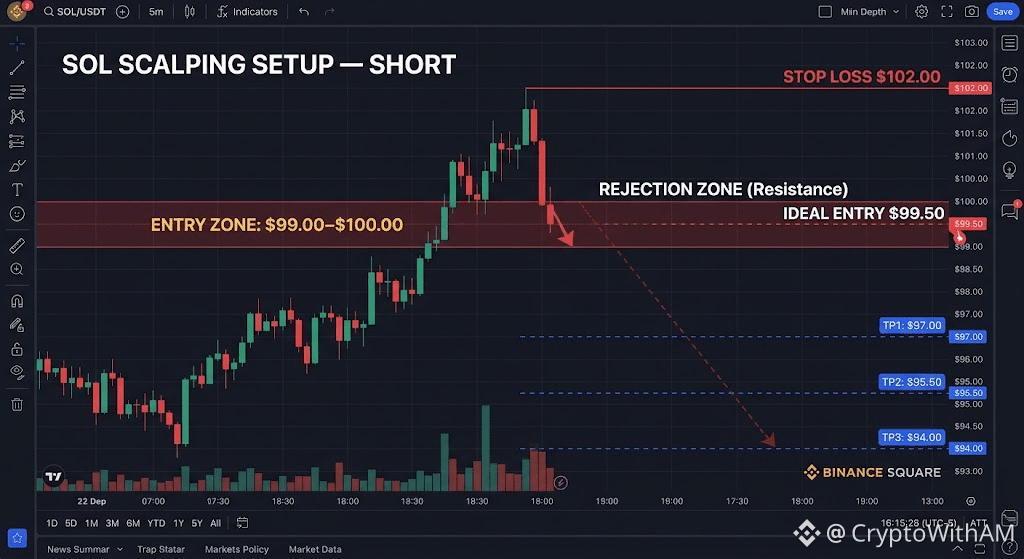
エントリー・ゾーン: $99.00 – $100.00
理想エントリー: $99.50
損切り: $102.00
TP1: $97.00
TP2: $95.50
TP3: $94.00
📊 市場構造
SOLは心理的な$100の水準を失った後、短期的に弱気な圧力を示しています。時間足の構造は依然として弱気のままですが、$100–$103は現在では重要な奪回/レジスタンス領域です。現在のテクニカルデータでも、$95–$98あたりにサポートがあることが示されています。
🎯 エントリー理由
SOLが$99–$100に戻ってくるのを待ち、以下を確認します:
• 弱気なリジェクション(跳ね返される)
• 5Mの弱気構造ブレイク
• フェイルド・リテスト
• 売りの出来高(セリング・ボリューム)の確認
価格を$97のサポート周辺で追いかけないでください。
🛑 無効条件
$102を超える奪回が継続 = ショート・セットアップ無効。
SOLがエントリー・ゾーンに到達せず、そのまま下落してきた場合も追いかけないでください。
📐 リスク/リワード
理想エントリー$99.50から:
TP1: 約1:0.83 TP2: 約1:1.33 TP3: 約1:1.83
⚡ セットアップの質
76/100 — 条件付きショート・セットアップ
主なリスク: SOLはすでに$95–$98のサポート領域に近いため、確認が不可欠です。さらに、直近の暗号資産に関する規制面での後退と、FRBの決定の影響も受け、市場全体が揺らいでいます。 #Binance #BinanceSquare #SOL #Solana #SOLUSDT #CryptoTrading #SolanaTrading #Scalping #TechnicalAnalysis #CryptoMarket #AltcoinTrading #Crypto
$SOL
🔥 SOL/USDT スキャルピング・セットアップ
方向: 🔴 ショート
現在価格: 約$97.2
エントリー・ゾーン: $99.00 – $100.00
理想エントリー: $99.50
損切り: $102.00
TP1: $97.00
TP2: $95.50
TP3: $94.00
📊 市場構造
SOLは心理的な$100の水準を失った後、短期的に弱気な圧力を示しています。時間足の構造は依然として弱気のままですが、$100–$103は現在では重要な奪回/レジスタンス領域です。現在のテクニカルデータでも、$95–$98あたりにサポートがあることが示されています。
🎯 エントリー理由
SOLが$99–$100に戻ってくるのを待ち、以下を確認します:
• 弱気なリジェクション(跳ね返される)
• 5Mの弱気構造ブレイク
• フェイルド・リテスト
• 売りの出来高(セリング・ボリューム)の確認
価格を$97のサポート周辺で追いかけないでください。
🛑 無効条件
$102を超える奪回が継続 = ショート・セットアップ無効。
SOLがエントリー・ゾーンに到達せず、そのまま下落してきた場合も追いかけないでください。
📐 リスク/リワード
理想エントリー$99.50から:
TP1: 約1:0.83 TP2: 約1:1.33 TP3: 約1:1.83
⚡ セットアップの質
76/100 — 条件付きショート・セットアップ
主なリスク: SOLはすでに$95–$98のサポート領域に近いため、確認が不可欠です。さらに、直近の暗号資産に関する規制面での後退と、FRBの決定の影響も受け、市場全体が揺らいでいます。 #Binance #BinanceSquare #SOL #Solana #SOLUSDT #CryptoTrading #SolanaTrading #Scalping #TechnicalAnalysis #CryptoMarket #AltcoinTrading #Crypto
🔥 SOL/USDT スキャルピング・セットアップ
方向: 🔴 ショート
現在価格: 約$97.2
エントリー・ゾーン: $99.00 – $100.00
理想エントリー: $99.50
損切り: $102.00
TP1: $97.00
TP2: $95.50
TP3: $94.00
📊 市場構造
SOLは心理的な$100の水準を失った後、短期的に弱気な圧力を示しています。時間足の構造は依然として弱気のままですが、$100–$103は現在では重要な奪回/レジスタンス領域です。現在のテクニカルデータでも、$95–$98あたりにサポートがあることが示されています。
🎯 エントリー理由
SOLが$99–$100に戻ってくるのを待ち、以下を確認します:
• 弱気なリジェクション(跳ね返される)
• 5Mの弱気構造ブレイク
• フェイルド・リテスト
• 売りの出来高(セリング・ボリューム)の確認
価格を$97のサポート周辺で追いかけないでください。
🛑 無効条件
$102を超える奪回が継続 = ショート・セットアップ無効。
SOLがエントリー・ゾーンに到達せず、そのまま下落してきた場合も追いかけないでください。
📐 リスク/リワード
理想エントリー$99.50から:
TP1: 約1:0.83 TP2: 約1:1.33 TP3: 約1:1.83
⚡ セットアップの質
76/100 — 条件付きショート・セットアップ
主なリスク: SOLはすでに$95–$98のサポート領域に近いため、確認が不可欠です。さらに、直近の暗号資産に関する規制面での後退と、FRBの決定の影響も受け、市場全体が揺らいでいます。 #Binance #BinanceSquare #SOL #Solana #SOLUSDT #CryptoTrading #SolanaTrading #Scalping #TechnicalAnalysis #CryptoMarket #AltcoinTrading #Crypto
1
740
·
--
翻訳参照
$SOL
{spot}(SOLUSDT)
Solana is defending crucial lower support zones as institutional inflows and high network activity contend with cautious broader market sentiment.
Market Analysis Solana is currently undergoing a tight consolidation phase near the 72 to 74 dollar region following recent macro-driven market pullbacks. High interest rate expectations and cautious liquidity conditions across global financial markets have limited short-term upward momentum for risk assets. Despite near-term price pressure, Solana continues to show structural strength in protocol fundamentals and network utilization. The ecosystem recently completed key technical capacity upgrades that significantly increased compute throughput and overall scalability. Additionally, institutional interest remains visible through consistent inflows into spot Solana exchange traded funds and expanding payment integrations like South Korea's KSNET merchant network. Technically, SOL is trading below its key short-term exponential moving averages, with the 14-day relative strength index sitting in neutral territory near 47. Order book data indicates active defense by buyers around the 72 dollar support boundary, while overhead resistance near 76 and 80 dollars continues to capped relief rallies. Market participants are watching for a decisive volume expansion to determine whether accumulation will lead to a broader trend recovery or a retest of lower demand zones.
Key Support & Resistance Key Support Levels: 72.20 USD, 70.00 USD, 67.50 USD Key Resistance Levels: 75.50 USD, 79.50 USD, 92.00 USD
$SOL
Solana is defending crucial lower support zones as institutional inflows and high network activity contend with cautious broader market sentiment.
Market Analysis Solana is currently undergoing a tight consolidation phase near the 72 to 74 dollar region following recent macro-driven market pullbacks. High interest rate expectations and cautious liquidity conditions across global financial markets have limited short-term upward momentum for risk assets. Despite near-term price pressure, Solana continues to show structural strength in protocol fundamentals and network utilization. The ecosystem recently completed key technical capacity upgrades that significantly increased compute throughput and overall scalability. Additionally, institutional interest remains visible through consistent inflows into spot Solana exchange traded funds and expanding payment integrations like South Korea's KSNET merchant network. Technically, SOL is trading below its key short-term exponential moving averages, with the 14-day relative strength index sitting in neutral territory near 47. Order book data indicates active defense by buyers around the 72 dollar support boundary, while overhead resistance near 76 and 80 dollars continues to capped relief rallies. Market participants are watching for a decisive volume expansion to determine whether accumulation will lead to a broader trend recovery or a retest of lower demand zones.
Key Support & Resistance Key Support Levels: 72.20 USD, 70.00 USD, 67.50 USD Key Resistance Levels: 75.50 USD, 79.50 USD, 92.00 USD
Solana is defending crucial lower support zones as institutional inflows and high network activity contend with cautious broader market sentiment.
Market Analysis Solana is currently undergoing a tight consolidation phase near the 72 to 74 dollar region following recent macro-driven market pullbacks. High interest rate expectations and cautious liquidity conditions across global financial markets have limited short-term upward momentum for risk assets. Despite near-term price pressure, Solana continues to show structural strength in protocol fundamentals and network utilization. The ecosystem recently completed key technical capacity upgrades that significantly increased compute throughput and overall scalability. Additionally, institutional interest remains visible through consistent inflows into spot Solana exchange traded funds and expanding payment integrations like South Korea's KSNET merchant network. Technically, SOL is trading below its key short-term exponential moving averages, with the 14-day relative strength index sitting in neutral territory near 47. Order book data indicates active defense by buyers around the 72 dollar support boundary, while overhead resistance near 76 and 80 dollars continues to capped relief rallies. Market participants are watching for a decisive volume expansion to determine whether accumulation will lead to a broader trend recovery or a retest of lower demand zones.
Key Support & Resistance Key Support Levels: 72.20 USD, 70.00 USD, 67.50 USD Key Resistance Levels: 75.50 USD, 79.50 USD, 92.00 USD

1
59
·
--
翻訳参照
$BTC
{spot}(BTCUSDT)
Bitcoin is trading near a major technical inflection point where macro events, ETF flows, and on-chain activity could shape its next significant move.
Market Analysis
Bitcoin (BTC) remains the leading cryptocurrency and continues to dominate overall crypto market sentiment. Recent price action has been largely range-bound as traders await fresh macroeconomic catalysts, particularly signals from the U.S. Federal Reserve. Institutional demand has softened compared with earlier periods, with spot Bitcoin ETFs experiencing mixed flows, while on-chain data indicates that some large holders continue accumulating despite broader market uncertainty.
Trading volume reflects cautious participation rather than aggressive directional conviction. Buyers continue defending key support areas, but repeated failures to sustain moves above resistance suggest that bulls need stronger momentum before a new uptrend can develop. Market participants are closely monitoring ETF activity, macroeconomic developments, and liquidity conditions for confirmation of the next major trend.
From a technical perspective, Bitcoin remains in a consolidation phase. A decisive breakout above resistance could improve bullish momentum, while a loss of major support may trigger another wave of selling. Until confirmation appears, disciplined risk management remains essential.
Key Support & Resistance
Key Support Levels:
$62,000
$60,000
Key Resistance Levels:
$66,900
$67,000
$BTC
Bitcoin is trading near a major technical inflection point where macro events, ETF flows, and on-chain activity could shape its next significant move.
Market Analysis
Bitcoin (BTC) remains the leading cryptocurrency and continues to dominate overall crypto market sentiment. Recent price action has been largely range-bound as traders await fresh macroeconomic catalysts, particularly signals from the U.S. Federal Reserve. Institutional demand has softened compared with earlier periods, with spot Bitcoin ETFs experiencing mixed flows, while on-chain data indicates that some large holders continue accumulating despite broader market uncertainty.
Trading volume reflects cautious participation rather than aggressive directional conviction. Buyers continue defending key support areas, but repeated failures to sustain moves above resistance suggest that bulls need stronger momentum before a new uptrend can develop. Market participants are closely monitoring ETF activity, macroeconomic developments, and liquidity conditions for confirmation of the next major trend.
From a technical perspective, Bitcoin remains in a consolidation phase. A decisive breakout above resistance could improve bullish momentum, while a loss of major support may trigger another wave of selling. Until confirmation appears, disciplined risk management remains essential.
Key Support & Resistance
Key Support Levels:
$62,000
$60,000
Key Resistance Levels:
$66,900
$67,000
Bitcoin is trading near a major technical inflection point where macro events, ETF flows, and on-chain activity could shape its next significant move.
Market Analysis
Bitcoin (BTC) remains the leading cryptocurrency and continues to dominate overall crypto market sentiment. Recent price action has been largely range-bound as traders await fresh macroeconomic catalysts, particularly signals from the U.S. Federal Reserve. Institutional demand has softened compared with earlier periods, with spot Bitcoin ETFs experiencing mixed flows, while on-chain data indicates that some large holders continue accumulating despite broader market uncertainty.
Trading volume reflects cautious participation rather than aggressive directional conviction. Buyers continue defending key support areas, but repeated failures to sustain moves above resistance suggest that bulls need stronger momentum before a new uptrend can develop. Market participants are closely monitoring ETF activity, macroeconomic developments, and liquidity conditions for confirmation of the next major trend.
From a technical perspective, Bitcoin remains in a consolidation phase. A decisive breakout above resistance could improve bullish momentum, while a loss of major support may trigger another wave of selling. Until confirmation appears, disciplined risk management remains essential.
Key Support & Resistance
Key Support Levels:
$62,000
$60,000
Key Resistance Levels:
$66,900
$67,000

1
61
·
--
翻訳参照
$ETH
{spot}(ETHUSDT)
While most altcoins chase hype cycles, Ethereum Classic is quietly approaching a scheduled monetary policy shift that could reshape its supply dynamics for years.
Ethereum Classic is currently trading near the 7dollar zone, consolidating after a pullback of roughly three percent over the past week. Trading volume has cooled compared to prior sessions, reflecting a market that is watching rather than committing. As the oldest continuously running proof of work smart contract platform, ETC continues to draw a niche but loyal community focused on immutability and decentralization.
The most significant development on the horizon is the upcoming Fifthening, a scheduled twenty percent reduction in block rewards expected between August and October 2026 under the network's five million twenty monetary policy. This event will tighten new coin issuance and is being closely watched by long term holders. Separately, the Olympia upgrade, targeting a treasury mechanism and fee burning, is slated for later in 2026 and could improve network sustainability if implementation goes smoothly.
Market participants remain split between structural believers and traders concerned about ETC competitive position against faster, more developer active chains. The seven dollar level is widely viewed as a critical line for the broader trend structure.
Key Support & Resistance (Primary support sits near 6.70 to 6.80 dollars, an area that has held during recent consolidation. A secondary support zone lies close to 6.40 to 6.50 dollars tested over the past week. On the upside, resistance is forming near 7.15 to 7.20 dollars, with a stronger resistance band around 7.60 to 7.65 dollars.)
$ETH
While most altcoins chase hype cycles, Ethereum Classic is quietly approaching a scheduled monetary policy shift that could reshape its supply dynamics for years.
Ethereum Classic is currently trading near the 7dollar zone, consolidating after a pullback of roughly three percent over the past week. Trading volume has cooled compared to prior sessions, reflecting a market that is watching rather than committing. As the oldest continuously running proof of work smart contract platform, ETC continues to draw a niche but loyal community focused on immutability and decentralization.
The most significant development on the horizon is the upcoming Fifthening, a scheduled twenty percent reduction in block rewards expected between August and October 2026 under the network's five million twenty monetary policy. This event will tighten new coin issuance and is being closely watched by long term holders. Separately, the Olympia upgrade, targeting a treasury mechanism and fee burning, is slated for later in 2026 and could improve network sustainability if implementation goes smoothly.
Market participants remain split between structural believers and traders concerned about ETC competitive position against faster, more developer active chains. The seven dollar level is widely viewed as a critical line for the broader trend structure.
Key Support & Resistance (Primary support sits near 6.70 to 6.80 dollars, an area that has held during recent consolidation. A secondary support zone lies close to 6.40 to 6.50 dollars tested over the past week. On the upside, resistance is forming near 7.15 to 7.20 dollars, with a stronger resistance band around 7.60 to 7.65 dollars.)
While most altcoins chase hype cycles, Ethereum Classic is quietly approaching a scheduled monetary policy shift that could reshape its supply dynamics for years.
Ethereum Classic is currently trading near the 7dollar zone, consolidating after a pullback of roughly three percent over the past week. Trading volume has cooled compared to prior sessions, reflecting a market that is watching rather than committing. As the oldest continuously running proof of work smart contract platform, ETC continues to draw a niche but loyal community focused on immutability and decentralization.
The most significant development on the horizon is the upcoming Fifthening, a scheduled twenty percent reduction in block rewards expected between August and October 2026 under the network's five million twenty monetary policy. This event will tighten new coin issuance and is being closely watched by long term holders. Separately, the Olympia upgrade, targeting a treasury mechanism and fee burning, is slated for later in 2026 and could improve network sustainability if implementation goes smoothly.
Market participants remain split between structural believers and traders concerned about ETC competitive position against faster, more developer active chains. The seven dollar level is widely viewed as a critical line for the broader trend structure.
Key Support & Resistance (Primary support sits near 6.70 to 6.80 dollars, an area that has held during recent consolidation. A secondary support zone lies close to 6.40 to 6.50 dollars tested over the past week. On the upside, resistance is forming near 7.15 to 7.20 dollars, with a stronger resistance band around 7.60 to 7.65 dollars.)

1
121
·
--
翻訳参照
$BTC Bitcoin (BTC) – Latest Market Analysis (29 July 2026)
Bitcoin is currently trading around the mid-$64,000 range after recovering from recent volatility. The market remains cautious ahead of major macroeconomic events, particularly the U.S. Federal Reserve's policy decisions. Recent ETF flow fluctuations and geopolitical developments have also contributed to short-term price movements.
Key Levels to Watch
Support: $63,500 – $62,500 Immediate Resistance: $65,000 – $65,500 Bullish Target: Above $67,000 if momentum continues. Bearish Scenario: A break below $62,500 could increase selling pressure in the near term.
Market Sentiment
Short-term sentiment remains neutral to slightly bullish. Institutional demand remains an important factor, with ETF inflows and outflows influencing price action. Traders are closely watching macroeconomic developments and liquidity conditions before making aggressive moves.
Quick Outlook
Bitcoin continues to consolidate near a critical psychological zone. Holding above $64K may strengthen bullish momentum toward $65K–$67K, while losing the $63K support region could invite additional downside pressure. Patience and risk management remain essential in the current environment.
#Bitcoin #BTC #CryptoNews #CryptoMarket #BinanceSquare #CryptoTrading #Blockchain #DigitalAssets
Disclaimer: This analysis is for educational purposes only and should not be considered financial advice. Always do your own research before investing or trading.
{spot}(BTCUSDT)
$BTC Bitcoin (BTC) – Latest Market Analysis (29 July 2026)
Bitcoin is currently trading around the mid-$64,000 range after recovering from recent volatility. The market remains cautious ahead of major macroeconomic events, particularly the U.S. Federal Reserve's policy decisions. Recent ETF flow fluctuations and geopolitical developments have also contributed to short-term price movements.
Key Levels to Watch
Support: $63,500 – $62,500 Immediate Resistance: $65,000 – $65,500 Bullish Target: Above $67,000 if momentum continues. Bearish Scenario: A break below $62,500 could increase selling pressure in the near term.
Market Sentiment
Short-term sentiment remains neutral to slightly bullish. Institutional demand remains an important factor, with ETF inflows and outflows influencing price action. Traders are closely watching macroeconomic developments and liquidity conditions before making aggressive moves.
Quick Outlook
Bitcoin continues to consolidate near a critical psychological zone. Holding above $64K may strengthen bullish momentum toward $65K–$67K, while losing the $63K support region could invite additional downside pressure. Patience and risk management remain essential in the current environment.
#Bitcoin #BTC #CryptoNews #CryptoMarket #BinanceSquare #CryptoTrading #Blockchain #DigitalAssets
Disclaimer: This analysis is for educational purposes only and should not be considered financial advice. Always do your own research before investing or trading.
Bitcoin is currently trading around the mid-$64,000 range after recovering from recent volatility. The market remains cautious ahead of major macroeconomic events, particularly the U.S. Federal Reserve's policy decisions. Recent ETF flow fluctuations and geopolitical developments have also contributed to short-term price movements.
Key Levels to Watch
Support: $63,500 – $62,500 Immediate Resistance: $65,000 – $65,500 Bullish Target: Above $67,000 if momentum continues. Bearish Scenario: A break below $62,500 could increase selling pressure in the near term.
Market Sentiment
Short-term sentiment remains neutral to slightly bullish. Institutional demand remains an important factor, with ETF inflows and outflows influencing price action. Traders are closely watching macroeconomic developments and liquidity conditions before making aggressive moves.
Quick Outlook
Bitcoin continues to consolidate near a critical psychological zone. Holding above $64K may strengthen bullish momentum toward $65K–$67K, while losing the $63K support region could invite additional downside pressure. Patience and risk management remain essential in the current environment.
#Bitcoin #BTC #CryptoNews #CryptoMarket #BinanceSquare #CryptoTrading #Blockchain #DigitalAssets
Disclaimer: This analysis is for educational purposes only and should not be considered financial advice. Always do your own research before investing or trading.
1
75
ログインして、さらにコンテンツを読む
厳選トピックで世界の暗号資産トレーダーの仲間入り
⚡️ 暗号資産に関する最新かつ有益な情報が見つかります。
💬 世界最大の暗号資産取引所から信頼されています。
👍 認証を受けたクリエイターから、有益なインサイトを得られます。
メール / 電話番号
トレンドトピック
BOJRaisesRatesTo31YearHigh
閲覧回数 72,770
1,182人が討論中
#bojraisesratesto31yearhigh ¿日銀は31年ぶり高値、そしてビットコインは上昇中?1つのグラフで見る$BTC の機関投資家としての成熟度 🇯🇵📈⚡
日本銀行は政策金利を1.25%に引き上げました(3十年以上で過去最高)。多くの人が予測していたキャリートレード崩壊は起きず、むしろ仮想通貨市場が最もクリーンに見せる強さが出てきたのです。
🧠 テクニカル面からの重要な3つの読み取り:
1️⃣ マクロのデカップリング:従来のアナリストが想定したように円が強くはならず、その一方でBTCは力強いリバウンド。スポット需要がまだ健在であることを示しています。
2️⃣ ハイテク巨人を上回る:時価総額が1.63兆ドル超のビットコインが、テスラ(1.438B)を再び上回り、世界的な準備資産かつ流動性の避難先としての役割を再確認します。
3️⃣ 4Hと1Dの構造:サポートでの吸収が、マクロの下げ局面が機関投資家による蓄積の“窓”であり、投げ売り(キャピトュレーション)ではないことを裏付けています。
小売は金利に関する見出しにパニックになっていても、プロの運用は“実際の流動性”の動きを追い続けます。 💎🛡️
💬 コミュニティ向けの議論:このデカップリングは、史上最高値更新に向かう上昇サイクルの最終局面が始まったことを示していると思いますか?それとも、世界的な流動性がまだサポートを試しに来るのでしょうか?分析を下に書き込んでください!👇🔥
#bojraisesratesto31yearhigh #MacroEconomy #Trading #BinanceSquare
Jacktraders
·いいね:1件
·閲覧回数 6k
BuffettStepsDownAsBerkshireChairman
閲覧回数 32,494
553人が討論中
XRPExchangeReservesHitSevenYearLow
閲覧回数 37,886
518人が討論中