
Crypto Man Mab 1
258 投稿

Crypto Man Mab 1
報告
ユーザーをブロック
Top Coin Market Cap KOL - Content Writer - Trader - Investors - DM for Collab tg : @MAB350
0 フォロー
2 フォロワー
2 いいね
投稿
翻訳参照
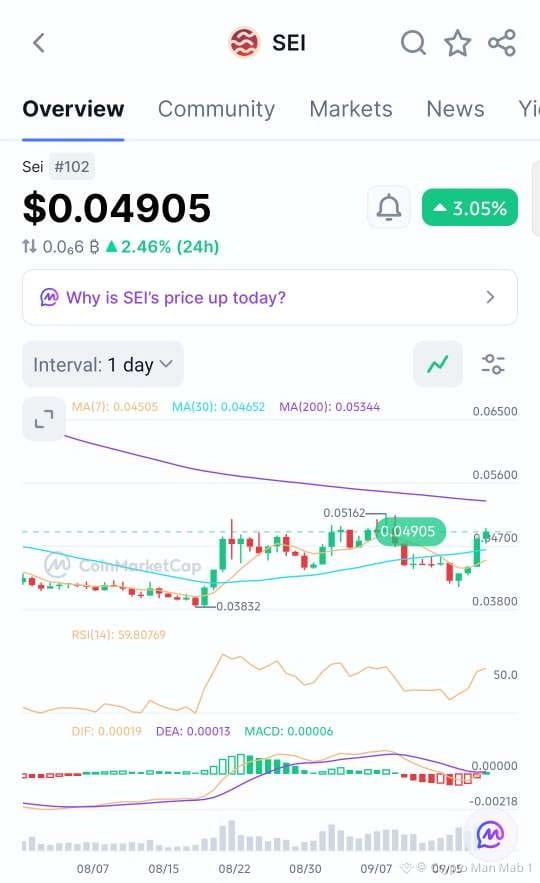
$SEI is showing signs of a recovery on the daily chart after bouncing from the $0.0383 area.
Price is now around $0.049 and has reclaimed the 30-day MA at $0.0465. The 7-day MA is also below price at $0.0450, which supports the short-term bullish structure.
RSI is around 60, so momentum is improving without being extremely overbought. MACD has also turned positive, with DIF above DEA, suggesting buyers are starting to regain control.
The main level I’m watching is $0.0516. If SEI breaks and holds above this resistance, the next important area is around $0.0534, which also lines up with the 200-day MA.
For a pullback, $0.0465–$0.0470 is the key zone to watch. Holding this area could keep the recovery structure intact.
Overall, SEI is showing improving momentum, but the $0.0516–$0.0534 zone is where the real breakout confirmation would come.
$SEI is showing signs of a recovery on the daily chart after bouncing from the $0.0383 area.
Price is now around $0.049 and has reclaimed the 30-day MA at $0.0465. The 7-day MA is also below price at $0.0450, which supports the short-term bullish structure.
RSI is around 60, so momentum is improving without being extremely overbought. MACD has also turned positive, with DIF above DEA, suggesting buyers are starting to regain control.
The main level I’m watching is $0.0516. If SEI breaks and holds above this resistance, the next important area is around $0.0534, which also lines up with the 200-day MA.
For a pullback, $0.0465–$0.0470 is the key zone to watch. Holding this area could keep the recovery structure intact.
Overall, SEI is showing improving momentum, but the $0.0516–$0.0534 zone is where the real breakout confirmation would come.
Price is now around $0.049 and has reclaimed the 30-day MA at $0.0465. The 7-day MA is also below price at $0.0450, which supports the short-term bullish structure.
RSI is around 60, so momentum is improving without being extremely overbought. MACD has also turned positive, with DIF above DEA, suggesting buyers are starting to regain control.
The main level I’m watching is $0.0516. If SEI breaks and holds above this resistance, the next important area is around $0.0534, which also lines up with the 200-day MA.
For a pullback, $0.0465–$0.0470 is the key zone to watch. Holding this area could keep the recovery structure intact.
Overall, SEI is showing improving momentum, but the $0.0516–$0.0534 zone is where the real breakout confirmation would come.
7
翻訳参照
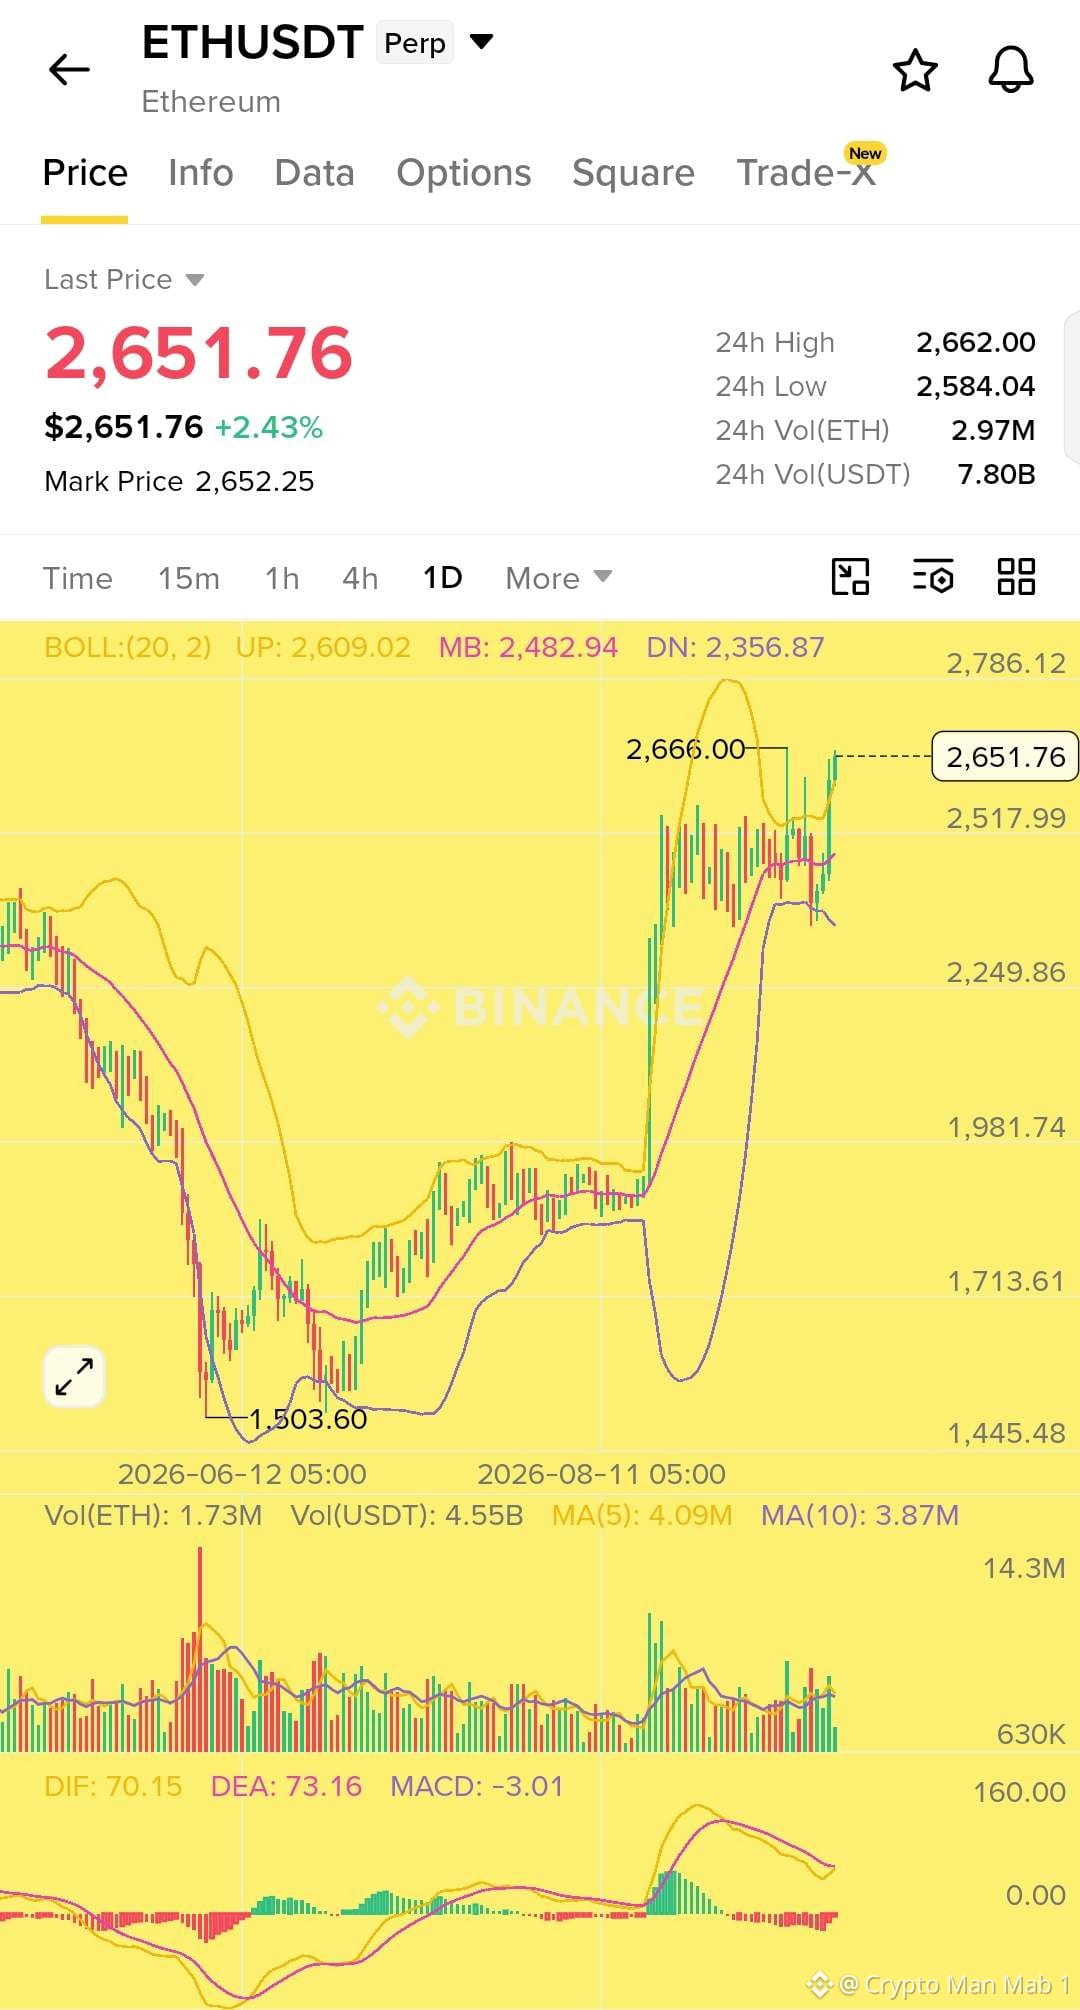
$ETH is still showing strong bullish momentum on the daily chart, but the current price is getting stretched after the recent move higher.
ETH is trading around $2,652 and recently pushed toward $2,666. The price is above the Bollinger midline at $2,483 and has broken above the upper Bollinger Band around $2,609, showing strong buying pressure.
However, MACD is starting to cool off, with DIF below DEA and the histogram turning negative. So I’d avoid chasing the move here and instead watch for a pullback toward the $2,600–$2,620 area.
If ETH holds that zone and buyers step back in, the next levels I’m watching are → $2,670 → $2,700 → $2,800 → $3,000.
The bigger picture remains bullish, but $2,666 is the immediate resistance to watch. A clean break and hold above it could open the door for another leg higher. 🚀
$ETH is still showing strong bullish momentum on the daily chart, but the current price is getting stretched after the recent move higher.
ETH is trading around $2,652 and recently pushed toward $2,666. The price is above the Bollinger midline at $2,483 and has broken above the upper Bollinger Band around $2,609, showing strong buying pressure.
However, MACD is starting to cool off, with DIF below DEA and the histogram turning negative. So I’d avoid chasing the move here and instead watch for a pullback toward the $2,600–$2,620 area.
If ETH holds that zone and buyers step back in, the next levels I’m watching are → $2,670 → $2,700 → $2,800 → $3,000.
The bigger picture remains bullish, but $2,666 is the immediate resistance to watch. A clean break and hold above it could open the door for another leg higher. 🚀
ETH is trading around $2,652 and recently pushed toward $2,666. The price is above the Bollinger midline at $2,483 and has broken above the upper Bollinger Band around $2,609, showing strong buying pressure.
However, MACD is starting to cool off, with DIF below DEA and the histogram turning negative. So I’d avoid chasing the move here and instead watch for a pullback toward the $2,600–$2,620 area.
If ETH holds that zone and buyers step back in, the next levels I’m watching are → $2,670 → $2,700 → $2,800 → $3,000.
The bigger picture remains bullish, but $2,666 is the immediate resistance to watch. A clean break and hold above it could open the door for another leg higher. 🚀
60
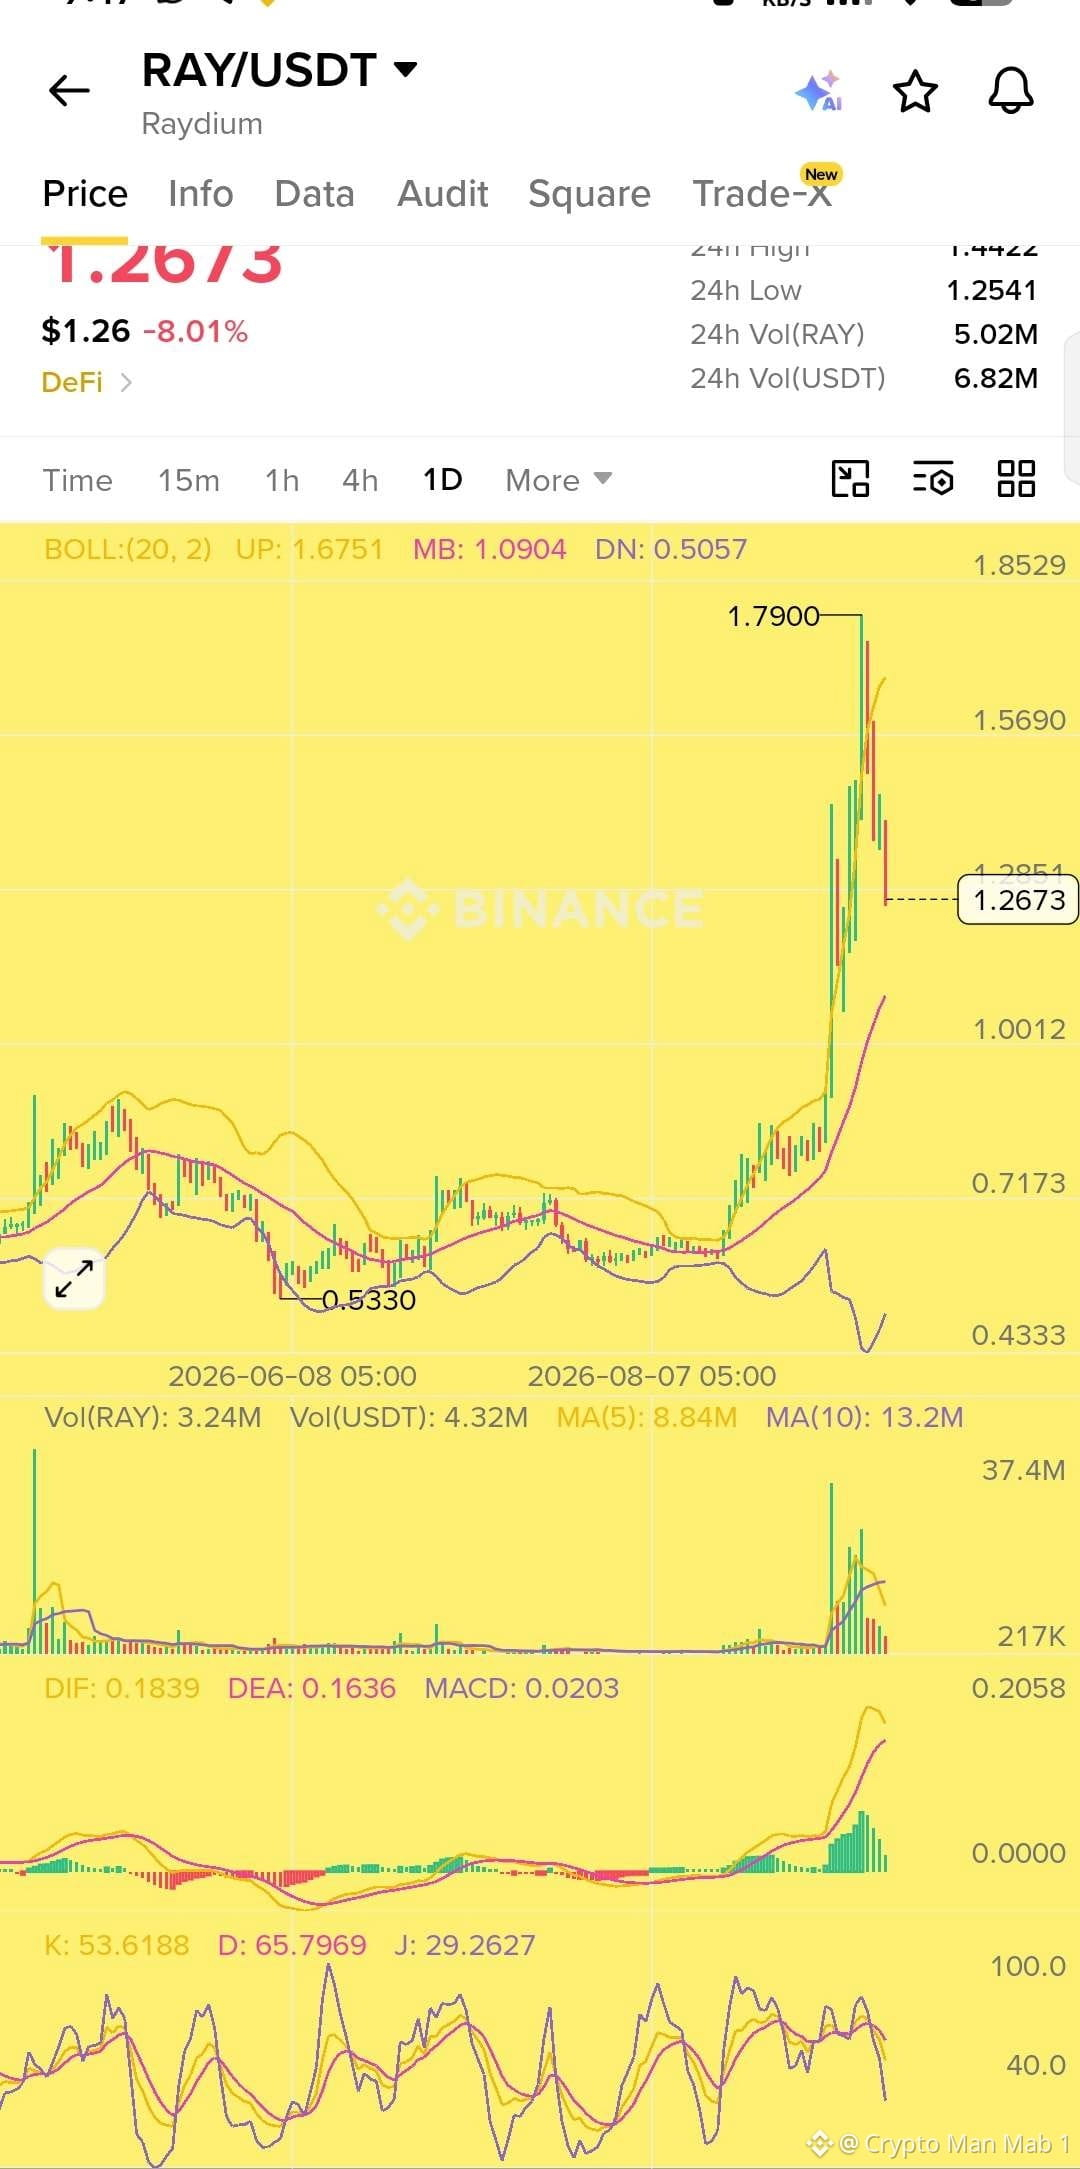
$RAY 荒れた走りの後にクールダウン。数週間で価格は$0.53から$1.79の高値まで3倍に上昇した後、現在は$1.2673まで強く押し戻され、直近の高値で拒否された後、今日8%下落。
ピーク直後に出た「典型的な天井での投げ売り(急騰の終わり)」を示すローソク足。ボリンジャーバンドでは、価格が上限バンドから下がって中間バンド付近の約$1.09へ戻ってきています。MACDの勢いは弱まり、KDJはすでにベア(売り)に反転しているため、短期のトレンドは下向きに転じています。
大局ではまだ強気です。価格が移動平均線を大きく上回っているからです。ただし、放物線的な上昇の後の、健全なリセットのように見えます。次のサポート水準として$1.09を注視。
※投資助言ではありません。チャートを読んでいるだけです。
$RAY 荒れた走りの後にクールダウン。数週間で価格は$0.53から$1.79の高値まで3倍に上昇した後、現在は$1.2673まで強く押し戻され、直近の高値で拒否された後、今日8%下落。
ピーク直後に出た「典型的な天井での投げ売り(急騰の終わり)」を示すローソク足。ボリンジャーバンドでは、価格が上限バンドから下がって中間バンド付近の約$1.09へ戻ってきています。MACDの勢いは弱まり、KDJはすでにベア(売り)に反転しているため、短期のトレンドは下向きに転じています。
大局ではまだ強気です。価格が移動平均線を大きく上回っているからです。ただし、放物線的な上昇の後の、健全なリセットのように見えます。次のサポート水準として$1.09を注視。
※投資助言ではありません。チャートを読んでいるだけです。
ピーク直後に出た「典型的な天井での投げ売り(急騰の終わり)」を示すローソク足。ボリンジャーバンドでは、価格が上限バンドから下がって中間バンド付近の約$1.09へ戻ってきています。MACDの勢いは弱まり、KDJはすでにベア(売り)に反転しているため、短期のトレンドは下向きに転じています。
大局ではまだ強気です。価格が移動平均線を大きく上回っているからです。ただし、放物線的な上昇の後の、健全なリセットのように見えます。次のサポート水準として$1.09を注視。
※投資助言ではありません。チャートを読んでいるだけです。
58
翻訳参照
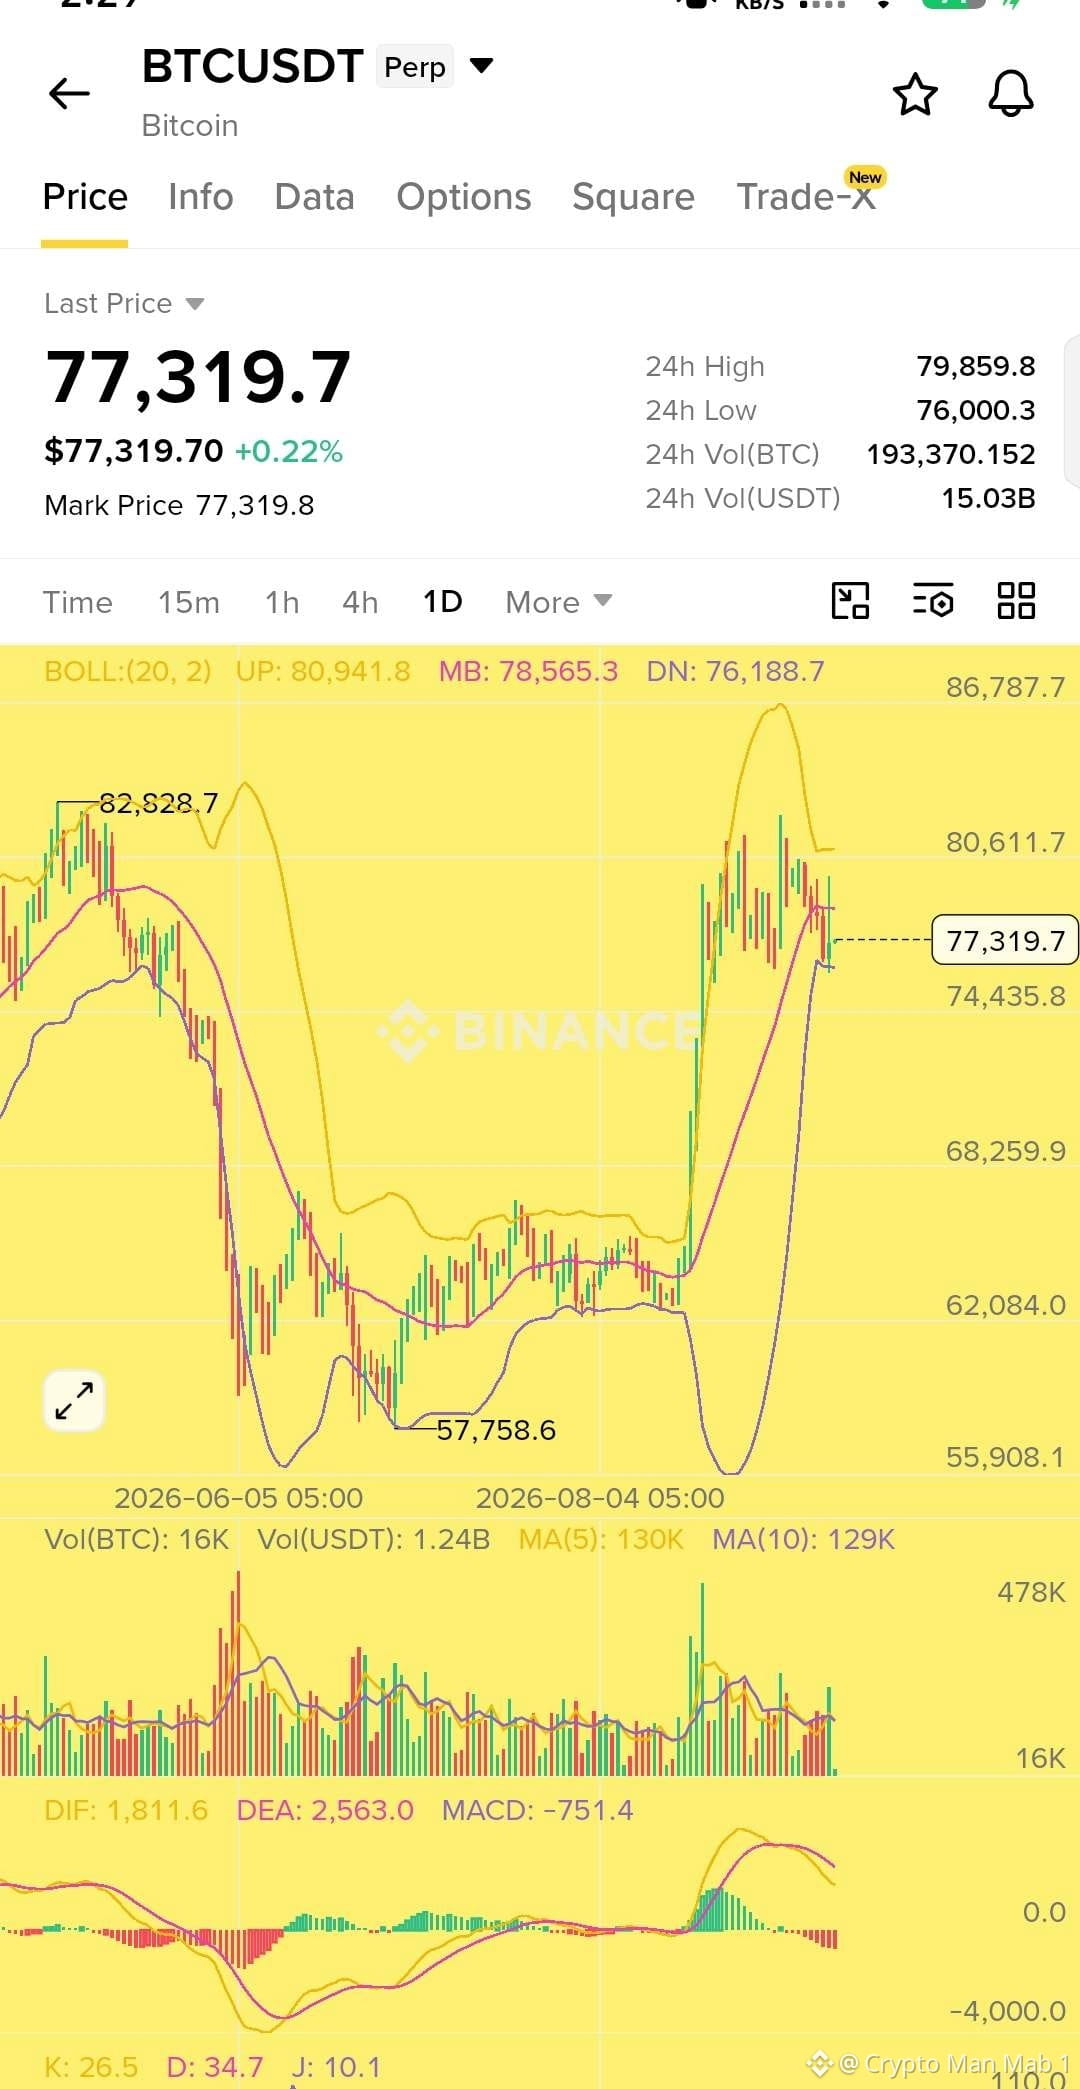
$BTC Daily chart is showing a clear short term bearish structure.
BTC is currently trading around $77.3K and sitting below the Bollinger mid band at $78.56K. MACD has turned bearish with the histogram below zero while KDJ is also showing weak momentum.
The key level to watch is $78.5K. If BTC fails to reclaim this area then another move toward $76K and potentially $74.4K is possible.
For the bulls I would want to see a strong daily close above $78.5K. That could open the door toward $80.6K and $81K.
#BTC Price Analysis#
My view right now: cautious bearish below $78.5K.
$BTC Daily chart is showing a clear short term bearish structure.
BTC is currently trading around $77.3K and sitting below the Bollinger mid band at $78.56K. MACD has turned bearish with the histogram below zero while KDJ is also showing weak momentum.
The key level to watch is $78.5K. If BTC fails to reclaim this area then another move toward $76K and potentially $74.4K is possible.
For the bulls I would want to see a strong daily close above $78.5K. That could open the door toward $80.6K and $81K.
#BTC Price Analysis#
My view right now: cautious bearish below $78.5K.
BTC is currently trading around $77.3K and sitting below the Bollinger mid band at $78.56K. MACD has turned bearish with the histogram below zero while KDJ is also showing weak momentum.
The key level to watch is $78.5K. If BTC fails to reclaim this area then another move toward $76K and potentially $74.4K is possible.
For the bulls I would want to see a strong daily close above $78.5K. That could open the door toward $80.6K and $81K.
#BTC Price Analysis#
My view right now: cautious bearish below $78.5K.
63
翻訳参照
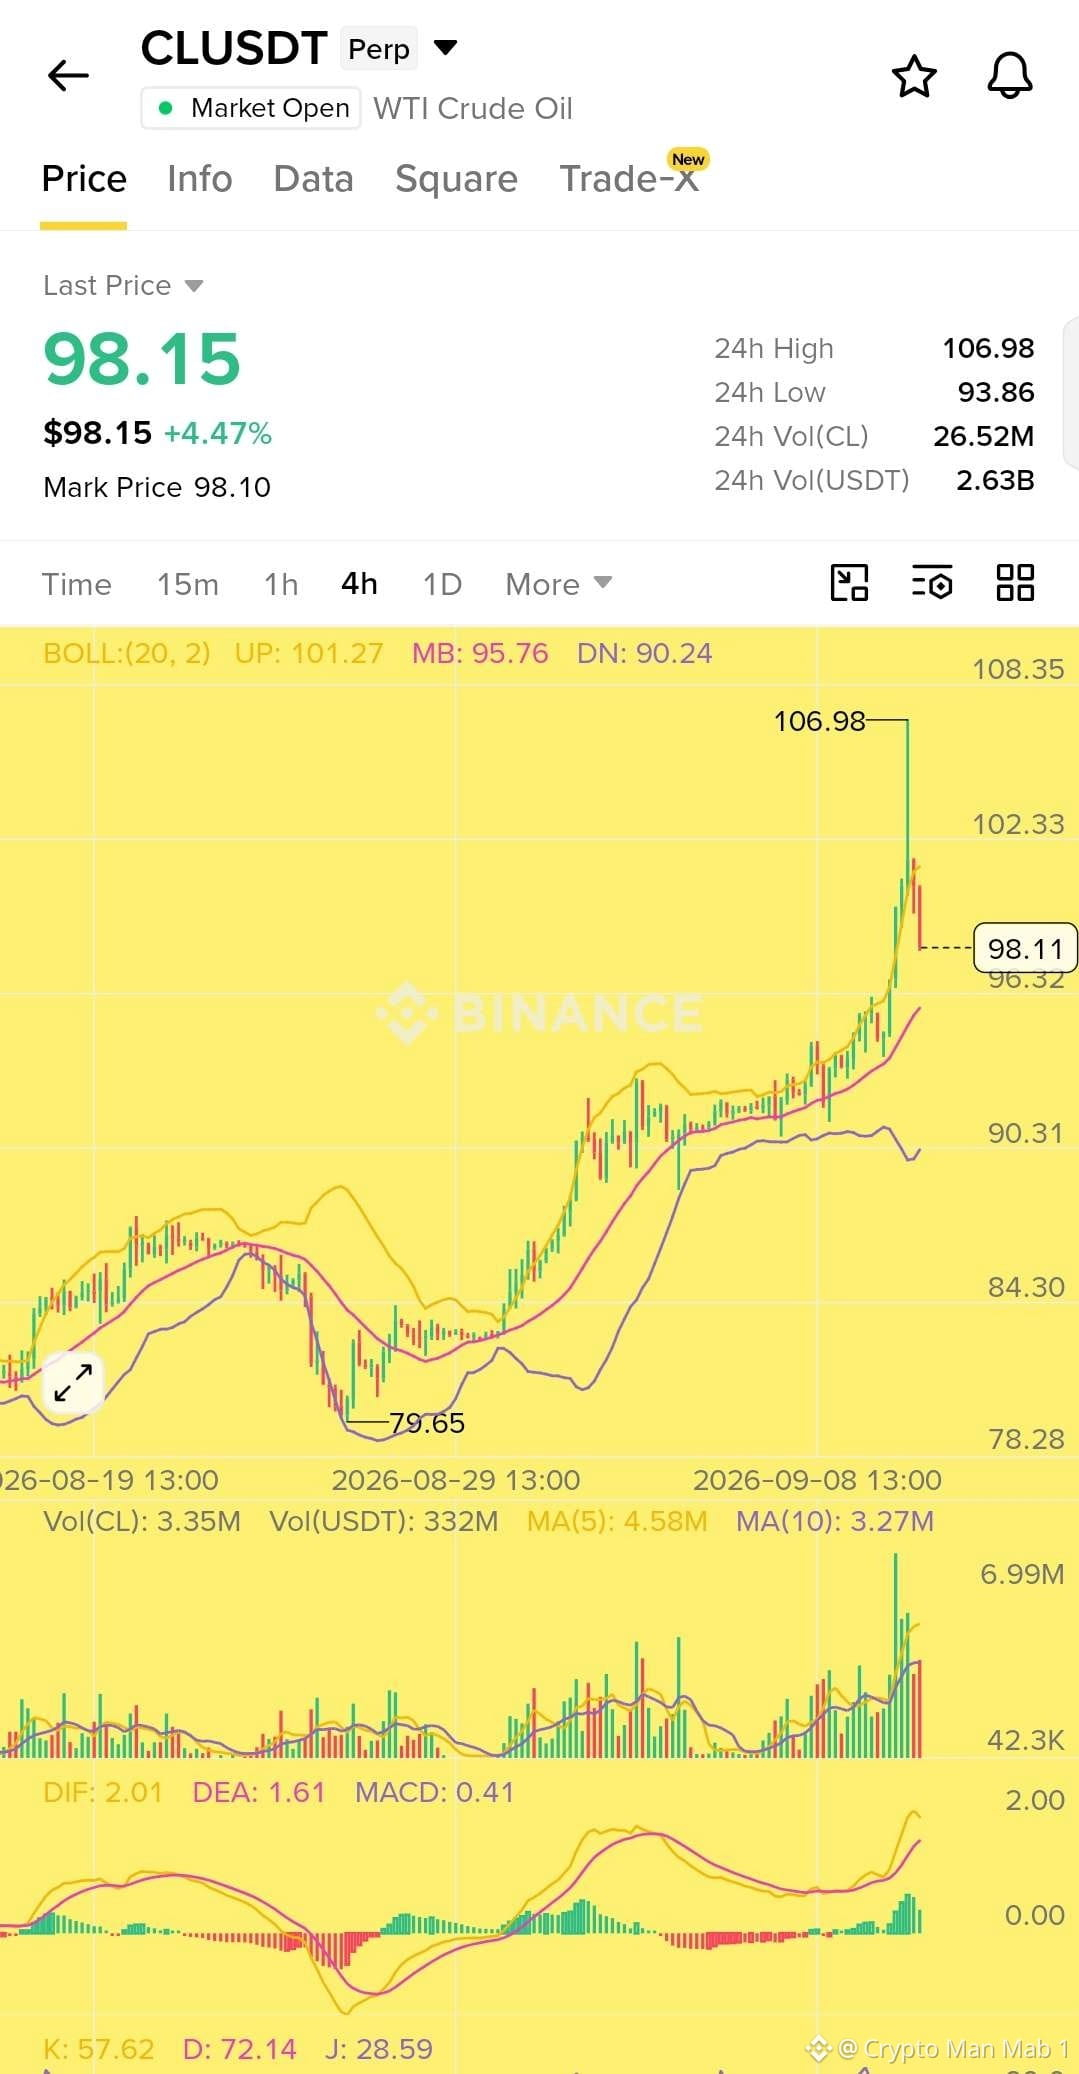
$CL is showing signs of exhaustion after the sharp move toward the $106.98 high.
Price is now pulling back from the upper Bollinger Band while the 4H chart shows a stretched move and momentum starting to cool. I’m watching the $100 area closely. If price fails to reclaim and hold above $100 then a deeper pullback toward $97 to $94 becomes possible.
For a scalp I think the short side offers a better risk to reward here.
Scalp Short $CL
Entry: $100 - $98
TP: $97 - $96 - $95 - $94
SL: $102
Key confirmation: rejection around $100 and continued weakness below $98.
$CL is showing signs of exhaustion after the sharp move toward the $106.98 high.
Price is now pulling back from the upper Bollinger Band while the 4H chart shows a stretched move and momentum starting to cool. I’m watching the $100 area closely. If price fails to reclaim and hold above $100 then a deeper pullback toward $97 to $94 becomes possible.
For a scalp I think the short side offers a better risk to reward here.
Scalp Short $CL
Entry: $100 - $98
TP: $97 - $96 - $95 - $94
SL: $102
Key confirmation: rejection around $100 and continued weakness below $98.
Price is now pulling back from the upper Bollinger Band while the 4H chart shows a stretched move and momentum starting to cool. I’m watching the $100 area closely. If price fails to reclaim and hold above $100 then a deeper pullback toward $97 to $94 becomes possible.
For a scalp I think the short side offers a better risk to reward here.
Scalp Short $CL
Entry: $100 - $98
TP: $97 - $96 - $95 - $94
SL: $102
Key confirmation: rejection around $100 and continued weakness below $98.
64
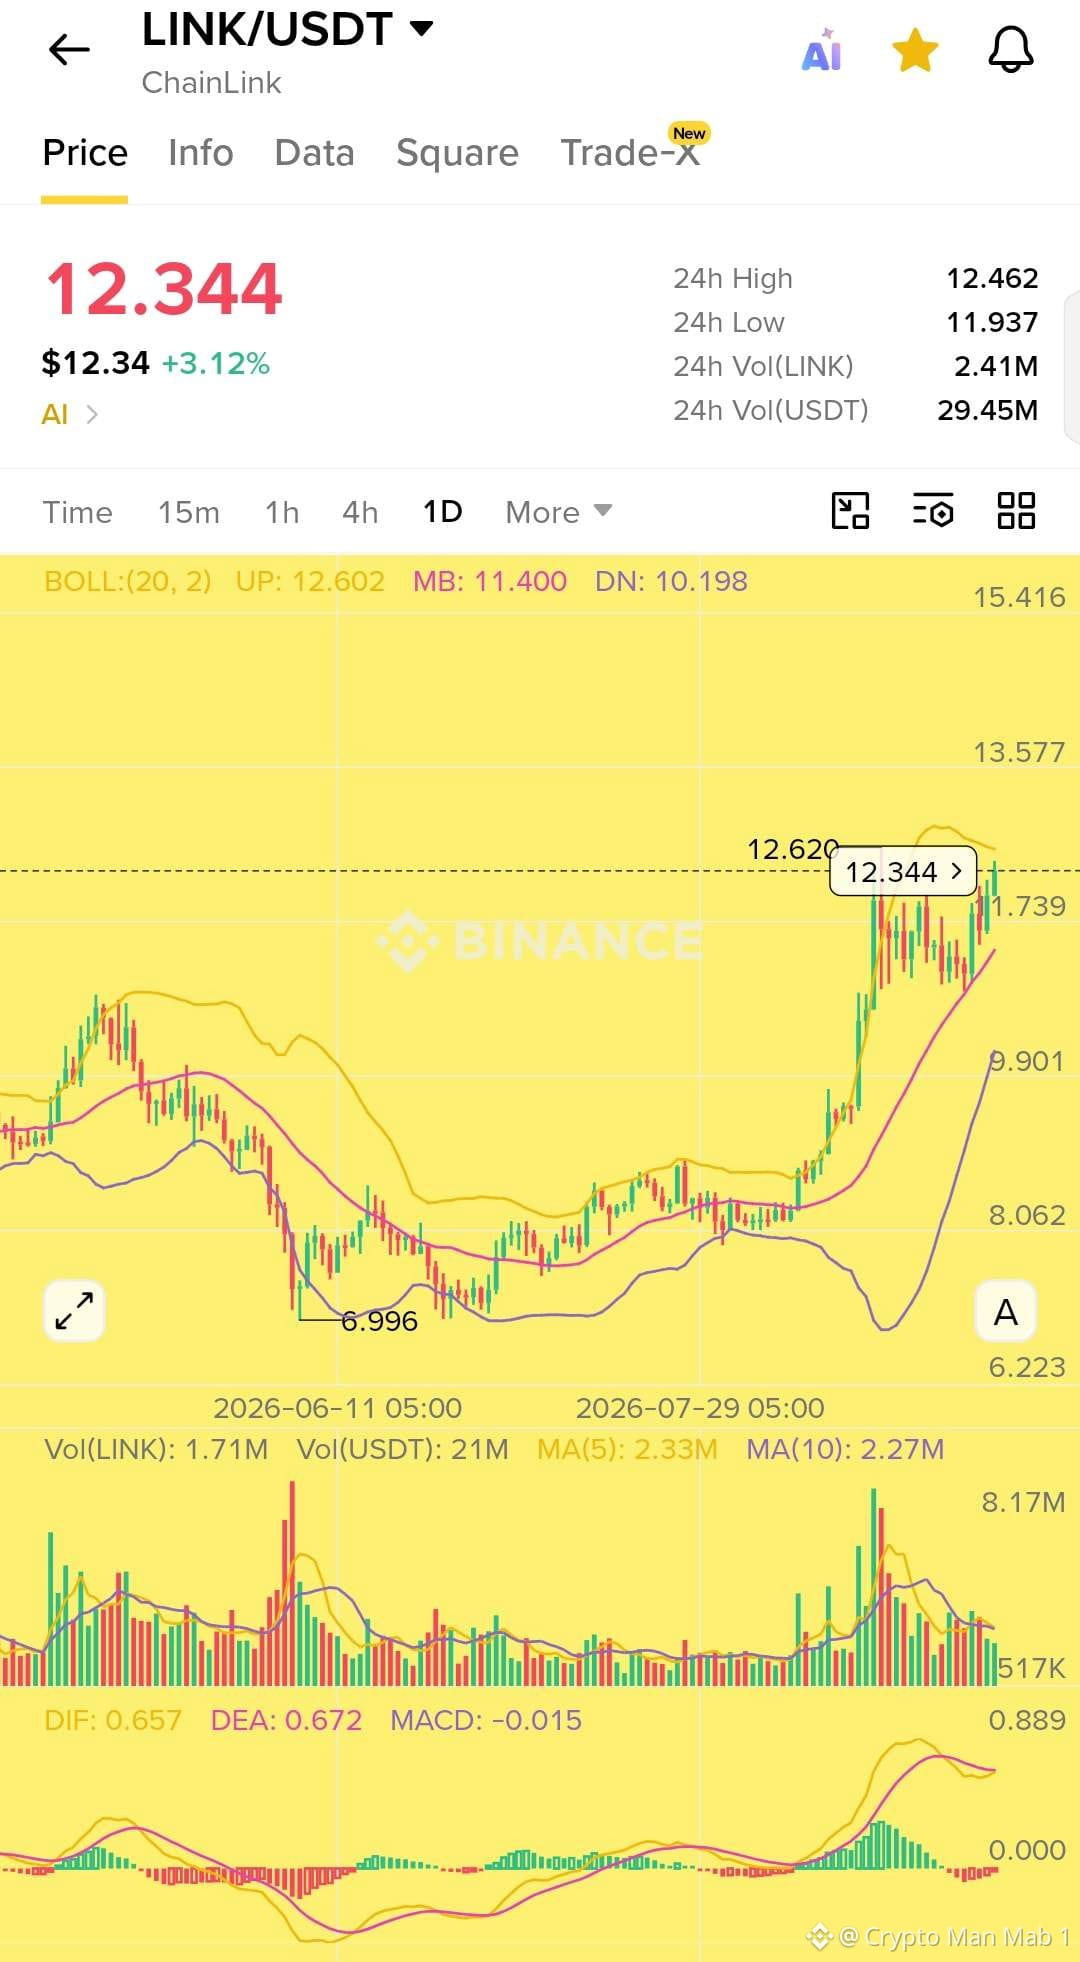
$LINKは日足チャートで強さを見せています 👀
チェーンリンクは力強く上昇し、下限レンジからブレイクした後、現在は$12.3付近で推移しながら調整しています。
価格は依然としてボリンジャー・ミドルバンド付近の$11.40上で維持されており、より大きな流れでは強気を保っています。今注目すべき主な水準は$12.60です。そこでの強い出来高を伴う、きれいなブレイクが確認できれば、$13.50+方向への扉が開ける可能性があります。
同時に、MACDの勢いはやや冷めてきているので、追いかけるのは避けて確認を待ちましょう。
📌 注目レベル
サポート: $11.40 → $10.20
レジスタンス: $12.60 → $13.57 → $15.40
もしLINKが$12.60をサポートへ反転させれば、次の値動きは面白くなりそうです。
#LINK #Chainlink #LINKUSDT #CryptoTrading #Altcoins
$LINKは日足チャートで強さを見せています 👀
チェーンリンクは力強く上昇し、下限レンジからブレイクした後、現在は$12.3付近で推移しながら調整しています。
価格は依然としてボリンジャー・ミドルバンド付近の$11.40上で維持されており、より大きな流れでは強気を保っています。今注目すべき主な水準は$12.60です。そこでの強い出来高を伴う、きれいなブレイクが確認できれば、$13.50+方向への扉が開ける可能性があります。
同時に、MACDの勢いはやや冷めてきているので、追いかけるのは避けて確認を待ちましょう。
📌 注目レベル
サポート: $11.40 → $10.20
レジスタンス: $12.60 → $13.57 → $15.40
もしLINKが$12.60をサポートへ反転させれば、次の値動きは面白くなりそうです。
#LINK #Chainlink #LINKUSDT #CryptoTrading #Altcoins
チェーンリンクは力強く上昇し、下限レンジからブレイクした後、現在は$12.3付近で推移しながら調整しています。
価格は依然としてボリンジャー・ミドルバンド付近の$11.40上で維持されており、より大きな流れでは強気を保っています。今注目すべき主な水準は$12.60です。そこでの強い出来高を伴う、きれいなブレイクが確認できれば、$13.50+方向への扉が開ける可能性があります。
同時に、MACDの勢いはやや冷めてきているので、追いかけるのは避けて確認を待ちましょう。
📌 注目レベル
サポート: $11.40 → $10.20
レジスタンス: $12.60 → $13.57 → $15.40
もしLINKが$12.60をサポートへ反転させれば、次の値動きは面白くなりそうです。
#LINK #Chainlink #LINKUSDT #CryptoTrading #Altcoins
66
翻訳参照
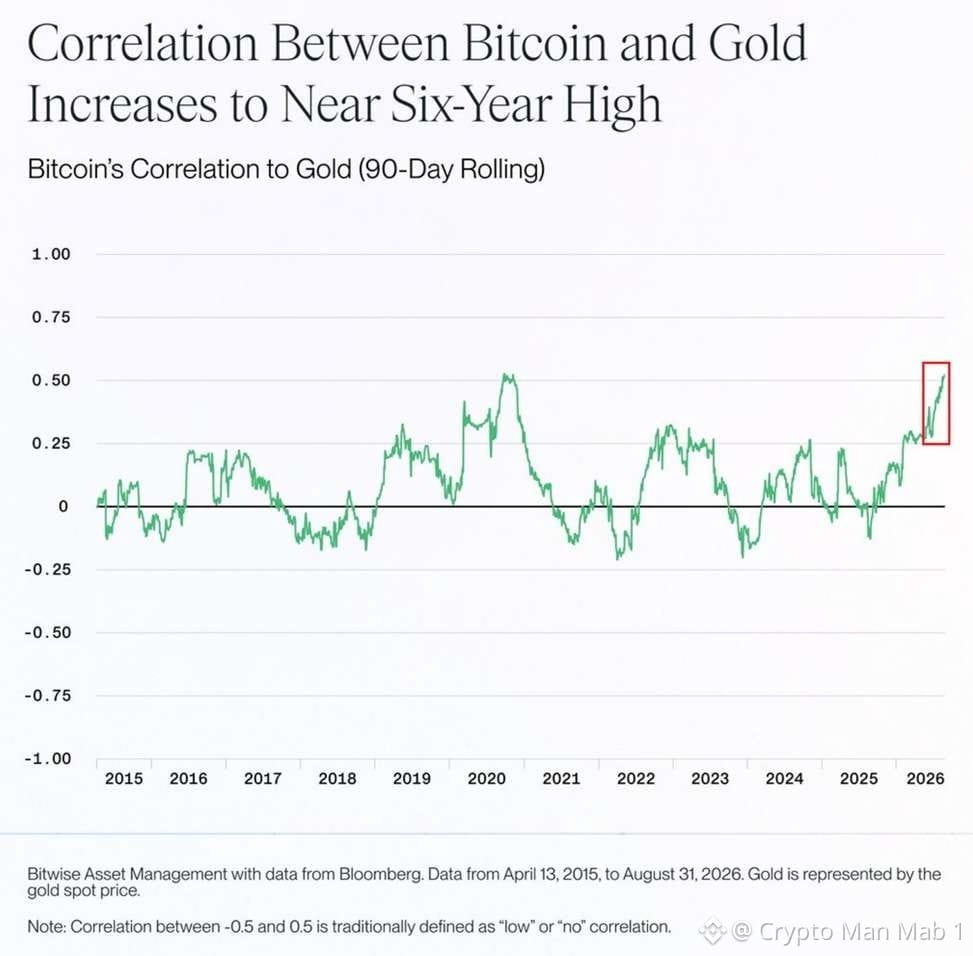
Bitcoin and gold are starting to move more and more alike.
The 90 day correlation between BTC and gold has climbed to around +0.50, getting close to the record levels we saw during the 2020 pandemic.
What’s even more interesting is that this correlation has more than doubled since the beginning of the year.
For comparison, during the recovery from the 2022 bear market, the correlation only reached around +0.30.
The latest move picked up after the US Treasury announced on August 19 that it would at least double its buybacks of long dated government debt, increasing them from $2 billion to $4 billion per operation.
At the same time, Bitcoin’s correlation with the Nasdaq 100 has fallen to around 0.30, its lowest level in a year.
#BTC Price Analysis#
$BTC
Bitcoin and gold are starting to move more and more alike.
The 90 day correlation between BTC and gold has climbed to around +0.50, getting close to the record levels we saw during the 2020 pandemic.
What’s even more interesting is that this correlation has more than doubled since the beginning of the year.
For comparison, during the recovery from the 2022 bear market, the correlation only reached around +0.30.
The latest move picked up after the US Treasury announced on August 19 that it would at least double its buybacks of long dated government debt, increasing them from $2 billion to $4 billion per operation.
At the same time, Bitcoin’s correlation with the Nasdaq 100 has fallen to around 0.30, its lowest level in a year.
#BTC Price Analysis#
$BTC
The 90 day correlation between BTC and gold has climbed to around +0.50, getting close to the record levels we saw during the 2020 pandemic.
What’s even more interesting is that this correlation has more than doubled since the beginning of the year.
For comparison, during the recovery from the 2022 bear market, the correlation only reached around +0.30.
The latest move picked up after the US Treasury announced on August 19 that it would at least double its buybacks of long dated government debt, increasing them from $2 billion to $4 billion per operation.
At the same time, Bitcoin’s correlation with the Nasdaq 100 has fallen to around 0.30, its lowest level in a year.
#BTC Price Analysis#
$BTC
66
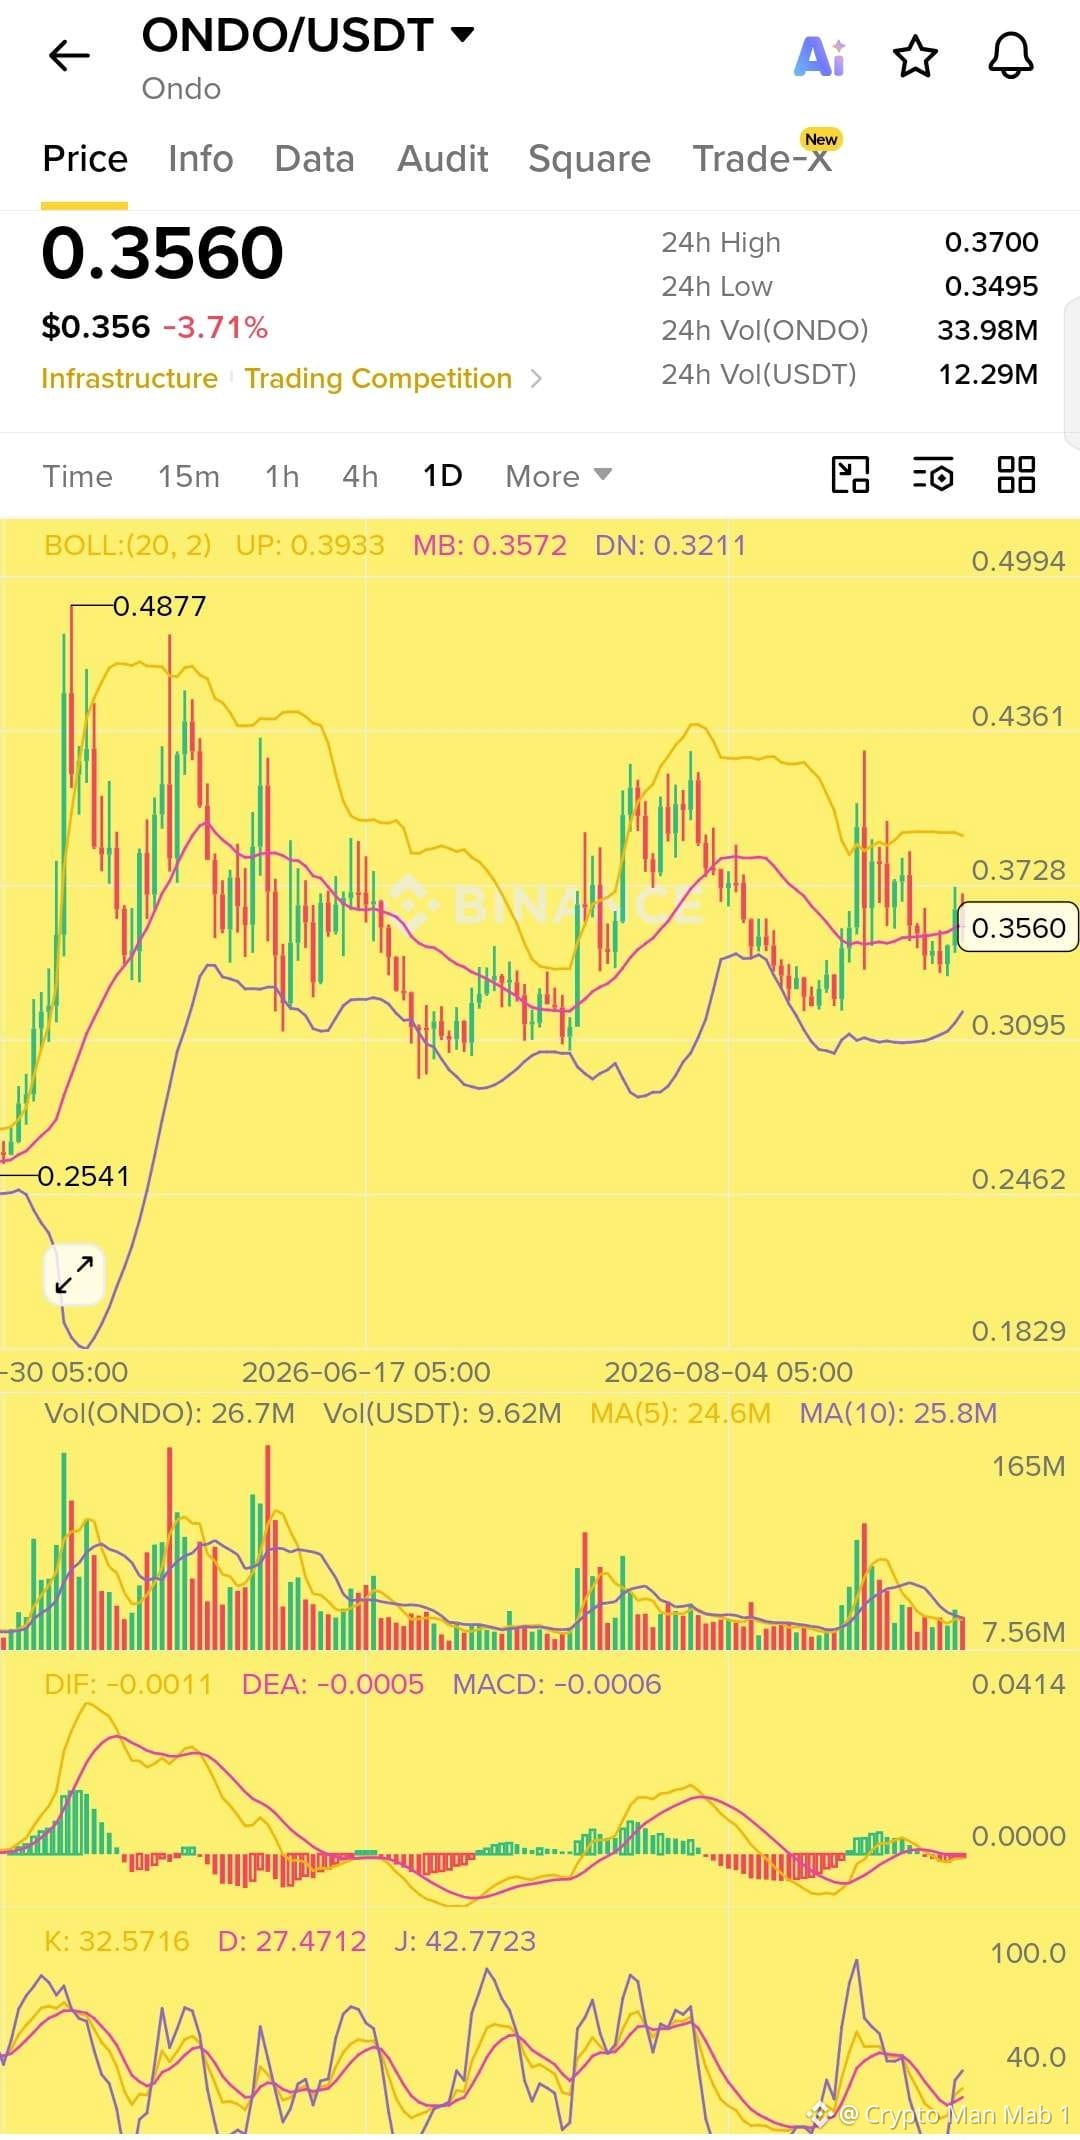
$ONDOは興味深い水準に座っています 👀
$ONDOは約$0.356で取引されており、ボリンジャーのミドルバンド($0.357)付近です。価格はしばらく横ばいで推移していますが、買い手は依然として$0.34〜$0.35のエリアを守っています。
もしONDOが出来高を伴って$0.37〜$0.38を取り戻せれば、次に注目している水準は$0.393、そして場合によっては$0.43です。
下方向では、$0.34を割り込むと価格が$0.32のサポートエリアへ逆戻りする可能性があります。
全体として、私はいまのレンジを追いかけるのではなく、ブレイクアウトを見ています。📈
主要な水準:
🟢 サポート: $0.34 → $0.32
🚀 レジスタンス: $0.37 → $0.393 → $0.43
#ONDO #ONDOUSDT #Crypto #CryptoTrading #RWA
$ONDOは興味深い水準に座っています 👀
$ONDOは約$0.356で取引されており、ボリンジャーのミドルバンド($0.357)付近です。価格はしばらく横ばいで推移していますが、買い手は依然として$0.34〜$0.35のエリアを守っています。
もしONDOが出来高を伴って$0.37〜$0.38を取り戻せれば、次に注目している水準は$0.393、そして場合によっては$0.43です。
下方向では、$0.34を割り込むと価格が$0.32のサポートエリアへ逆戻りする可能性があります。
全体として、私はいまのレンジを追いかけるのではなく、ブレイクアウトを見ています。📈
主要な水準:
🟢 サポート: $0.34 → $0.32
🚀 レジスタンス: $0.37 → $0.393 → $0.43
#ONDO #ONDOUSDT #Crypto #CryptoTrading #RWA
$ONDOは約$0.356で取引されており、ボリンジャーのミドルバンド($0.357)付近です。価格はしばらく横ばいで推移していますが、買い手は依然として$0.34〜$0.35のエリアを守っています。
もしONDOが出来高を伴って$0.37〜$0.38を取り戻せれば、次に注目している水準は$0.393、そして場合によっては$0.43です。
下方向では、$0.34を割り込むと価格が$0.32のサポートエリアへ逆戻りする可能性があります。
全体として、私はいまのレンジを追いかけるのではなく、ブレイクアウトを見ています。📈
主要な水準:
🟢 サポート: $0.34 → $0.32
🚀 レジスタンス: $0.37 → $0.393 → $0.43
#ONDO #ONDOUSDT #Crypto #CryptoTrading #RWA
88
イーサリアムETFが勢いを維持し続けています。🔥
ETH ETFはこれで11回連続で資金流入を記録しており、XRPとソラナのファンドもそれぞれ10日連続のプラスとなりました。
このような一貫性は見過ごしにくいものです。
ビットコインを超えて機関投資家の関心が広がり、主要なアルトコインへと資金がますます流れ込んでいることを示しています。
このトレンドが続けば、市場の次の局面は非常に面白い展開になるかもしれません。👀📈
クリプトの流動性が動いており、アルトコイン市場がその影響を感じ始めています。
$SOL $ETH $BTC
イーサリアムETFが勢いを維持し続けています。🔥
ETH ETFはこれで11回連続で資金流入を記録しており、XRPとソラナのファンドもそれぞれ10日連続のプラスとなりました。
このような一貫性は見過ごしにくいものです。
ビットコインを超えて機関投資家の関心が広がり、主要なアルトコインへと資金がますます流れ込んでいることを示しています。
このトレンドが続けば、市場の次の局面は非常に面白い展開になるかもしれません。👀📈
クリプトの流動性が動いており、アルトコイン市場がその影響を感じ始めています。
$SOL $ETH $BTC
ETH ETFはこれで11回連続で資金流入を記録しており、XRPとソラナのファンドもそれぞれ10日連続のプラスとなりました。
このような一貫性は見過ごしにくいものです。
ビットコインを超えて機関投資家の関心が広がり、主要なアルトコインへと資金がますます流れ込んでいることを示しています。
このトレンドが続けば、市場の次の局面は非常に面白い展開になるかもしれません。👀📈
クリプトの流動性が動いており、アルトコイン市場がその影響を感じ始めています。
$SOL $ETH $BTC
65
🎂 BNB Chain のお誕生日おめでとう 🟡
6年前、BNB Smart Chain はシンプルな使命を掲げてスタートしました。それは、Web3 を次の10億人のユーザーに向けて、より速く、より安く、そして誰でも利用できる形にすることです。
今日それがどうなったか見てみましょう 👇
🚀 生態系全体で 5,000+ のプロジェクトが構築中
👥 611M+ のユニークな BSC アドレス
⚡ 毎日 31M 回のトランザクションを達成し、過去最高を更新
💰 ピーク時の TVL は 14B+ ドル
🏦 トークン化された実世界資産(RWA)で 1.8B+ ドル
💵 ピーク時のステーブルコイン市場規模は 14B ドル
🔥 悪意ある MEV 攻撃が 95% 削減
⛽ ガス代は 0.001 ドルまで低下
🌐 BNB Chain は BSC を超えて、opBNB と BNB Greenfield により拡張し、DeFi、AI、ゲーム、決済、RWA などのためのより広範なインフラを構築しています。
そしてネットワークは進化を続けています。
現在、BNB Chain は毎日のアクティブユーザーを数百万人規模で処理しながら、より速いファイナリティ、より低い手数料、そしてさらなるスケーラビリティを目指しています。
DeFi サマーからステーブルコイン、RWA、AI、そして次世代の Web3 アプリケーションに至るまで、BNB Chain は暗号資産を何百万人ものユーザーに届けるうえで大きな役割を果たしてきました。
6年が経ちました。
次の10億人のユーザーは、まだ待っています。
お誕生日おめでとう、BNB Chain! 🟡
#BNBChain #BNB #BNBDay #Web3 #Crypto
$BNB
🎂 BNB Chain のお誕生日おめでとう 🟡
6年前、BNB Smart Chain はシンプルな使命を掲げてスタートしました。それは、Web3 を次の10億人のユーザーに向けて、より速く、より安く、そして誰でも利用できる形にすることです。
今日それがどうなったか見てみましょう 👇
🚀 生態系全体で 5,000+ のプロジェクトが構築中
👥 611M+ のユニークな BSC アドレス
⚡ 毎日 31M 回のトランザクションを達成し、過去最高を更新
💰 ピーク時の TVL は 14B+ ドル
🏦 トークン化された実世界資産(RWA)で 1.8B+ ドル
💵 ピーク時のステーブルコイン市場規模は 14B ドル
🔥 悪意ある MEV 攻撃が 95% 削減
⛽ ガス代は 0.001 ドルまで低下
🌐 BNB Chain は BSC を超えて、opBNB と BNB Greenfield により拡張し、DeFi、AI、ゲーム、決済、RWA などのためのより広範なインフラを構築しています。
そしてネットワークは進化を続けています。
現在、BNB Chain は毎日のアクティブユーザーを数百万人規模で処理しながら、より速いファイナリティ、より低い手数料、そしてさらなるスケーラビリティを目指しています。
DeFi サマーからステーブルコイン、RWA、AI、そして次世代の Web3 アプリケーションに至るまで、BNB Chain は暗号資産を何百万人ものユーザーに届けるうえで大きな役割を果たしてきました。
6年が経ちました。
次の10億人のユーザーは、まだ待っています。
お誕生日おめでとう、BNB Chain! 🟡
#BNBChain #BNB #BNBDay #Web3 #Crypto
$BNB
6年前、BNB Smart Chain はシンプルな使命を掲げてスタートしました。それは、Web3 を次の10億人のユーザーに向けて、より速く、より安く、そして誰でも利用できる形にすることです。
今日それがどうなったか見てみましょう 👇
🚀 生態系全体で 5,000+ のプロジェクトが構築中
👥 611M+ のユニークな BSC アドレス
⚡ 毎日 31M 回のトランザクションを達成し、過去最高を更新
💰 ピーク時の TVL は 14B+ ドル
🏦 トークン化された実世界資産(RWA)で 1.8B+ ドル
💵 ピーク時のステーブルコイン市場規模は 14B ドル
🔥 悪意ある MEV 攻撃が 95% 削減
⛽ ガス代は 0.001 ドルまで低下
🌐 BNB Chain は BSC を超えて、opBNB と BNB Greenfield により拡張し、DeFi、AI、ゲーム、決済、RWA などのためのより広範なインフラを構築しています。
そしてネットワークは進化を続けています。
現在、BNB Chain は毎日のアクティブユーザーを数百万人規模で処理しながら、より速いファイナリティ、より低い手数料、そしてさらなるスケーラビリティを目指しています。
DeFi サマーからステーブルコイン、RWA、AI、そして次世代の Web3 アプリケーションに至るまで、BNB Chain は暗号資産を何百万人ものユーザーに届けるうえで大きな役割を果たしてきました。
6年が経ちました。
次の10億人のユーザーは、まだ待っています。
お誕生日おめでとう、BNB Chain! 🟡
#BNBChain #BNB #BNBDay #Web3 #Crypto
$BNB

81
翻訳参照
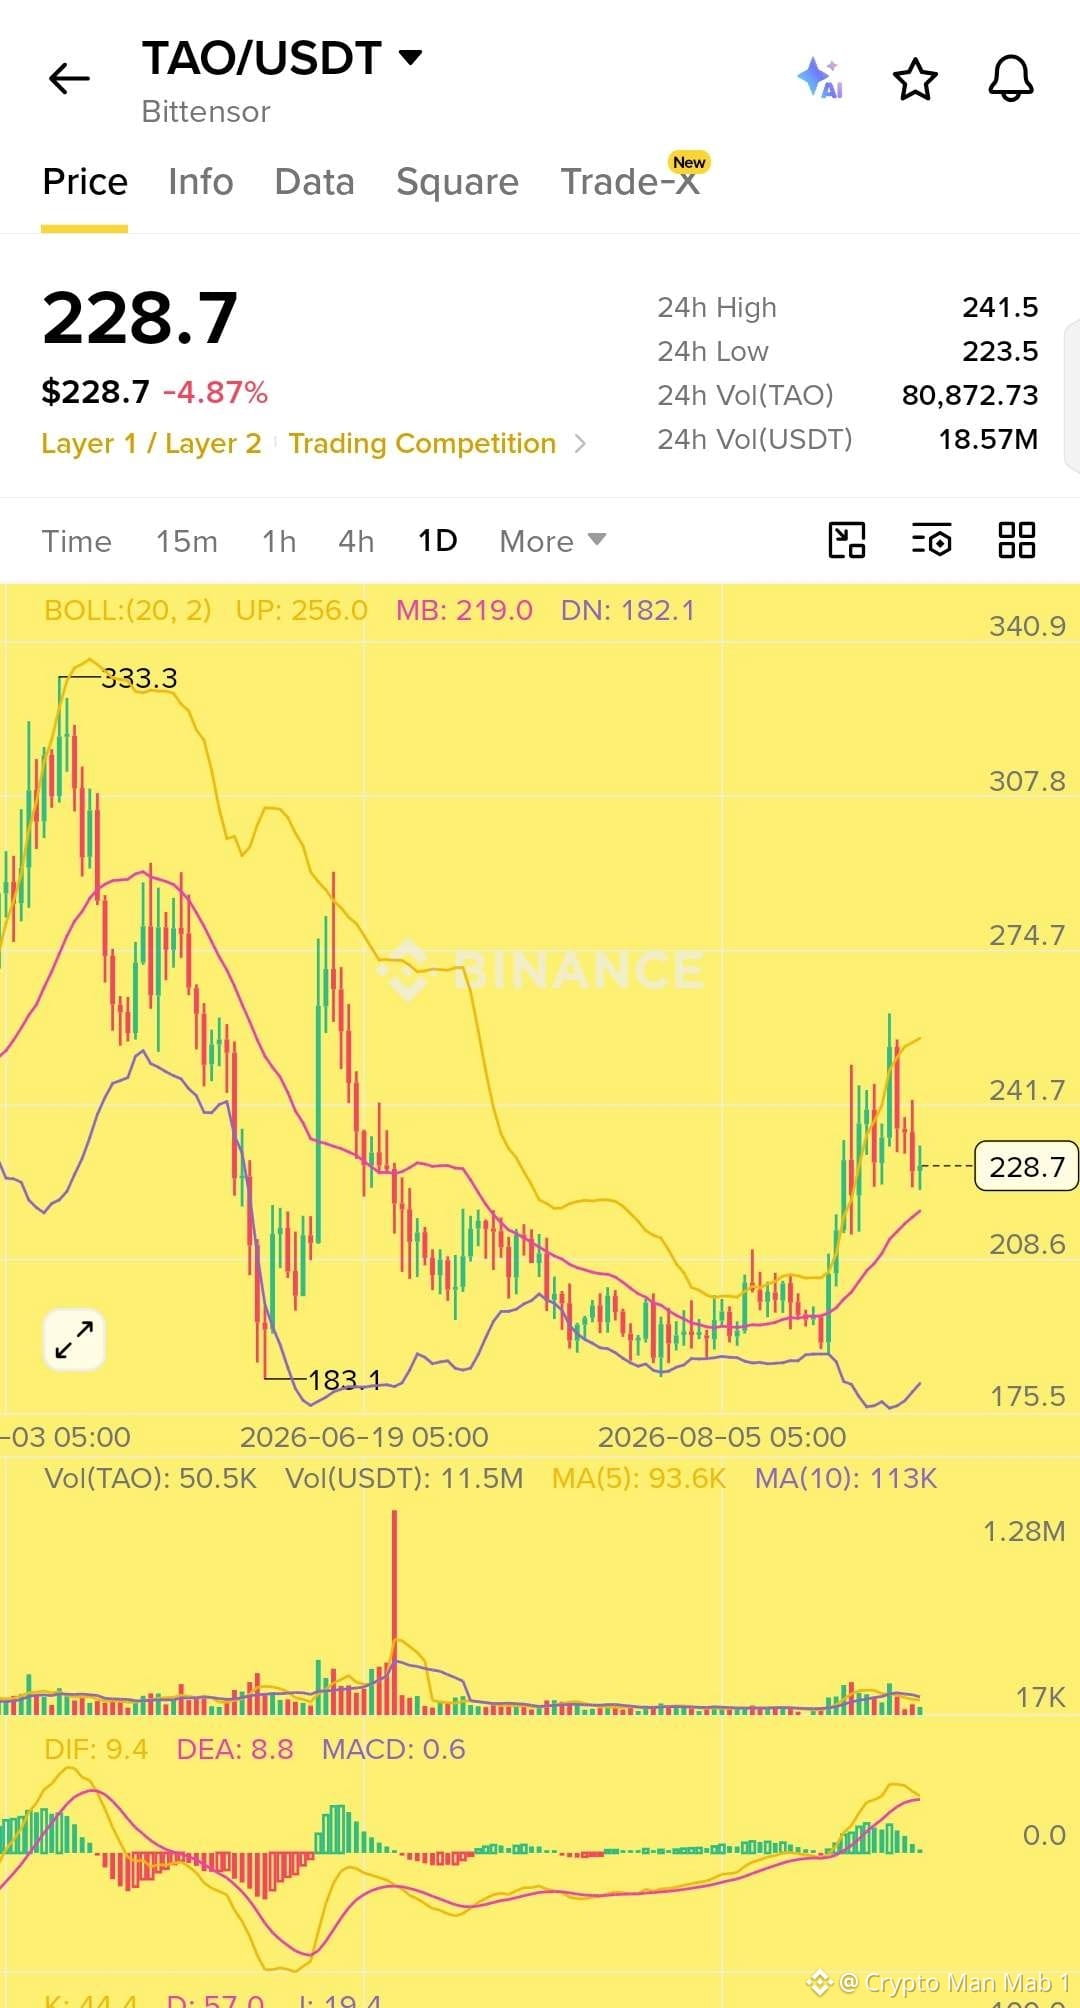
$TAO is looking interesting after the recent breakout 👀
Price pushed above $240 but is now cooling off around $228. The important thing is that the overall structure still looks stronger than it did during the previous downtrend.
The daily Bollinger middle band is around $219, while MACD is still in positive territory. Volume also picked up during the breakout, showing that there was real buying interest behind the move.
Right now, TAO looks like it’s taking a breather after the rally. If buyers step back in and price manages to reclaim the $240 area, that could be an important sign that the bullish momentum is returning.
For now, I’d watch how price behaves around the $220 to $225 region rather than chasing the move. 📈
$TAO is looking interesting after the recent breakout 👀
Price pushed above $240 but is now cooling off around $228. The important thing is that the overall structure still looks stronger than it did during the previous downtrend.
The daily Bollinger middle band is around $219, while MACD is still in positive territory. Volume also picked up during the breakout, showing that there was real buying interest behind the move.
Right now, TAO looks like it’s taking a breather after the rally. If buyers step back in and price manages to reclaim the $240 area, that could be an important sign that the bullish momentum is returning.
For now, I’d watch how price behaves around the $220 to $225 region rather than chasing the move. 📈
Price pushed above $240 but is now cooling off around $228. The important thing is that the overall structure still looks stronger than it did during the previous downtrend.
The daily Bollinger middle band is around $219, while MACD is still in positive territory. Volume also picked up during the breakout, showing that there was real buying interest behind the move.
Right now, TAO looks like it’s taking a breather after the rally. If buyers step back in and price manages to reclaim the $240 area, that could be an important sign that the bullish momentum is returning.
For now, I’d watch how price behaves around the $220 to $225 region rather than chasing the move. 📈
71
翻訳参照
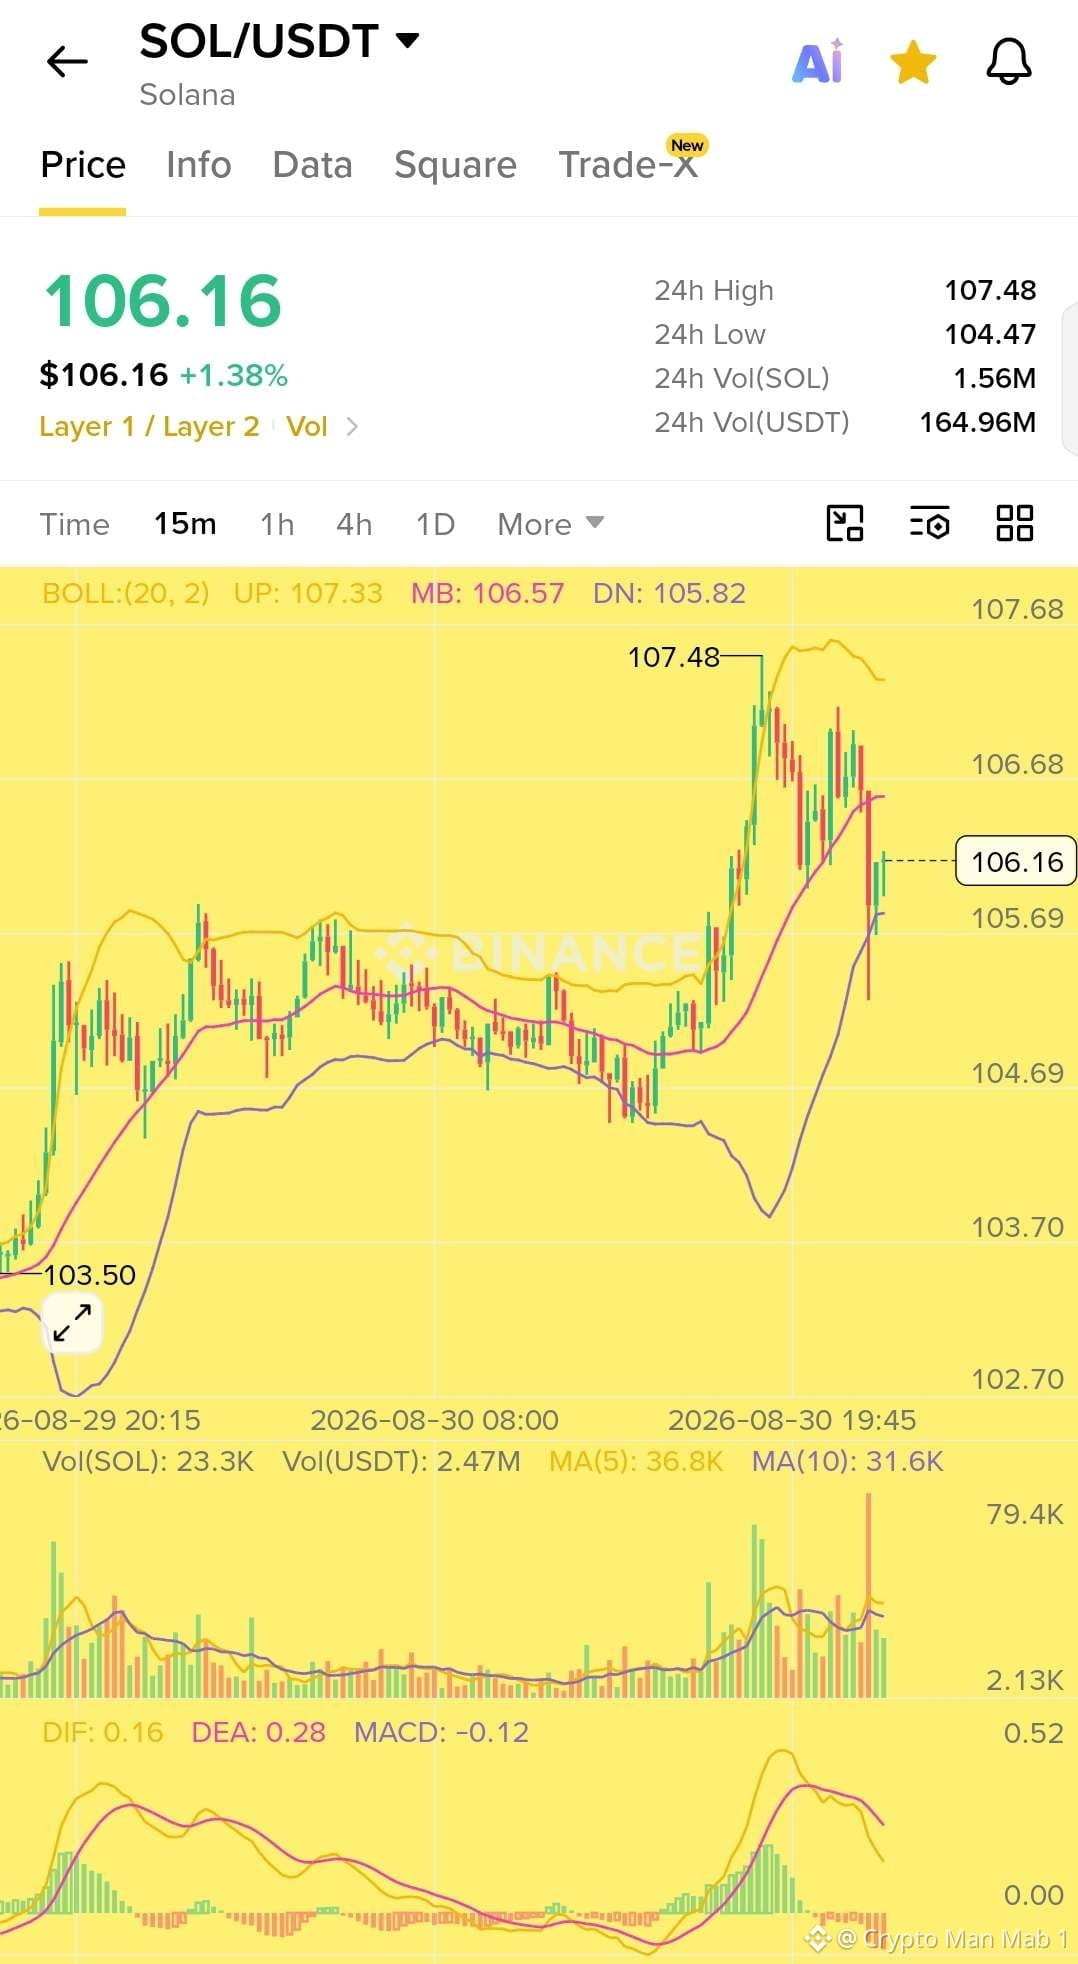
$SOLSolana governance vote delivers 25% transaction speed boost
A recent on-chain governance vote on the Solana network has resulted in a 25% increase in transaction speed, marking a notable improvement in network efficiency.
The upgrade was passed through Solana's on-chain governance process, reflecting the network's ability to implement protocol-level changes through community consensus.
$SOLSolana governance vote delivers 25% transaction speed boost
A recent on-chain governance vote on the Solana network has resulted in a 25% increase in transaction speed, marking a notable improvement in network efficiency.
The upgrade was passed through Solana's on-chain governance process, reflecting the network's ability to implement protocol-level changes through community consensus.
A recent on-chain governance vote on the Solana network has resulted in a 25% increase in transaction speed, marking a notable improvement in network efficiency.
The upgrade was passed through Solana's on-chain governance process, reflecting the network's ability to implement protocol-level changes through community consensus.
72
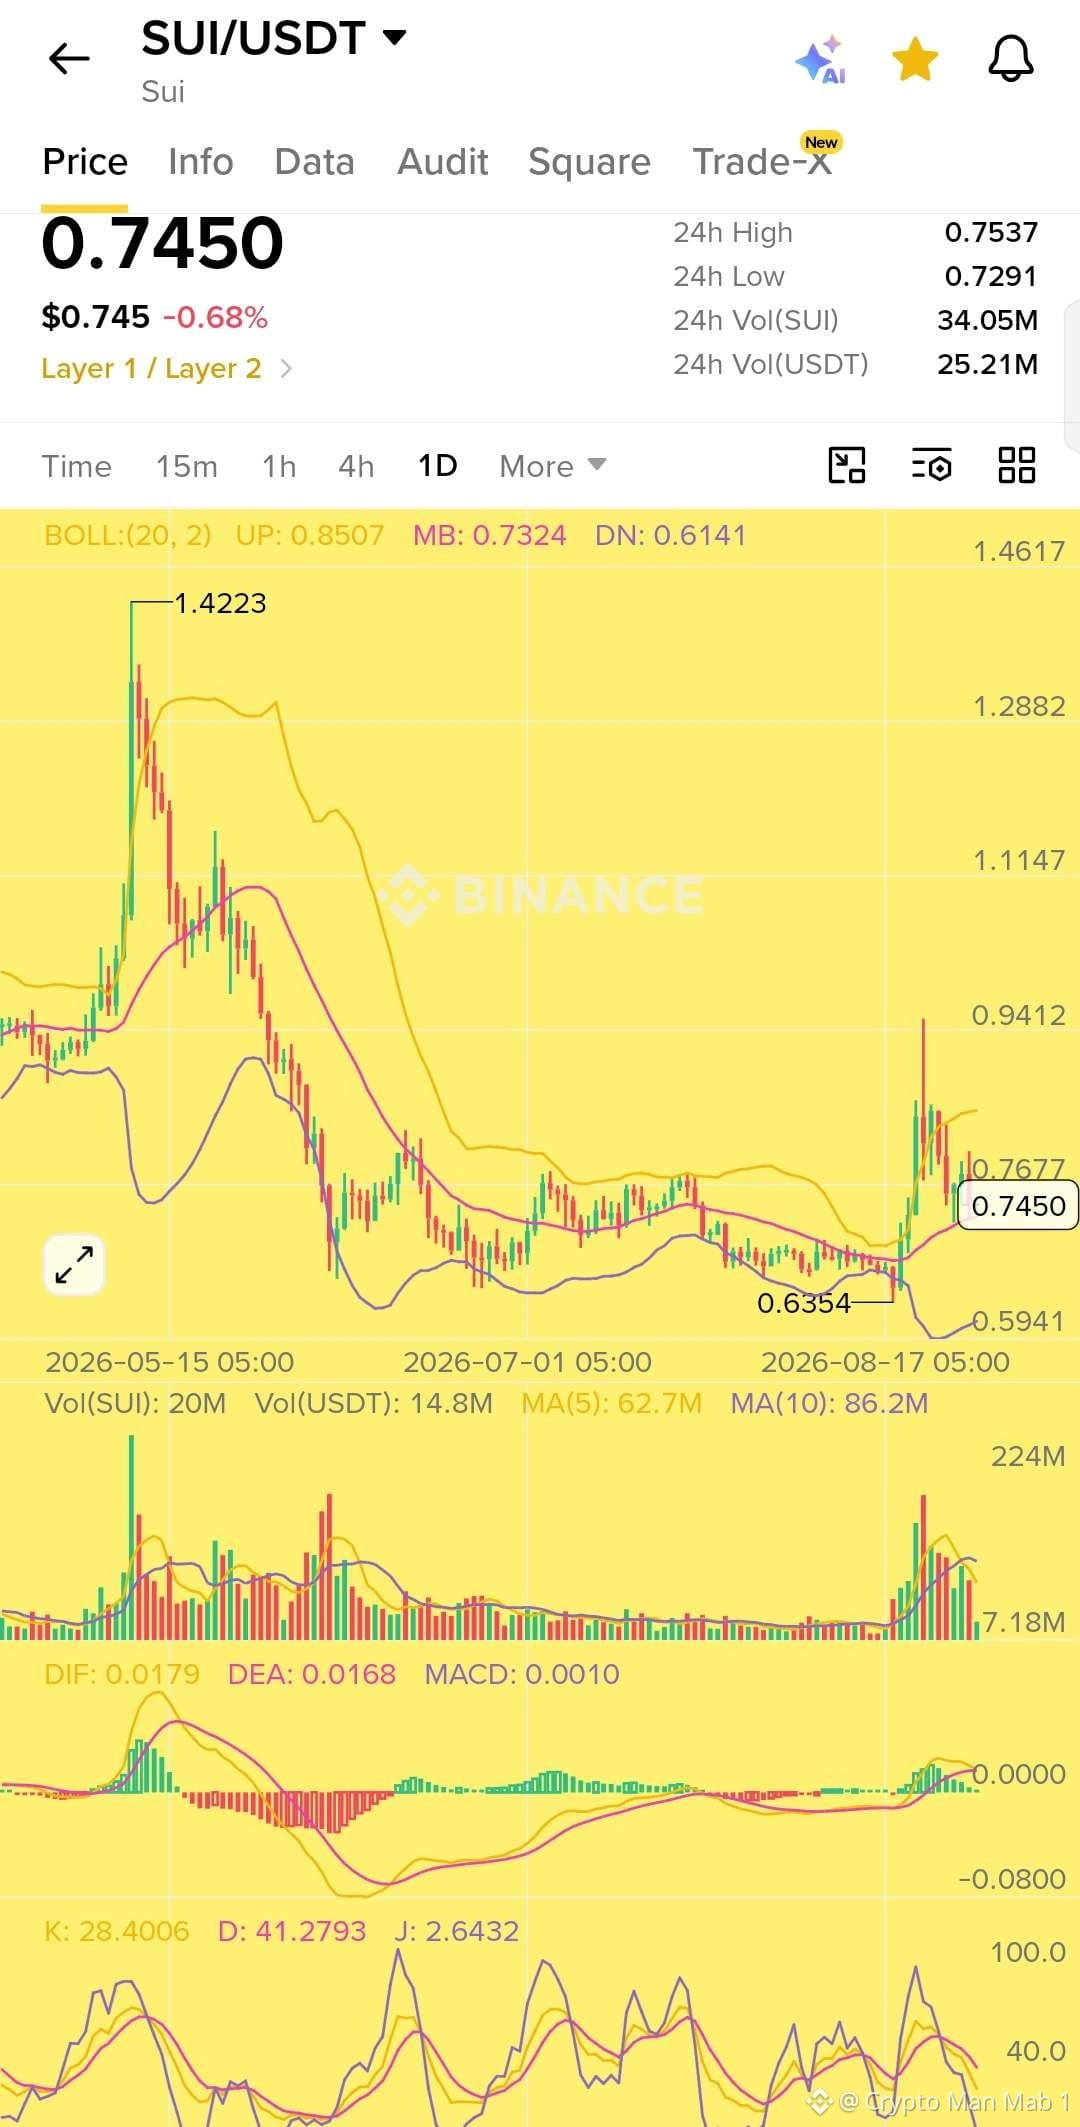
$SUIはここで俄然面白くなってきています👀
価格は約$0.745で推移しており、$0.732付近のボリンジャー・ミドルバンド上に留まることに成功しています。MACDもポジティブなモメンタムを示しており、最近の動きの後に出来高も増えてきています。
今注目すべき重要な水準は$0.767です。このエリアを上回る強い日足の終値が出れば、$0.80→$0.85、そして場合によっては$0.94へ向かう道が開けるかもしれません。
私にとっては、$0.72〜$0.75はロングの良いセットアップを狙うのに興味深いゾーンです。
エントリー: $0.72 to $0.75
確定条件: $0.767を上抜けて終値で確定
TP: $0.80 $0.85 $0.94
SL: $0.70
もし$0.70が強い売り圧力で割れてくるなら、ロングは避けます。$0.635が再び視野に入ってくる可能性があるためです。
ここから$SUIをしっかり監視します。📈
$SUIはここで俄然面白くなってきています👀
価格は約$0.745で推移しており、$0.732付近のボリンジャー・ミドルバンド上に留まることに成功しています。MACDもポジティブなモメンタムを示しており、最近の動きの後に出来高も増えてきています。
今注目すべき重要な水準は$0.767です。このエリアを上回る強い日足の終値が出れば、$0.80→$0.85、そして場合によっては$0.94へ向かう道が開けるかもしれません。
私にとっては、$0.72〜$0.75はロングの良いセットアップを狙うのに興味深いゾーンです。
エントリー: $0.72 to $0.75
確定条件: $0.767を上抜けて終値で確定
TP: $0.80 $0.85 $0.94
SL: $0.70
もし$0.70が強い売り圧力で割れてくるなら、ロングは避けます。$0.635が再び視野に入ってくる可能性があるためです。
ここから$SUIをしっかり監視します。📈
価格は約$0.745で推移しており、$0.732付近のボリンジャー・ミドルバンド上に留まることに成功しています。MACDもポジティブなモメンタムを示しており、最近の動きの後に出来高も増えてきています。
今注目すべき重要な水準は$0.767です。このエリアを上回る強い日足の終値が出れば、$0.80→$0.85、そして場合によっては$0.94へ向かう道が開けるかもしれません。
私にとっては、$0.72〜$0.75はロングの良いセットアップを狙うのに興味深いゾーンです。
エントリー: $0.72 to $0.75
確定条件: $0.767を上抜けて終値で確定
TP: $0.80 $0.85 $0.94
SL: $0.70
もし$0.70が強い売り圧力で割れてくるなら、ロングは避けます。$0.635が再び視野に入ってくる可能性があるためです。
ここから$SUIをしっかり監視します。📈
76
$BTC 🟠 ビットコイン、初の量子耐性(Quantum Safe)トランザクションを完了
ビットコインは、QSB(Quantum Safe Bitcoin)または量子耐性ビットコインで保護された初の取引を完了したと報じられている。
この新しいアプローチは、理論上は強力な量子コンピューターによって、ビットコインが現在依拠している楕円曲線暗号(ECC)を破られる可能性があるショアのアルゴリズムからビットコインを守ることを目的としている。
QSBが興味深いのは、ビットコインの既存のレガシー(旧来の)ルールの範囲内で機能する点だ。取引を実行するためにハードフォークやコンセンサスの変更は必要とされなかった。
量子コンピューティングの進歩が続く中で、これは将来的な暗号上の脅威に対してビットコインをより強靭にするための重要な一歩になるかもしれない。
量子コンピューティングが現実的な脅威として迫るまでにはまだ数年かかる可能性はあるが、今日それに備えることは、ビットコインの長期的なセキュリティにとって最も重要な課題の一つになり得る。🟠
$BTC 🟠 ビットコイン、初の量子耐性(Quantum Safe)トランザクションを完了
ビットコインは、QSB(Quantum Safe Bitcoin)または量子耐性ビットコインで保護された初の取引を完了したと報じられている。
この新しいアプローチは、理論上は強力な量子コンピューターによって、ビットコインが現在依拠している楕円曲線暗号(ECC)を破られる可能性があるショアのアルゴリズムからビットコインを守ることを目的としている。
QSBが興味深いのは、ビットコインの既存のレガシー(旧来の)ルールの範囲内で機能する点だ。取引を実行するためにハードフォークやコンセンサスの変更は必要とされなかった。
量子コンピューティングの進歩が続く中で、これは将来的な暗号上の脅威に対してビットコインをより強靭にするための重要な一歩になるかもしれない。
量子コンピューティングが現実的な脅威として迫るまでにはまだ数年かかる可能性はあるが、今日それに備えることは、ビットコインの長期的なセキュリティにとって最も重要な課題の一つになり得る。🟠
ビットコインは、QSB(Quantum Safe Bitcoin)または量子耐性ビットコインで保護された初の取引を完了したと報じられている。
この新しいアプローチは、理論上は強力な量子コンピューターによって、ビットコインが現在依拠している楕円曲線暗号(ECC)を破られる可能性があるショアのアルゴリズムからビットコインを守ることを目的としている。
QSBが興味深いのは、ビットコインの既存のレガシー(旧来の)ルールの範囲内で機能する点だ。取引を実行するためにハードフォークやコンセンサスの変更は必要とされなかった。
量子コンピューティングの進歩が続く中で、これは将来的な暗号上の脅威に対してビットコインをより強靭にするための重要な一歩になるかもしれない。
量子コンピューティングが現実的な脅威として迫るまでにはまだ数年かかる可能性はあるが、今日それに備えることは、ビットコインの長期的なセキュリティにとって最も重要な課題の一つになり得る。🟠

68
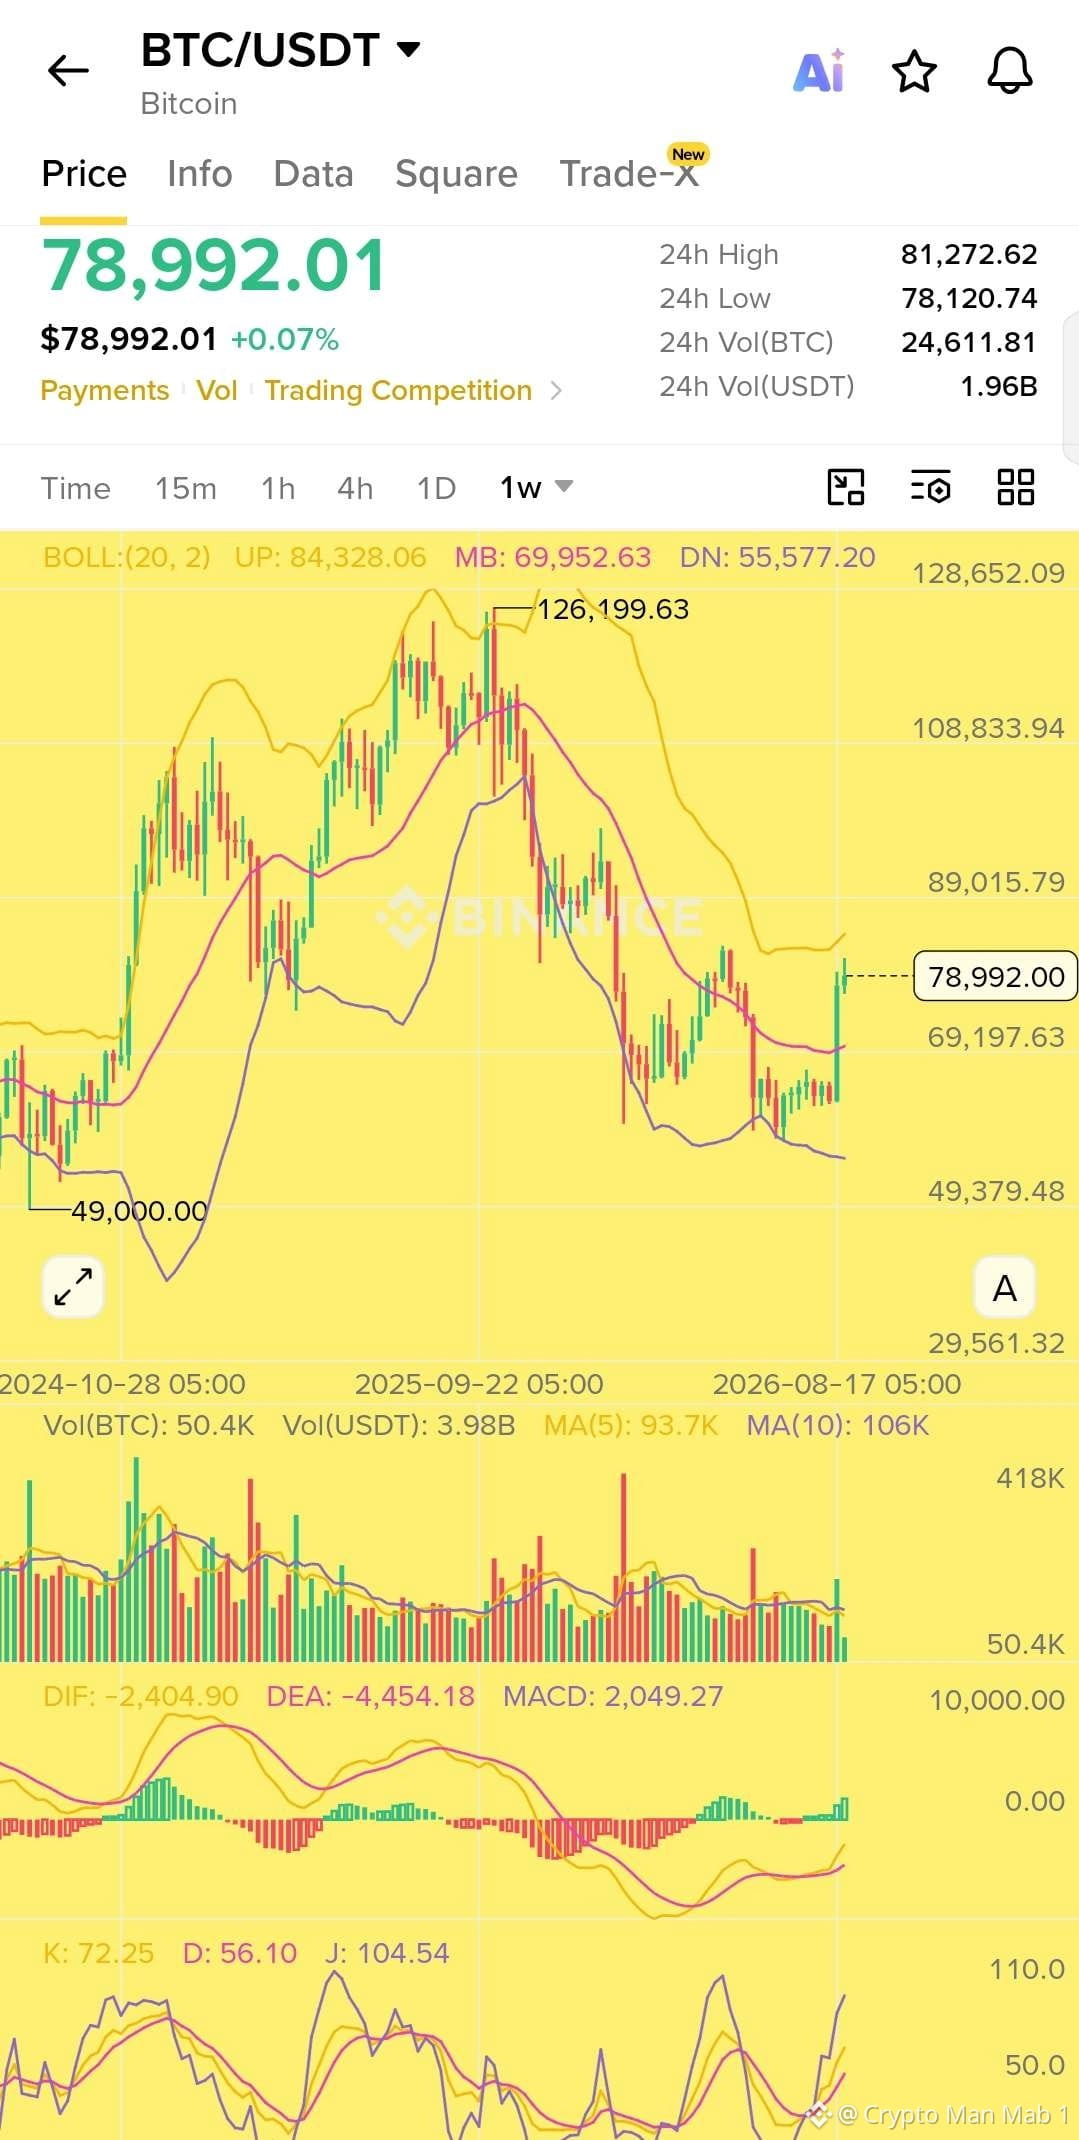
$BTC はまた面白くなってきた 👀
週足チャートでは、$55Kゾーンから強く反発した後に、ビットコインが再び$78Kの上に押し戻されました。
いま重要な水準は$81K〜$84Kです。ここで、売りがこの上昇の強さを試しに来ると見ています。
もしBTCが$84.3Kを上回って週を跨いでクローズするなら、次に注目すべき大きなエリアはおよそ$89Kです。
モメンタムも改善しています。MACDはプラスに転じ、週足の構造は数週間前よりもかなり強く見えます。
ただ、ここでポンプを盲目的に追いかけるつもりはありません。
もしBTCが$81K〜$84Kから拒否(跳ね返される)されるなら、$75K、あるいは$70Kに向けた押し戻しが起きても不思議ではありません。
私にとっての鍵となる水準は引き続き$70Kです。
それより上なら、まだ強気です。
今、BTCにはこの回復が単なるリバウンド以上のものだと証明してもらう必要があります。 👀
$BTC はまた面白くなってきた 👀
週足チャートでは、$55Kゾーンから強く反発した後に、ビットコインが再び$78Kの上に押し戻されました。
いま重要な水準は$81K〜$84Kです。ここで、売りがこの上昇の強さを試しに来ると見ています。
もしBTCが$84.3Kを上回って週を跨いでクローズするなら、次に注目すべき大きなエリアはおよそ$89Kです。
モメンタムも改善しています。MACDはプラスに転じ、週足の構造は数週間前よりもかなり強く見えます。
ただ、ここでポンプを盲目的に追いかけるつもりはありません。
もしBTCが$81K〜$84Kから拒否(跳ね返される)されるなら、$75K、あるいは$70Kに向けた押し戻しが起きても不思議ではありません。
私にとっての鍵となる水準は引き続き$70Kです。
それより上なら、まだ強気です。
今、BTCにはこの回復が単なるリバウンド以上のものだと証明してもらう必要があります。 👀
週足チャートでは、$55Kゾーンから強く反発した後に、ビットコインが再び$78Kの上に押し戻されました。
いま重要な水準は$81K〜$84Kです。ここで、売りがこの上昇の強さを試しに来ると見ています。
もしBTCが$84.3Kを上回って週を跨いでクローズするなら、次に注目すべき大きなエリアはおよそ$89Kです。
モメンタムも改善しています。MACDはプラスに転じ、週足の構造は数週間前よりもかなり強く見えます。
ただ、ここでポンプを盲目的に追いかけるつもりはありません。
もしBTCが$81K〜$84Kから拒否(跳ね返される)されるなら、$75K、あるいは$70Kに向けた押し戻しが起きても不思議ではありません。
私にとっての鍵となる水準は引き続き$70Kです。
それより上なら、まだ強気です。
今、BTCにはこの回復が単なるリバウンド以上のものだと証明してもらう必要があります。 👀
93
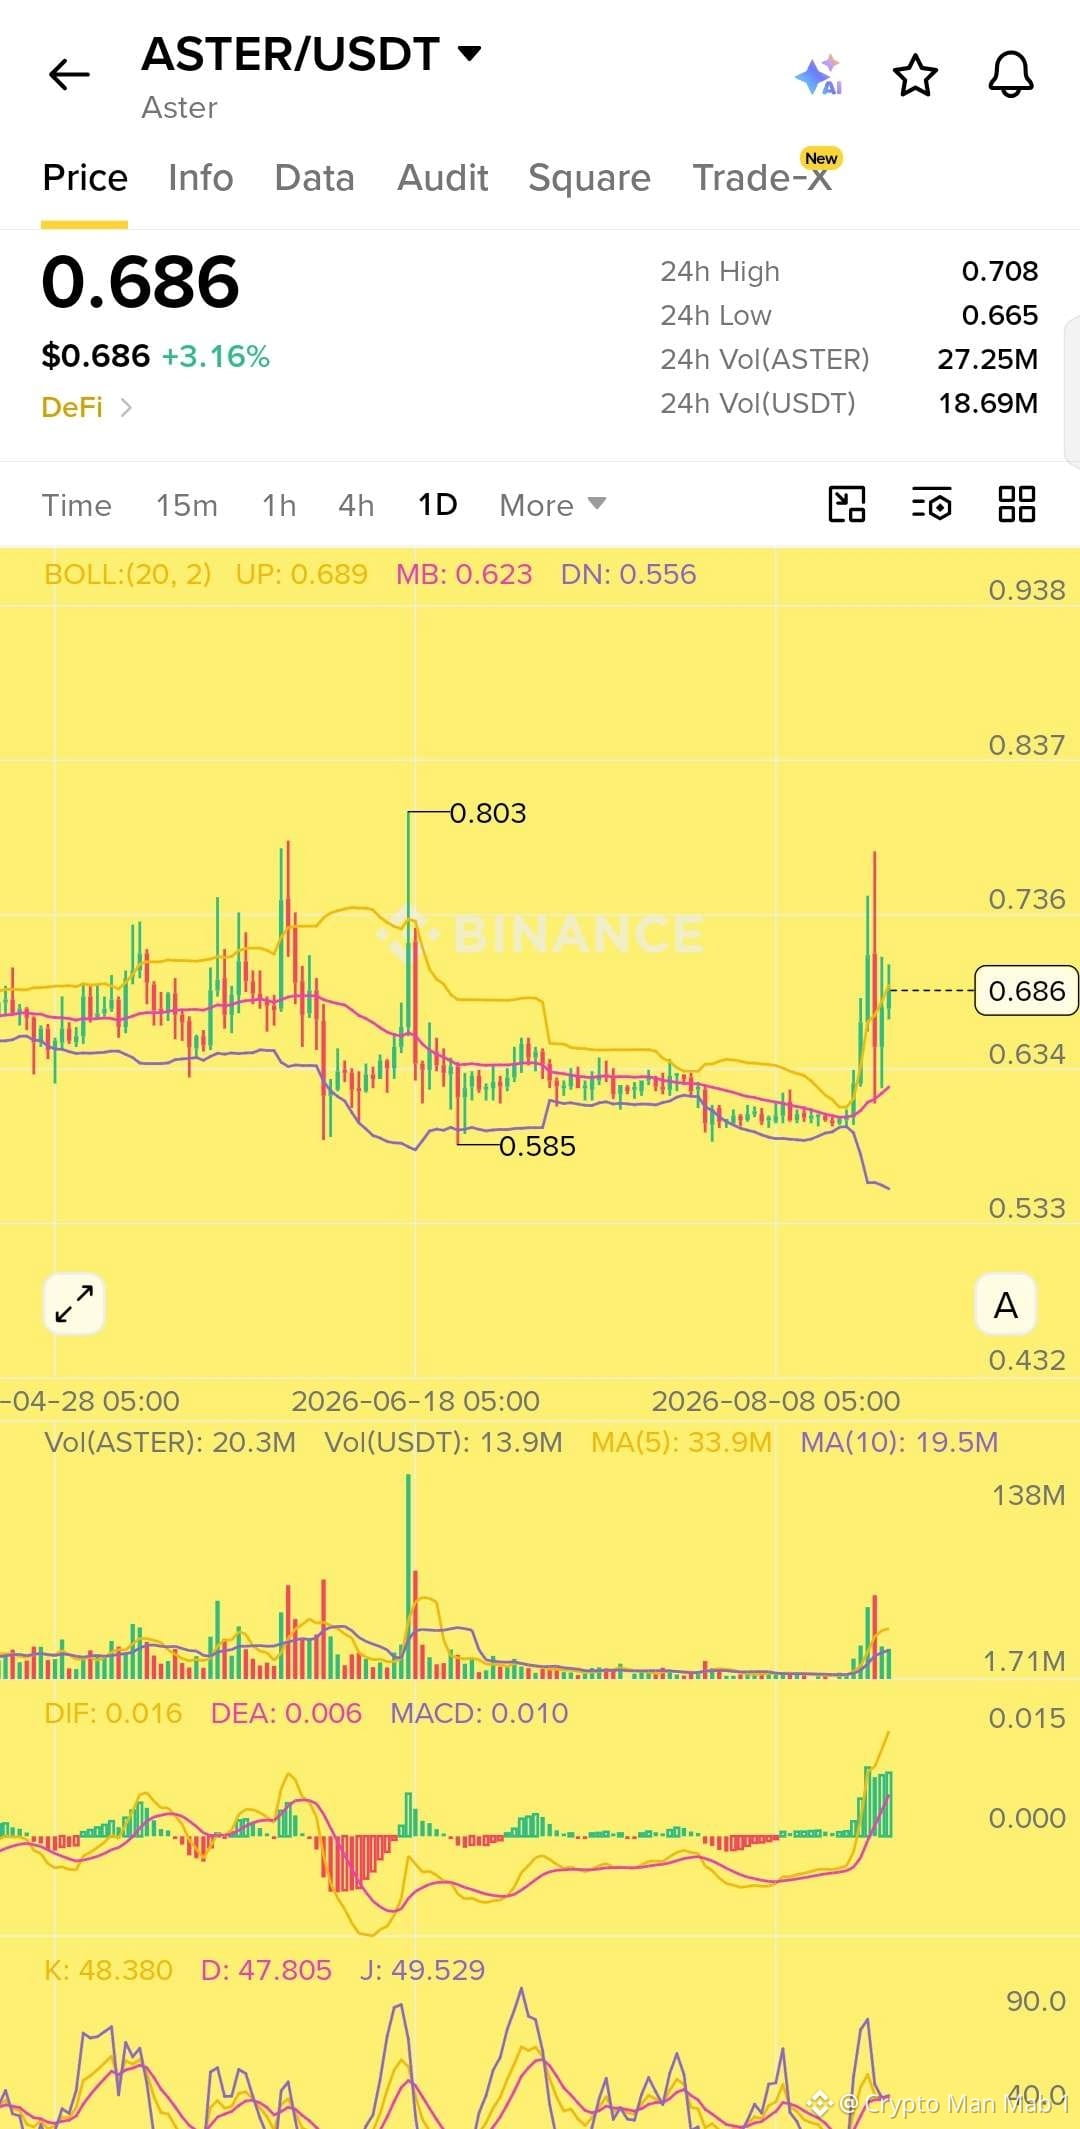
$ASTER とWorld LibertyFiは、USD1市場に向けて大規模な報酬を拡大します 👀
Asterは、2026年12月31日まで実施されるUSD1 RWAキャンペーンの第1フェーズを開始しました。
キャンペーンには以下が含まれます:
対象となる建玉(オープンインタレスト)に基づく125M $WLFI 報酬
対象となる取引出来高に基づく6.25M $USD1 報酬
そして興味深いのは、建玉と取引出来高が別々に計算されるため、2つの報酬プールの両方を獲得できることです。
さらにAsterは、対象となるUSD1建てのRWAポジションに対して、建玉(オープンインタレスト)を2倍にする優遇を提供します。
Single Asset Modeで最大のブーストを得るには、担保としてUSD1のみを使用する必要があります。
Multi Asset Modeでは、USD1が平均担保の50%以上を占める必要があります。
これは、取引しながら報酬を最大化したいトレーダーにとって、USD1 RWA市場を非常に魅力的にする可能性があります。
この動きから目が離せませんね 👀
$ASTER とWorld LibertyFiは、USD1市場に向けて大規模な報酬を拡大します 👀
Asterは、2026年12月31日まで実施されるUSD1 RWAキャンペーンの第1フェーズを開始しました。
キャンペーンには以下が含まれます:
対象となる建玉(オープンインタレスト)に基づく125M $WLFI 報酬
対象となる取引出来高に基づく6.25M $USD1 報酬
そして興味深いのは、建玉と取引出来高が別々に計算されるため、2つの報酬プールの両方を獲得できることです。
さらにAsterは、対象となるUSD1建てのRWAポジションに対して、建玉(オープンインタレスト)を2倍にする優遇を提供します。
Single Asset Modeで最大のブーストを得るには、担保としてUSD1のみを使用する必要があります。
Multi Asset Modeでは、USD1が平均担保の50%以上を占める必要があります。
これは、取引しながら報酬を最大化したいトレーダーにとって、USD1 RWA市場を非常に魅力的にする可能性があります。
この動きから目が離せませんね 👀
Asterは、2026年12月31日まで実施されるUSD1 RWAキャンペーンの第1フェーズを開始しました。
キャンペーンには以下が含まれます:
対象となる建玉(オープンインタレスト)に基づく125M $WLFI 報酬
対象となる取引出来高に基づく6.25M $USD1 報酬
そして興味深いのは、建玉と取引出来高が別々に計算されるため、2つの報酬プールの両方を獲得できることです。
さらにAsterは、対象となるUSD1建てのRWAポジションに対して、建玉(オープンインタレスト)を2倍にする優遇を提供します。
Single Asset Modeで最大のブーストを得るには、担保としてUSD1のみを使用する必要があります。
Multi Asset Modeでは、USD1が平均担保の50%以上を占める必要があります。
これは、取引しながら報酬を最大化したいトレーダーにとって、USD1 RWA市場を非常に魅力的にする可能性があります。
この動きから目が離せませんね 👀
70
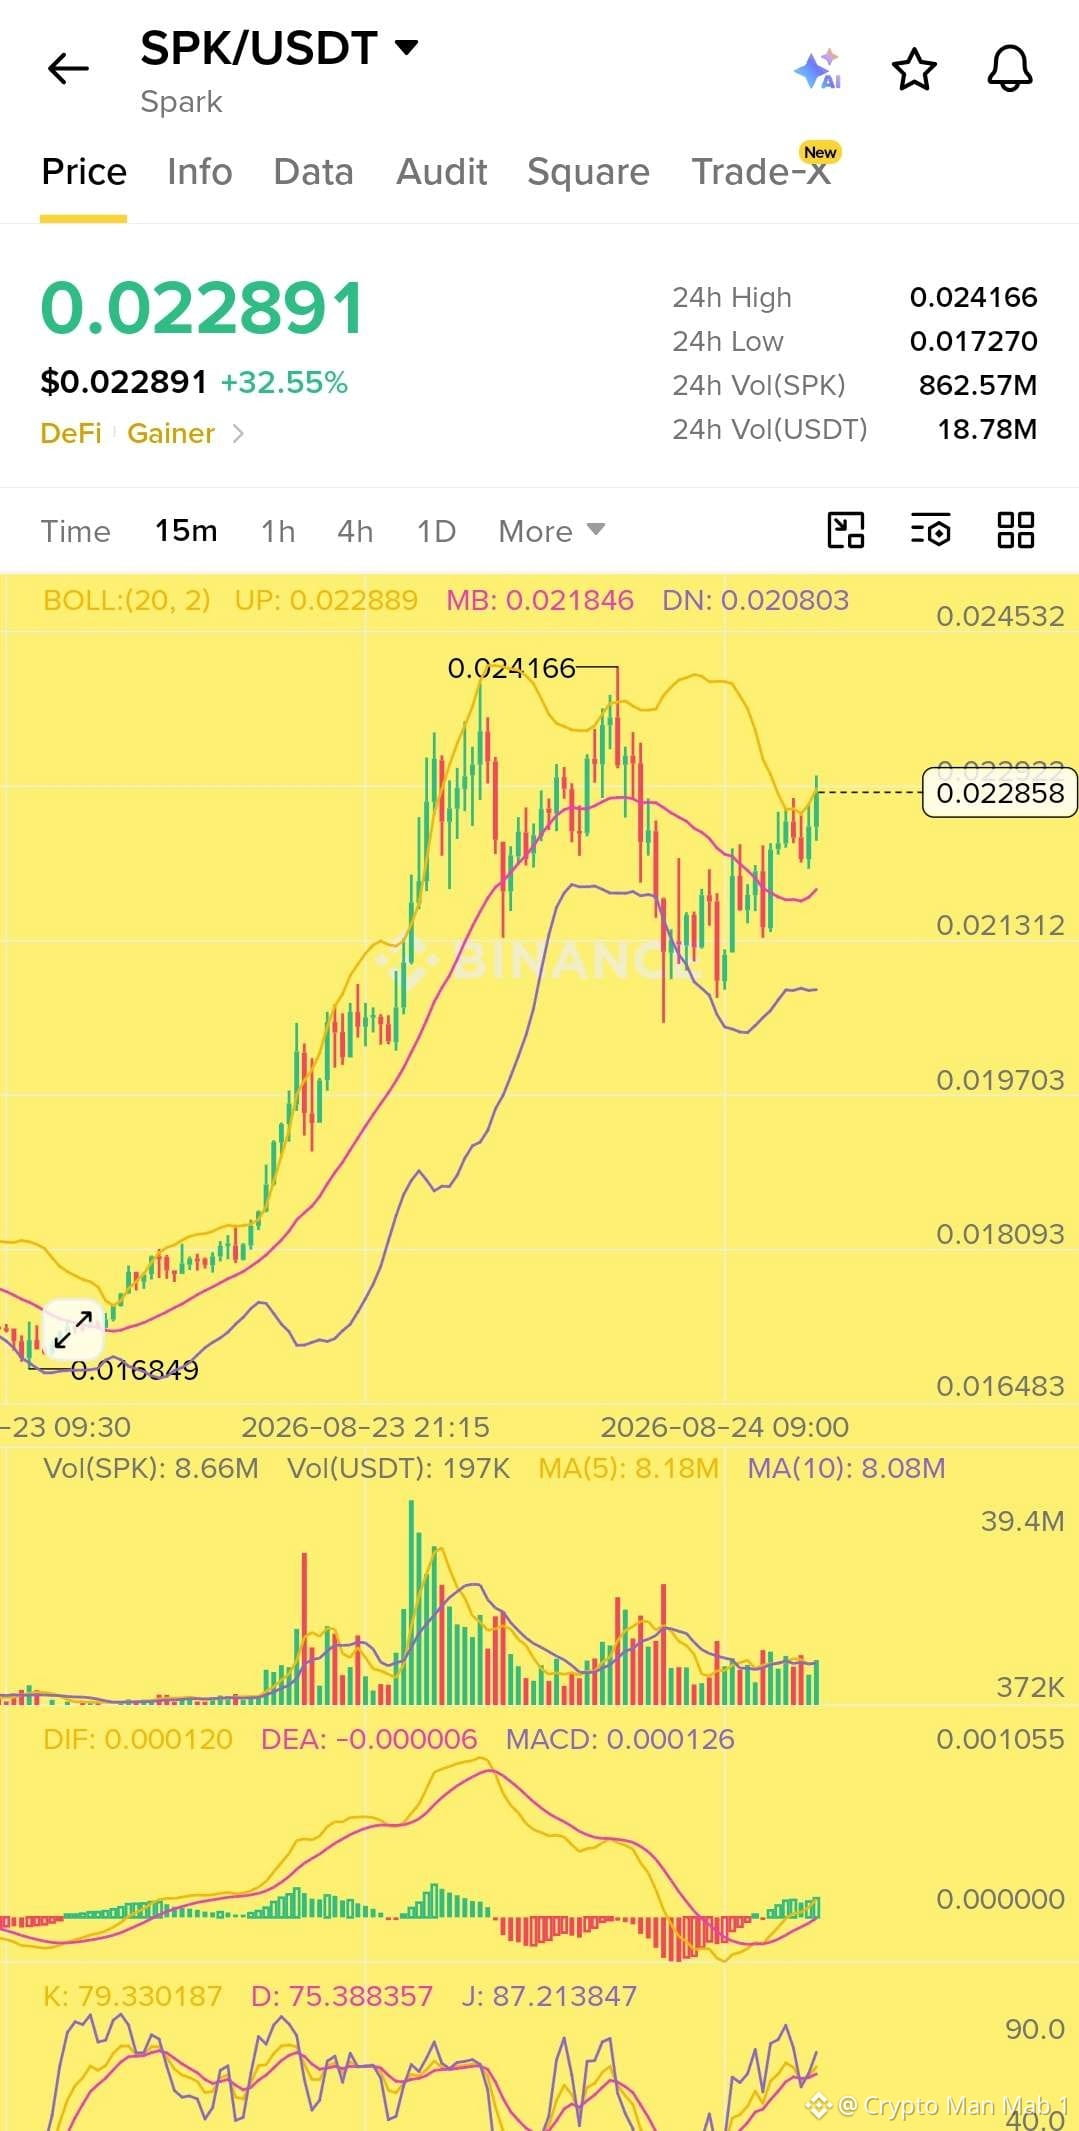
$SPKは15分足チャートで強い強気モメンタムを示しています📈
価格は強い上昇の後、現在およそ$0.02289です。MACDは強気方向に転じており、ボリンジャーのミドルバンドの上で価格が維持されているため、短期の構造はポジティブです。
注目すべき重要ゾーンは$0.0230-$0.0232です。強い出来高を伴う明確なブレイクアウトがあれば、$0.0238への道が開け、その後24時間高値である約$0.02416が視野に入ります。
ただしKDJはすでに買われ過ぎゾーンにあるため、いまの価格を追いかけるのはリスクがあります。サポートが維持されるなら、$0.0220-$0.0223への押し目がより良いロングエントリーの機会になる可能性があります。
サポート: $0.0220-$0.0223
レジスタンス: $0.0230-$0.0232
次の目標: $0.0238-$0.02416
サポートの上では強気ですが、レジスタンス付近での反落(リジェクション)に注意してください。DYOR.
$SPKは15分足チャートで強い強気モメンタムを示しています📈
価格は強い上昇の後、現在およそ$0.02289です。MACDは強気方向に転じており、ボリンジャーのミドルバンドの上で価格が維持されているため、短期の構造はポジティブです。
注目すべき重要ゾーンは$0.0230-$0.0232です。強い出来高を伴う明確なブレイクアウトがあれば、$0.0238への道が開け、その後24時間高値である約$0.02416が視野に入ります。
ただしKDJはすでに買われ過ぎゾーンにあるため、いまの価格を追いかけるのはリスクがあります。サポートが維持されるなら、$0.0220-$0.0223への押し目がより良いロングエントリーの機会になる可能性があります。
サポート: $0.0220-$0.0223
レジスタンス: $0.0230-$0.0232
次の目標: $0.0238-$0.02416
サポートの上では強気ですが、レジスタンス付近での反落(リジェクション)に注意してください。DYOR.
価格は強い上昇の後、現在およそ$0.02289です。MACDは強気方向に転じており、ボリンジャーのミドルバンドの上で価格が維持されているため、短期の構造はポジティブです。
注目すべき重要ゾーンは$0.0230-$0.0232です。強い出来高を伴う明確なブレイクアウトがあれば、$0.0238への道が開け、その後24時間高値である約$0.02416が視野に入ります。
ただしKDJはすでに買われ過ぎゾーンにあるため、いまの価格を追いかけるのはリスクがあります。サポートが維持されるなら、$0.0220-$0.0223への押し目がより良いロングエントリーの機会になる可能性があります。
サポート: $0.0220-$0.0223
レジスタンス: $0.0230-$0.0232
次の目標: $0.0238-$0.02416
サポートの上では強気ですが、レジスタンス付近での反落(リジェクション)に注意してください。DYOR.
75
翻訳参照
Zcash has officially hit its highest price in 8 years.
$ZEC surged 47% to $865, a level it hasn't seen since January 2018, according to CoinDesk.
Back in June, the token crashed to $250 after an AI discovered a critical counterfeiting vulnerability that had been live for four years. Since that low, $ZEC has rallied 3.4x.
The rally picked up speed after Grayscale filed to convert its Zcash Trust into what would be the first U.S. spot ZEC ETF, according to The Block.
Even with this surge, $ZEC is still roughly 73% below its all-time high of $3,191.
Zcash has officially hit its highest price in 8 years.
$ZEC surged 47% to $865, a level it hasn't seen since January 2018, according to CoinDesk.
Back in June, the token crashed to $250 after an AI discovered a critical counterfeiting vulnerability that had been live for four years. Since that low, $ZEC has rallied 3.4x.
The rally picked up speed after Grayscale filed to convert its Zcash Trust into what would be the first U.S. spot ZEC ETF, according to The Block.
Even with this surge, $ZEC is still roughly 73% below its all-time high of $3,191.
$ZEC surged 47% to $865, a level it hasn't seen since January 2018, according to CoinDesk.
Back in June, the token crashed to $250 after an AI discovered a critical counterfeiting vulnerability that had been live for four years. Since that low, $ZEC has rallied 3.4x.
The rally picked up speed after Grayscale filed to convert its Zcash Trust into what would be the first U.S. spot ZEC ETF, according to The Block.
Even with this surge, $ZEC is still roughly 73% below its all-time high of $3,191.
54
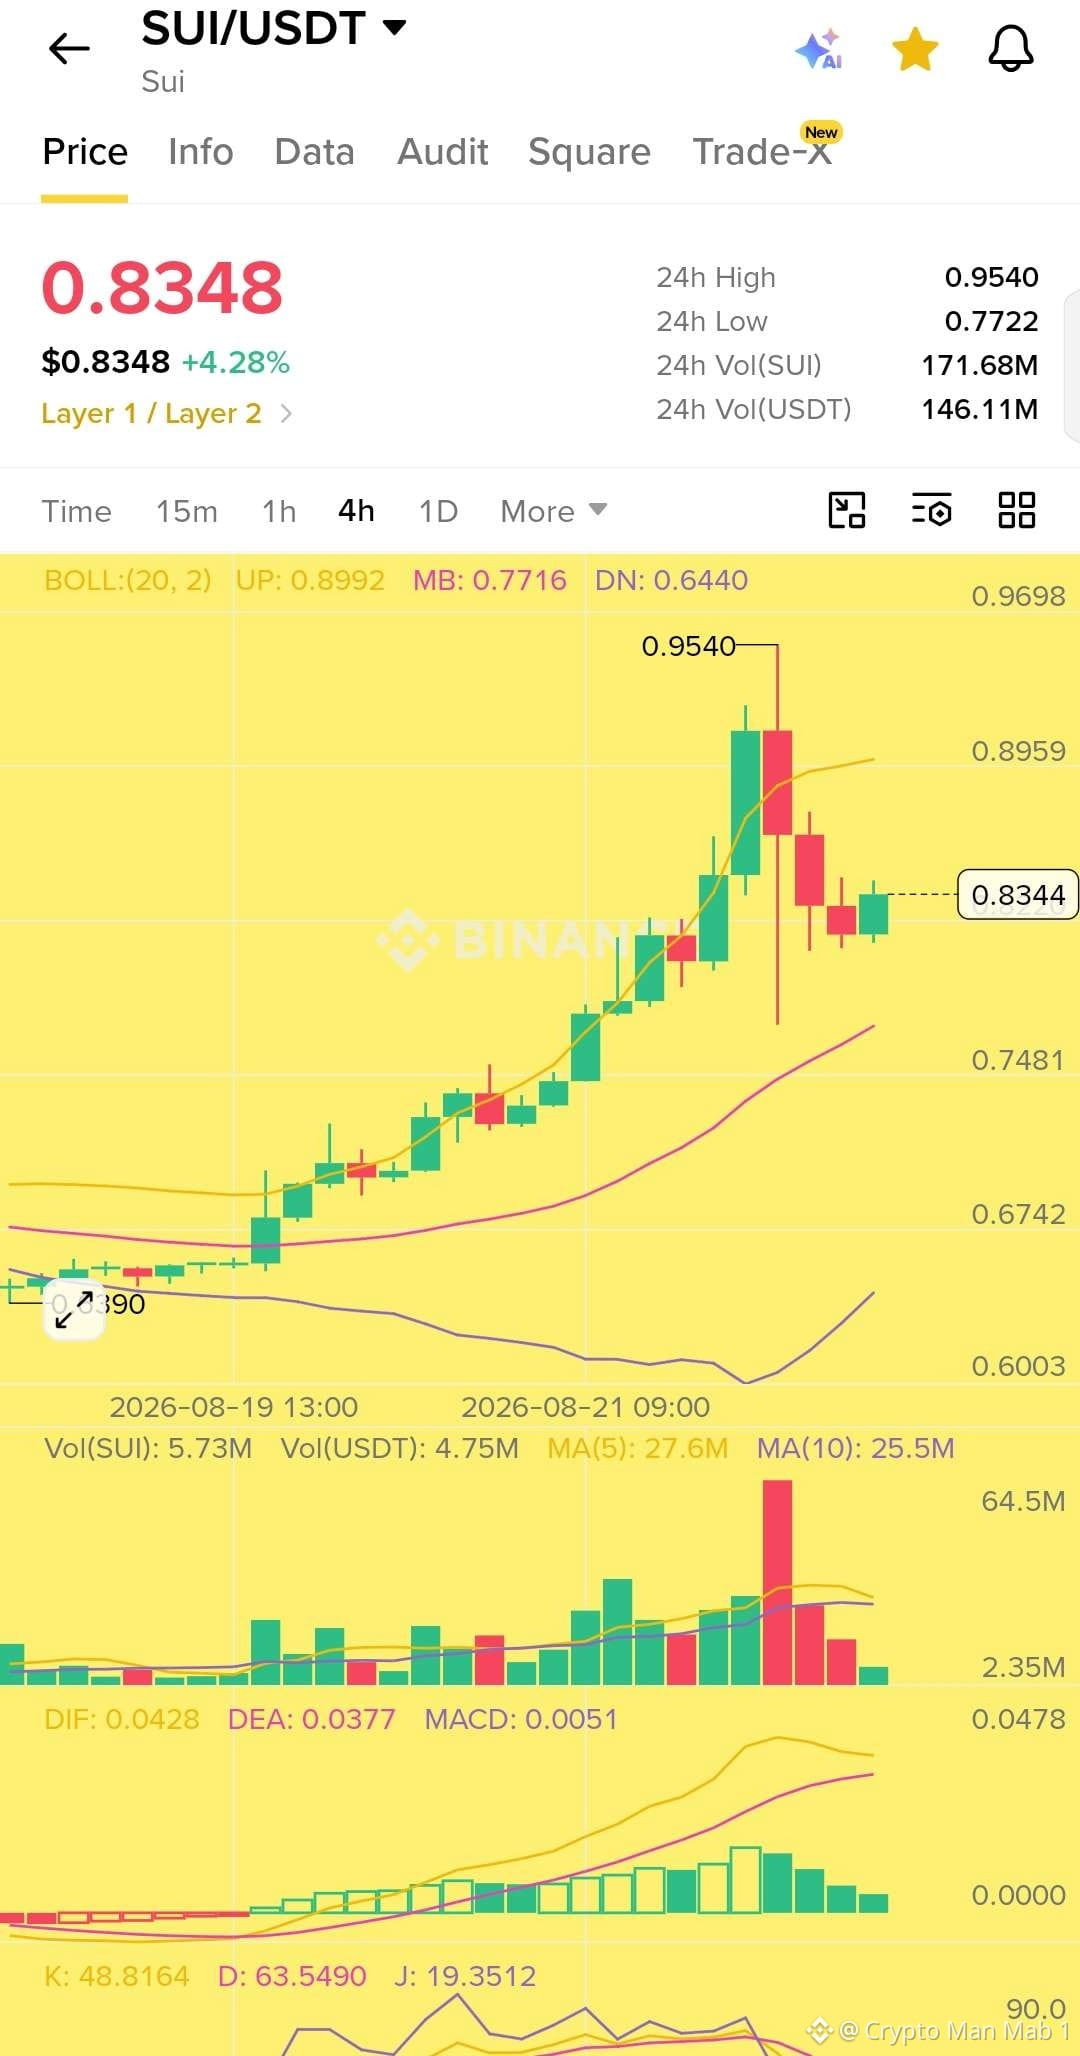
$SUIは現在$0.8348に位置しており、本日+4.28%です。正直かなりワイルドな数日で、この銘柄は$0.60あたりから一気に$0.954まで上がった後、いったん冷めています。
あの上のローソク足は大量の出来高スパイクを伴っていました(チャート全体で最大の棒)ので、通常は利益確定の動きが強くなり始めたことを意味します。それ以来押し戻されていて、現在は$0.77〜$0.83あたりをうろうろしています。
とはいえ、技術的にはまだ上昇トレンドの中です。MACDはプラスを維持していて、価格は重要な移動平均線の上にあります。ただし短期のモメンタム(KDJ)が少し弱まり始めている感じです。なので、これは完全な反転というよりは一息ついている局面に見えますが、$0.77〜$0.80のサポートを維持できるかは要注目です。
※これは投資助言ではなく、チャートの状況を追っているだけです。自己判断でお願いします(DYOR)🙏
$SUIは現在$0.8348に位置しており、本日+4.28%です。正直かなりワイルドな数日で、この銘柄は$0.60あたりから一気に$0.954まで上がった後、いったん冷めています。
あの上のローソク足は大量の出来高スパイクを伴っていました(チャート全体で最大の棒)ので、通常は利益確定の動きが強くなり始めたことを意味します。それ以来押し戻されていて、現在は$0.77〜$0.83あたりをうろうろしています。
とはいえ、技術的にはまだ上昇トレンドの中です。MACDはプラスを維持していて、価格は重要な移動平均線の上にあります。ただし短期のモメンタム(KDJ)が少し弱まり始めている感じです。なので、これは完全な反転というよりは一息ついている局面に見えますが、$0.77〜$0.80のサポートを維持できるかは要注目です。
※これは投資助言ではなく、チャートの状況を追っているだけです。自己判断でお願いします(DYOR)🙏
あの上のローソク足は大量の出来高スパイクを伴っていました(チャート全体で最大の棒)ので、通常は利益確定の動きが強くなり始めたことを意味します。それ以来押し戻されていて、現在は$0.77〜$0.83あたりをうろうろしています。
とはいえ、技術的にはまだ上昇トレンドの中です。MACDはプラスを維持していて、価格は重要な移動平均線の上にあります。ただし短期のモメンタム(KDJ)が少し弱まり始めている感じです。なので、これは完全な反転というよりは一息ついている局面に見えますが、$0.77〜$0.80のサポートを維持できるかは要注目です。
※これは投資助言ではなく、チャートの状況を追っているだけです。自己判断でお願いします(DYOR)🙏
63
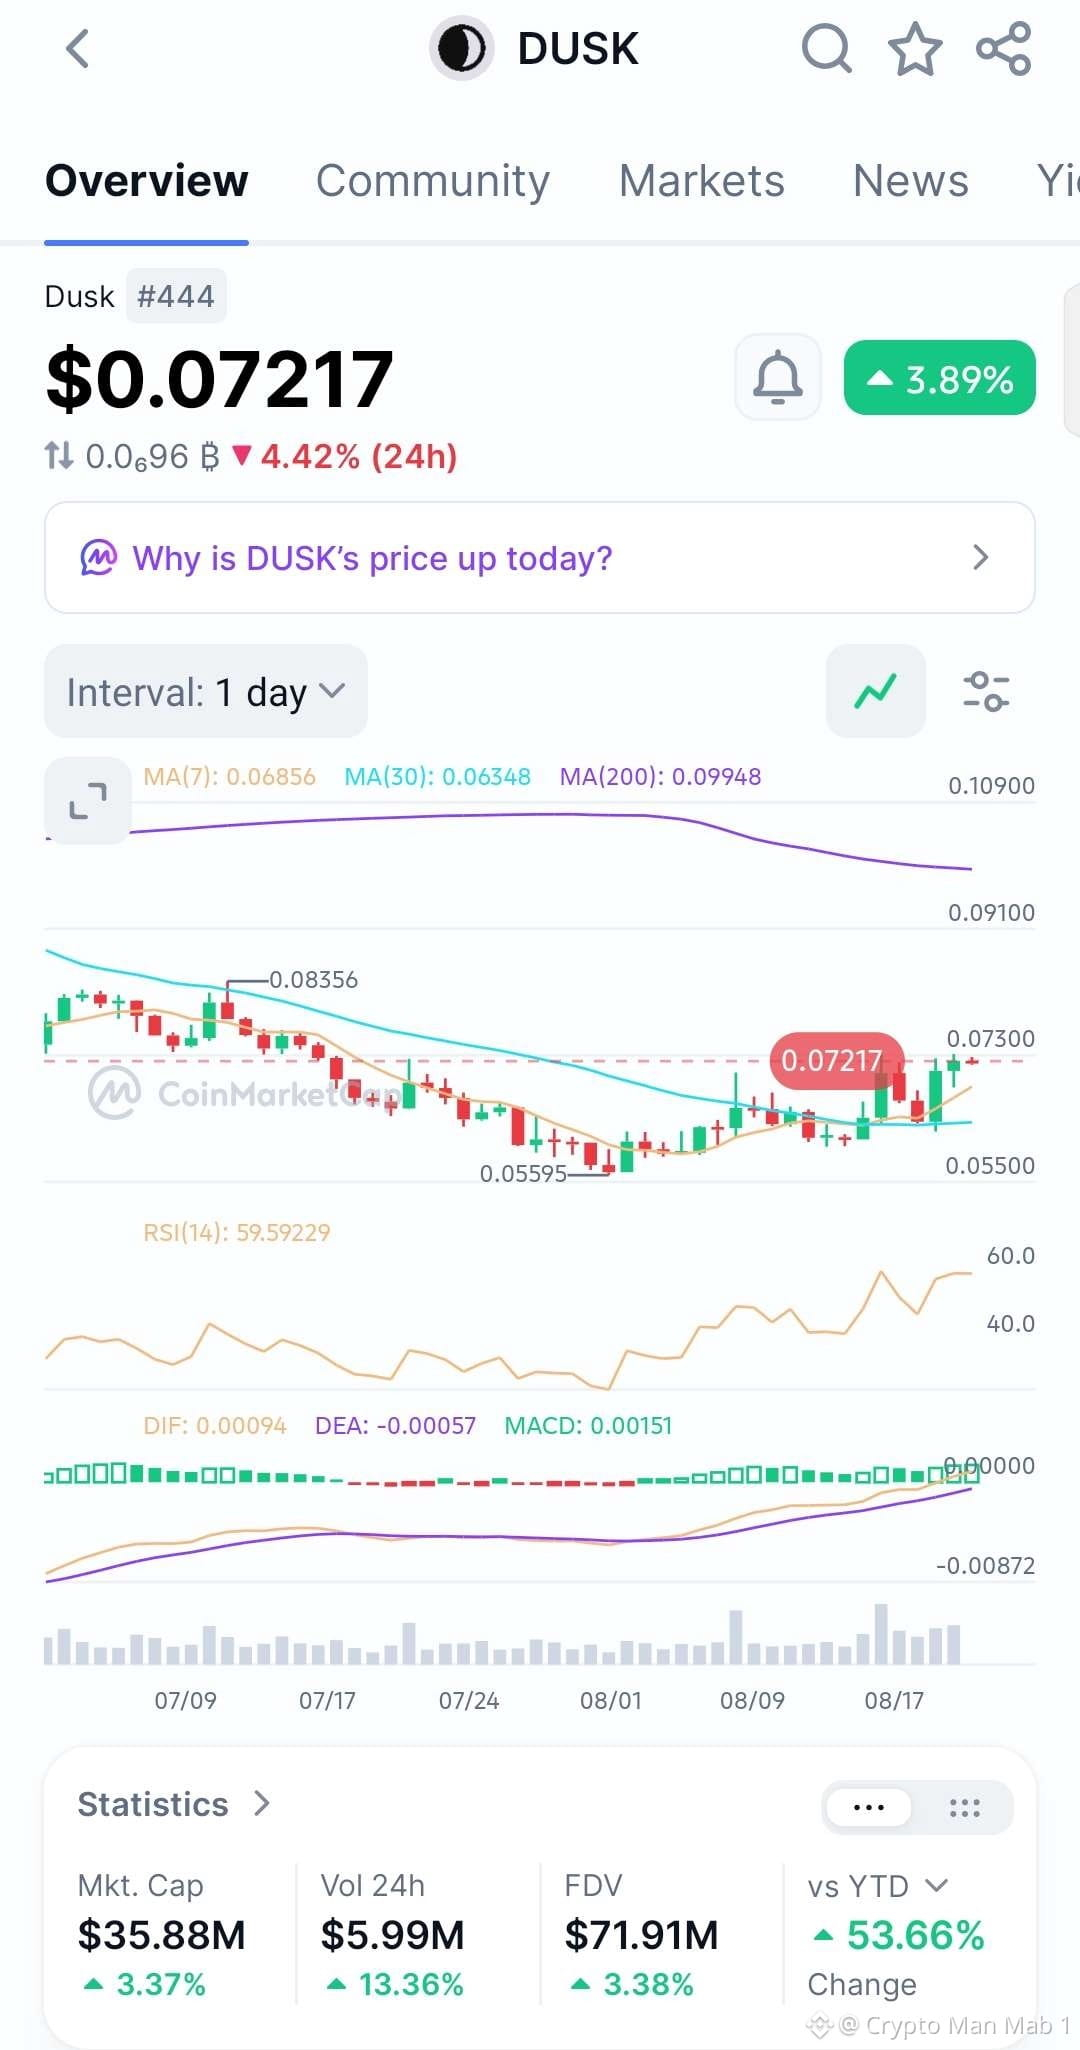
$DUSKは日足チャートで興味深い強さを見せています 👀
価格は$0.07217あたりで推移しており、7日移動平均($0.06856)および30日移動平均($0.06348)を上抜けして押し戻されています。
RSIは60近辺で、強気の勢いが育っていることを示していますが、まだ買われ過ぎ(オーバーボート)のゾーンには入っていません。
MACDもヒストグラムが拡大しながらプラスに転じており、現在のリカバリーを後押ししています。
注目すべき重要な水準は$0.073です。ここを明確にブレイクし、日足でこの水準を上回って終値をつけられれば、$0.0835に向けて道が開け、さらに上も視野に入る可能性があります。
もし$0.0685が失敗するなら、勢いが弱まり、$0.0635前後の下側サポートゾーンでもう一度リテストが見られるかもしれません。
現時点では、$DUSKは強気(ブル)側に向けてトレンドを戻そうとしているように見えます。 👀📈
$DUSKは日足チャートで興味深い強さを見せています 👀
価格は$0.07217あたりで推移しており、7日移動平均($0.06856)および30日移動平均($0.06348)を上抜けして押し戻されています。
RSIは60近辺で、強気の勢いが育っていることを示していますが、まだ買われ過ぎ(オーバーボート)のゾーンには入っていません。
MACDもヒストグラムが拡大しながらプラスに転じており、現在のリカバリーを後押ししています。
注目すべき重要な水準は$0.073です。ここを明確にブレイクし、日足でこの水準を上回って終値をつけられれば、$0.0835に向けて道が開け、さらに上も視野に入る可能性があります。
もし$0.0685が失敗するなら、勢いが弱まり、$0.0635前後の下側サポートゾーンでもう一度リテストが見られるかもしれません。
現時点では、$DUSKは強気(ブル)側に向けてトレンドを戻そうとしているように見えます。 👀📈
価格は$0.07217あたりで推移しており、7日移動平均($0.06856)および30日移動平均($0.06348)を上抜けして押し戻されています。
RSIは60近辺で、強気の勢いが育っていることを示していますが、まだ買われ過ぎ(オーバーボート)のゾーンには入っていません。
MACDもヒストグラムが拡大しながらプラスに転じており、現在のリカバリーを後押ししています。
注目すべき重要な水準は$0.073です。ここを明確にブレイクし、日足でこの水準を上回って終値をつけられれば、$0.0835に向けて道が開け、さらに上も視野に入る可能性があります。
もし$0.0685が失敗するなら、勢いが弱まり、$0.0635前後の下側サポートゾーンでもう一度リテストが見られるかもしれません。
現時点では、$DUSKは強気(ブル)側に向けてトレンドを戻そうとしているように見えます。 👀📈
71
ログインして、さらにコンテンツを読む
厳選トピックで世界の暗号資産トレーダーの仲間入り
⚡️ 暗号資産に関する最新かつ有益な情報が見つかります。
💬 世界最大の暗号資産取引所から信頼されています。
👍 認証を受けたクリエイターから、有益なインサイトを得られます。
メール / 電話番号