
AR _Trader
51.3k 投稿

AR _Trader
報告
ユーザーをブロック
取引を発注
1.4年
29 フォロー
14.0K+ フォロワー
81.1K+ いいね
投稿
ポートフォリオ
すべて
引用
ライブ
PINNED
·
--
ブリッシュ
本人確認中
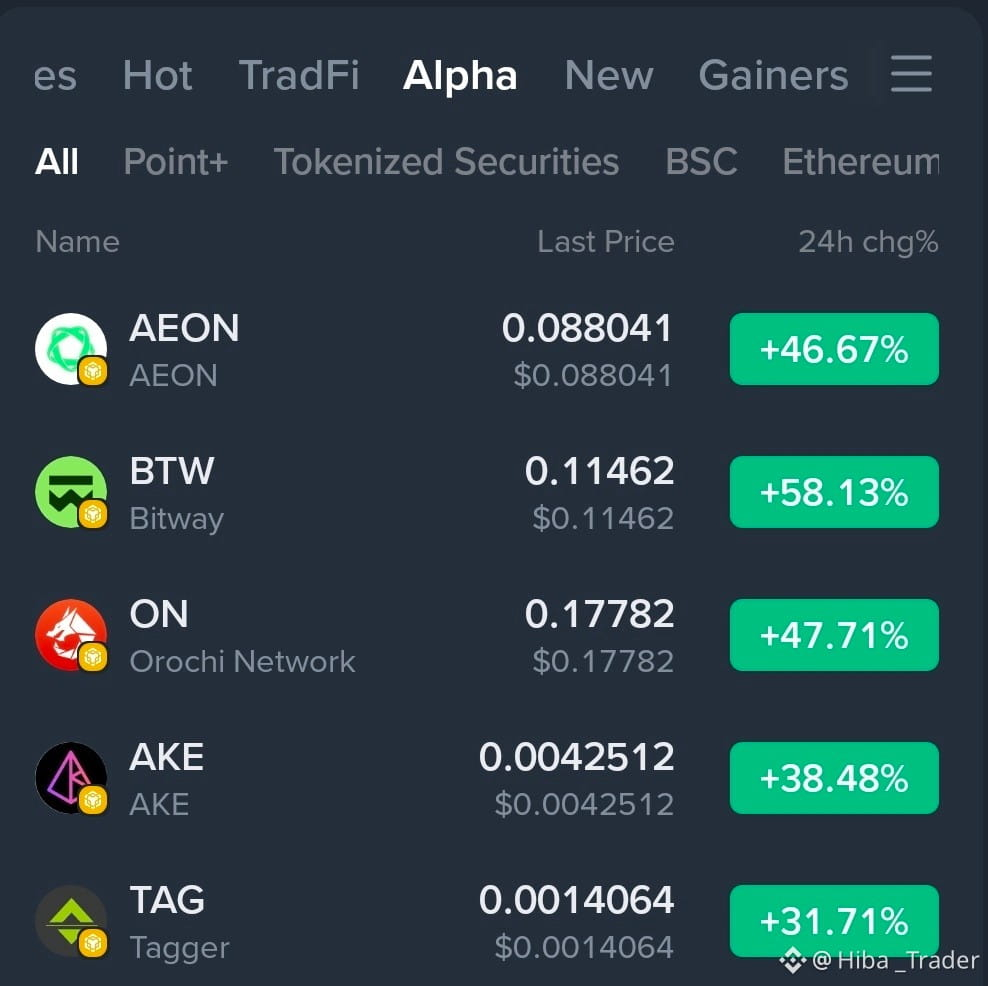
🔥 #usfiresontankerbreakingiranblockade | ホルムズ海峡に関する厳格さへの注意
イラン周辺に設けられた海上封鎖を突破しようとするタンカーを巡り、米軍が発砲したとされる事件についての報道。ホルムズ海峡をめぐる危機の文脈で起きた出来事です。
この一件は、同地域で航行の自由を維持しようとする米国の取り組みに関連する、より広範な軍事的エスカレーションの一部に当たります。
📊 これは何を意味するの?
紛争がどのように展開しても、この種の出来事は通常、市場の不確実性を高めます。
世界の原油の相当割合が通過するルートが脅かされると、投資家は次の点をより注意深く監視し始めます:
• 原油
• ドル
• 金
• 暗号資産(クリプト)
💬 あなたはどう思いますか? これが世界の市場に影響するでしょうか?
🔥 #usfiresontankerbreakingiranblockade | ホルムズ海峡に関する厳格さへの注意
イラン周辺に設けられた海上封鎖を突破しようとするタンカーを巡り、米軍が発砲したとされる事件についての報道。ホルムズ海峡をめぐる危機の文脈で起きた出来事です。
この一件は、同地域で航行の自由を維持しようとする米国の取り組みに関連する、より広範な軍事的エスカレーションの一部に当たります。
📊 これは何を意味するの?
紛争がどのように展開しても、この種の出来事は通常、市場の不確実性を高めます。
世界の原油の相当割合が通過するルートが脅かされると、投資家は次の点をより注意深く監視し始めます:
• 原油
• ドル
• 金
• 暗号資産(クリプト)
💬 あなたはどう思いますか? これが世界の市場に影響するでしょうか?
イラン周辺に設けられた海上封鎖を突破しようとするタンカーを巡り、米軍が発砲したとされる事件についての報道。ホルムズ海峡をめぐる危機の文脈で起きた出来事です。
この一件は、同地域で航行の自由を維持しようとする米国の取り組みに関連する、より広範な軍事的エスカレーションの一部に当たります。
📊 これは何を意味するの?
紛争がどのように展開しても、この種の出来事は通常、市場の不確実性を高めます。
世界の原油の相当割合が通過するルートが脅かされると、投資家は次の点をより注意深く監視し始めます:
• 原油
• ドル
• 金
• 暗号資産(クリプト)
💬 あなたはどう思いますか? これが世界の市場に影響するでしょうか?

2
36
24k
·
--
ブリッシュ
翻訳参照
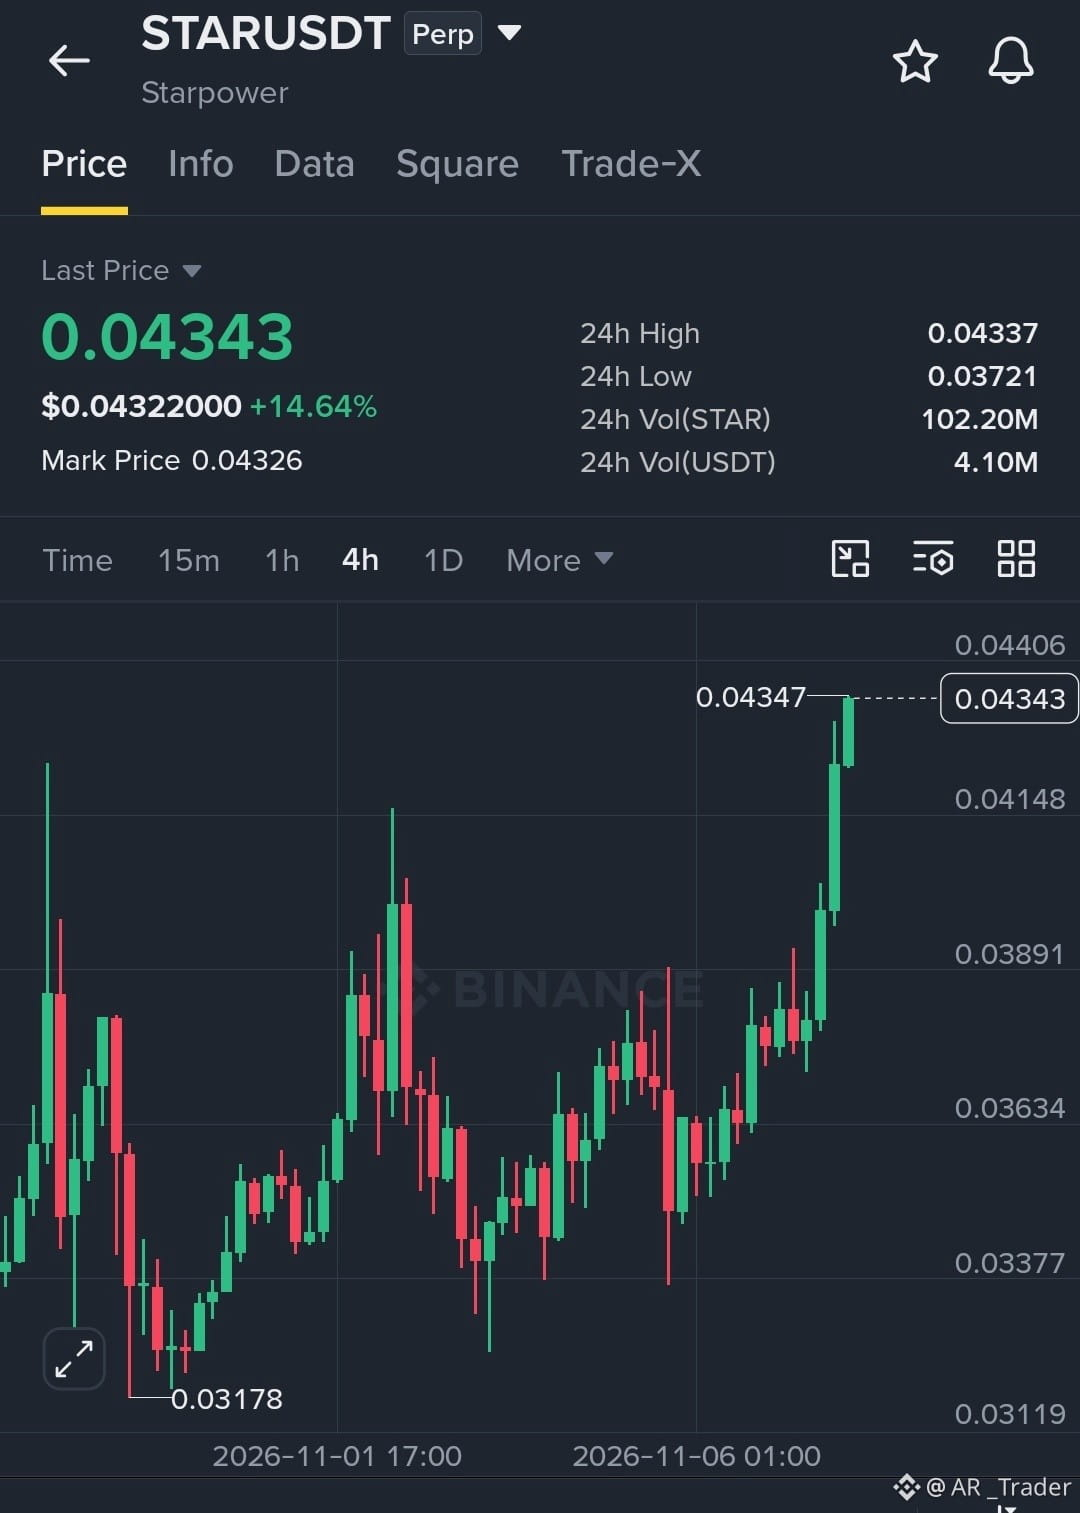
$STAR /USDT – BULLISH BREAKOUT CONFIRMS STRONG BUYER MOMENTUM
Trade Setup: LONG
Entry Zone: 0.04250 – 0.04340
TP1: 0.04450
TP2: 0.04600
TP3: 0.04800
SL: 0.04100
Market Setup:
#STAR is showing strong bullish momentum after breaking above its previous consolidation range. Price is testing resistance near 0.04347. A confirmed breakout could trigger further upside toward higher resistance zones$STAR .
$STAR /USDT – BULLISH BREAKOUT CONFIRMS STRONG BUYER MOMENTUM
Trade Setup: LONG
Entry Zone: 0.04250 – 0.04340
TP1: 0.04450
TP2: 0.04600
TP3: 0.04800
SL: 0.04100
Market Setup:
#STAR is showing strong bullish momentum after breaking above its previous consolidation range. Price is testing resistance near 0.04347. A confirmed breakout could trigger further upside toward higher resistance zones$STAR .
Trade Setup: LONG
Entry Zone: 0.04250 – 0.04340
TP1: 0.04450
TP2: 0.04600
TP3: 0.04800
SL: 0.04100
Market Setup:
#STAR is showing strong bullish momentum after breaking above its previous consolidation range. Price is testing resistance near 0.04347. A confirmed breakout could trigger further upside toward higher resistance zones$STAR .
1
56
·
--
ブリッシュ
翻訳参照
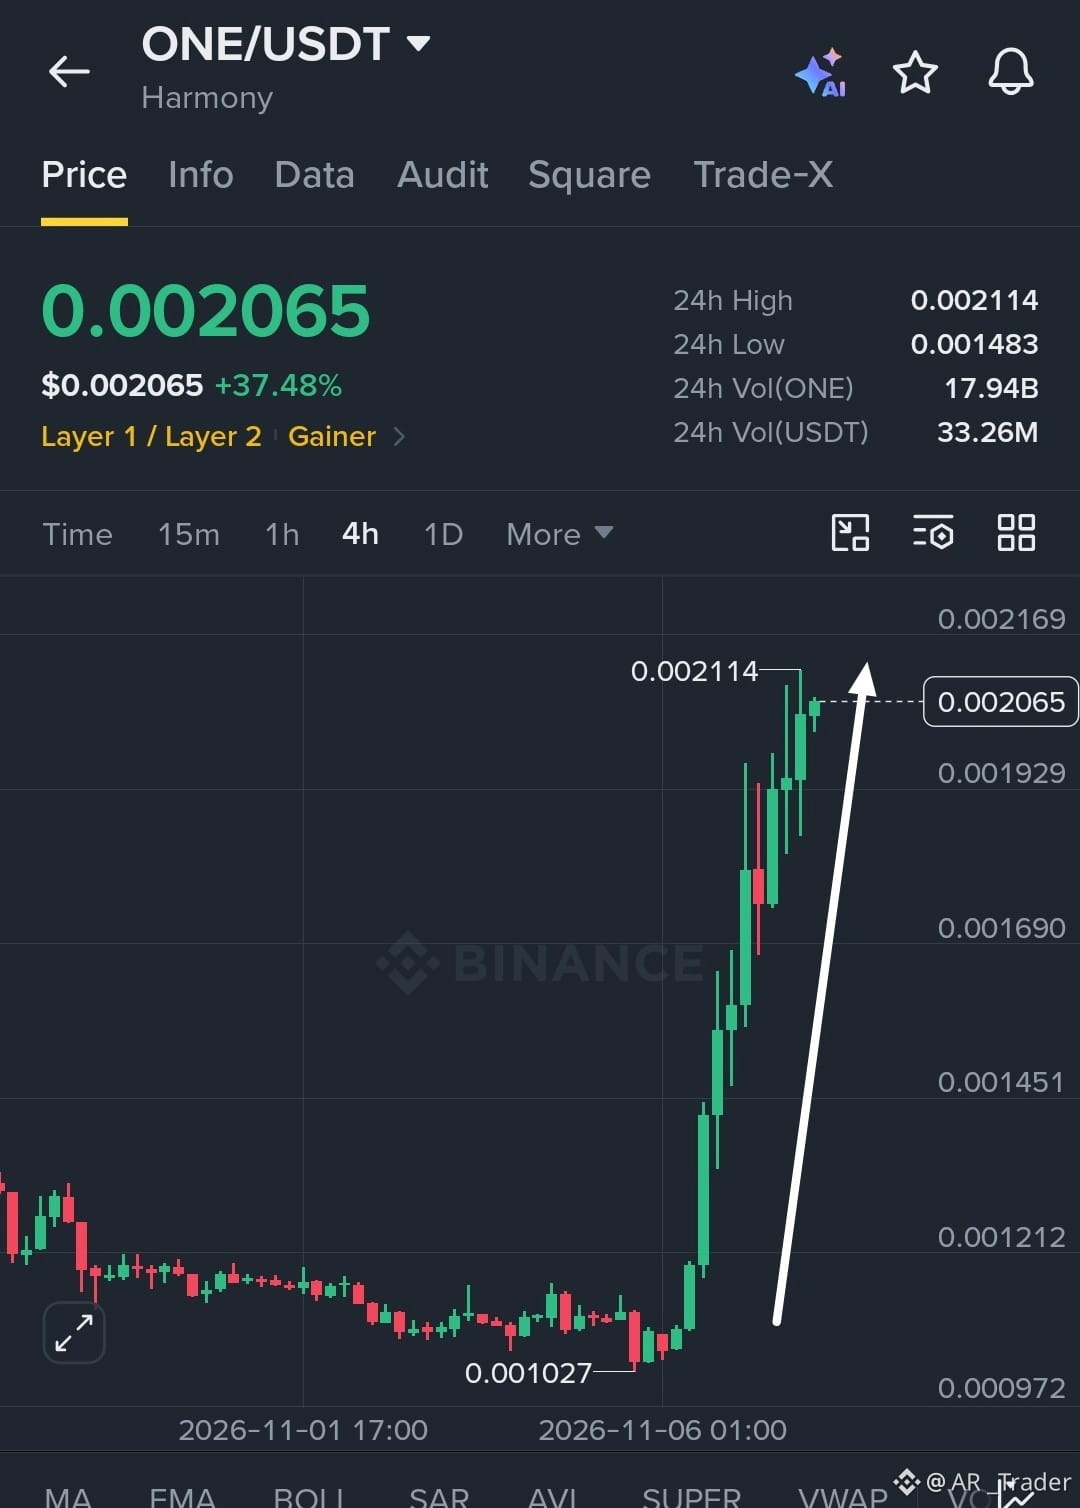
$ONE /USDT – BULLISH BREAKOUT GAINS MOMENTUM AS BUYERS TARGET NEW HIGHS
Trade Setup: LONG
Entry Zone: 0.002000 – 0.002065
TP1: 0.002150
TP2: 0.002250
TP3: 0.002400
SL: 0.001900
Market Setup:
#one is showing strong bullish momentum after a powerful breakout from its previous consolidation zone. Price is holding near 0.002065, with resistance around 0.002114. A confirmed breakout could trigger another upward continuation$ONE
{future}(ONEUSDT)
.
$ONE /USDT – BULLISH BREAKOUT GAINS MOMENTUM AS BUYERS TARGET NEW HIGHS
Trade Setup: LONG
Entry Zone: 0.002000 – 0.002065
TP1: 0.002150
TP2: 0.002250
TP3: 0.002400
SL: 0.001900
Market Setup:
#one is showing strong bullish momentum after a powerful breakout from its previous consolidation zone. Price is holding near 0.002065, with resistance around 0.002114. A confirmed breakout could trigger another upward continuation$ONE
.
Trade Setup: LONG
Entry Zone: 0.002000 – 0.002065
TP1: 0.002150
TP2: 0.002250
TP3: 0.002400
SL: 0.001900
Market Setup:
#one is showing strong bullish momentum after a powerful breakout from its previous consolidation zone. Price is holding near 0.002065, with resistance around 0.002114. A confirmed breakout could trigger another upward continuation$ONE
.
1
61
·
--
ブリッシュ
翻訳参照
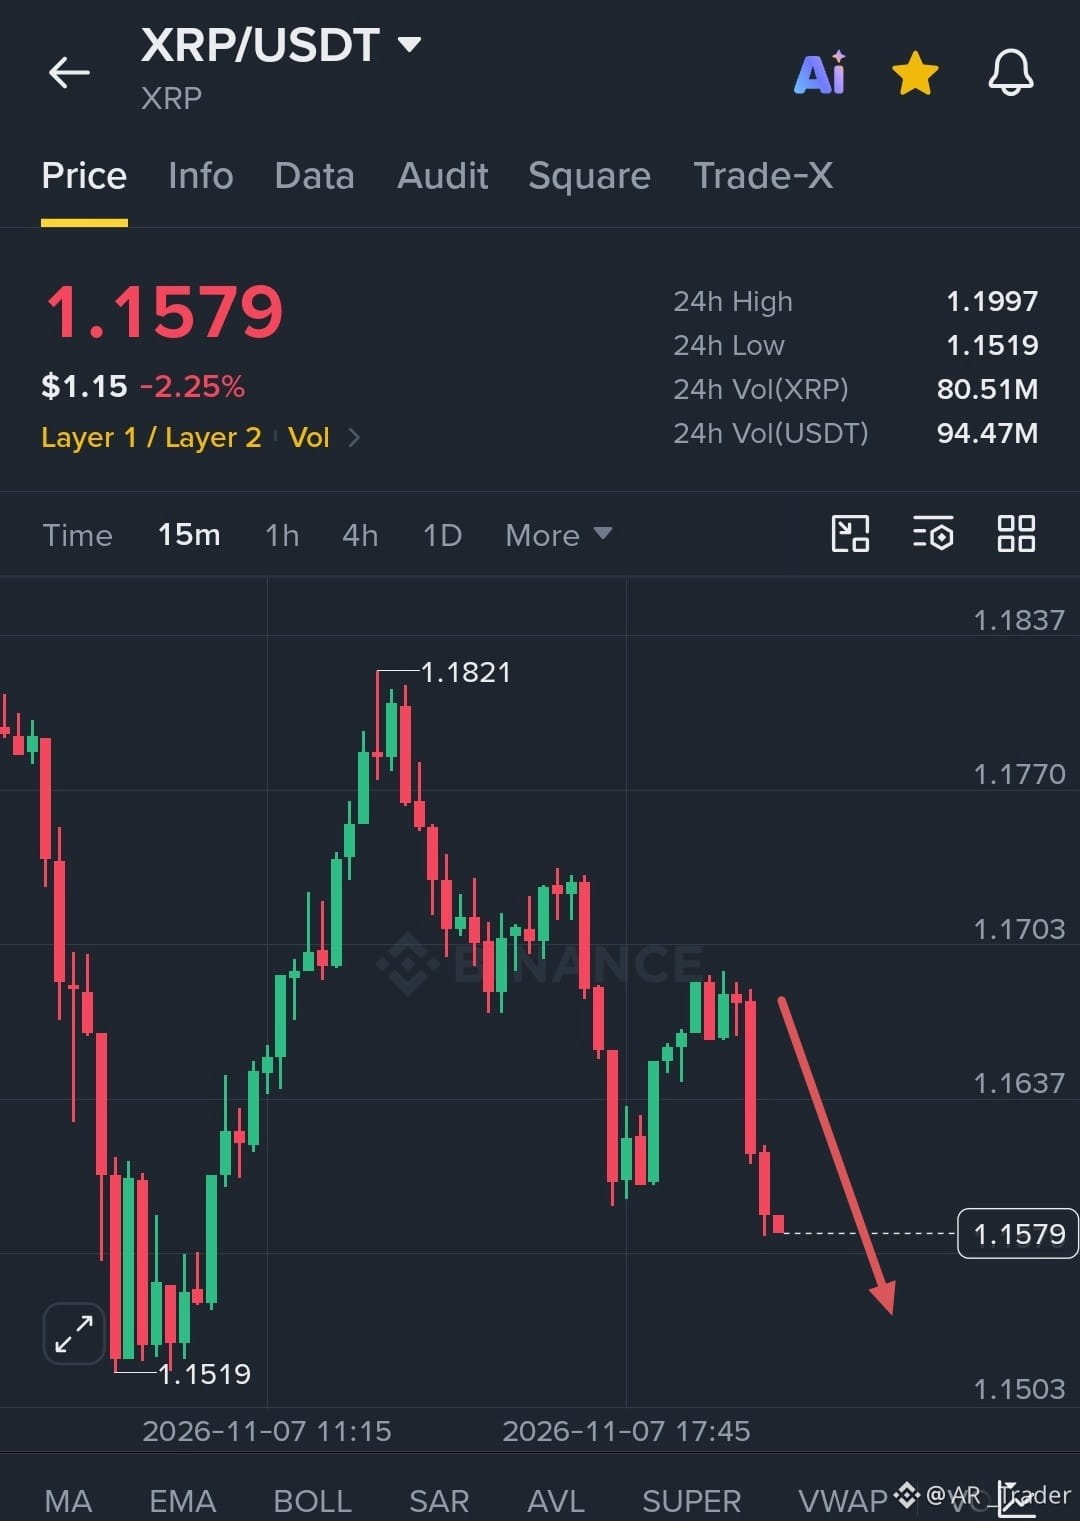
$XRP /USDT – BEARISH BREAKDOWN SIGNALS FURTHER DOWNSIDE PRESSURE
Trade Setup: SHORT
Entry Zone: 1.1570 – 1.1620
TP1: 1.1550
TP2: 1.1519
TP3: 1.1450
SL: 1.1705
Market Setup:
#XRP is showing renewed selling pressure after rejection near 1.1670. The price has broken below short-term support, suggesting further downside toward 1.1519 and potentially lower levels$XRP .
.
$XRP /USDT – BEARISH BREAKDOWN SIGNALS FURTHER DOWNSIDE PRESSURE
Trade Setup: SHORT
Entry Zone: 1.1570 – 1.1620
TP1: 1.1550
TP2: 1.1519
TP3: 1.1450
SL: 1.1705
Market Setup:
#XRP is showing renewed selling pressure after rejection near 1.1670. The price has broken below short-term support, suggesting further downside toward 1.1519 and potentially lower levels$XRP .
.
Trade Setup: SHORT
Entry Zone: 1.1570 – 1.1620
TP1: 1.1550
TP2: 1.1519
TP3: 1.1450
SL: 1.1705
Market Setup:
#XRP is showing renewed selling pressure after rejection near 1.1670. The price has broken below short-term support, suggesting further downside toward 1.1519 and potentially lower levels$XRP .
.
1
48
·
--
ブリッシュ
翻訳参照
$ONE E/USDT – BULLISH MOMENTUM BUILDING AS BUYERS TARGET A NEW BREAKOUT
Trade Setup: LONG
Entry Zone: 0.002000 – 0.002045
TP1: 0.002100
TP2: 0.002180
TP3: 0.002250
SL: 0.001930
Market Setup:
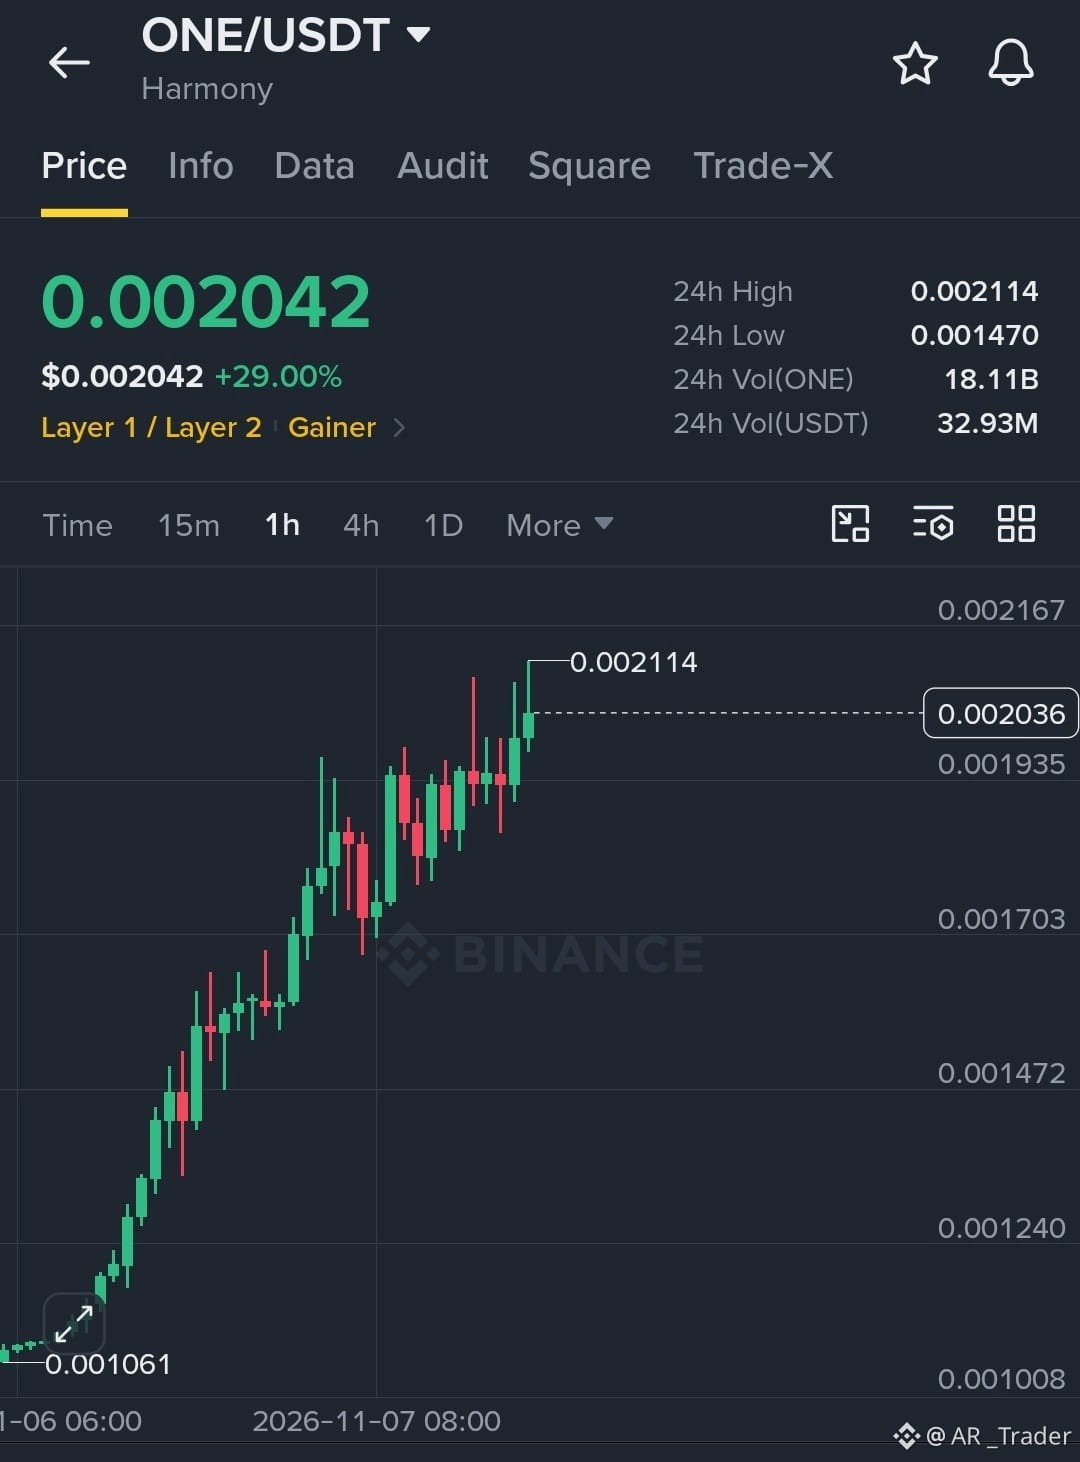
ONE is showing strong bullish momentum on the 1-hour chart, forming higher highs and higher lows after a powerful rally. A confirmed breakout above 0.002114 could trigger another upward move toward the next resistance levels.
Entry Confirmation Trigger: Wait for a 1-hour candle to close above 0.002114, followed by a successful retest of 0.002100–0.002114 as support before entering LONG.
Invalidation: A breakdown below 0.001930 would weaken the bullish structure. Avoid chasing the price before confirmation.
$ONE E/USDT – BULLISH MOMENTUM BUILDING AS BUYERS TARGET A NEW BREAKOUT
Trade Setup: LONG
Entry Zone: 0.002000 – 0.002045
TP1: 0.002100
TP2: 0.002180
TP3: 0.002250
SL: 0.001930
Market Setup:
ONE is showing strong bullish momentum on the 1-hour chart, forming higher highs and higher lows after a powerful rally. A confirmed breakout above 0.002114 could trigger another upward move toward the next resistance levels.
Entry Confirmation Trigger: Wait for a 1-hour candle to close above 0.002114, followed by a successful retest of 0.002100–0.002114 as support before entering LONG.
Invalidation: A breakdown below 0.001930 would weaken the bullish structure. Avoid chasing the price before confirmation.
Trade Setup: LONG
Entry Zone: 0.002000 – 0.002045
TP1: 0.002100
TP2: 0.002180
TP3: 0.002250
SL: 0.001930
Market Setup:
ONE is showing strong bullish momentum on the 1-hour chart, forming higher highs and higher lows after a powerful rally. A confirmed breakout above 0.002114 could trigger another upward move toward the next resistance levels.
Entry Confirmation Trigger: Wait for a 1-hour candle to close above 0.002114, followed by a successful retest of 0.002100–0.002114 as support before entering LONG.
Invalidation: A breakdown below 0.001930 would weaken the bullish structure. Avoid chasing the price before confirmation.
1
60
·
--
ブリッシュ
翻訳参照
$BNB /USDT — BULLISH BREAKOUT SETUP: BNB Buyers Prepare for a Push Toward $699
Trade Setup: LONG
Entry Zone: $696.00 – $696.30
TP1: $697.00
TP2: $698.00
TP3: $699.50
SL: $694.80
Market Setup:
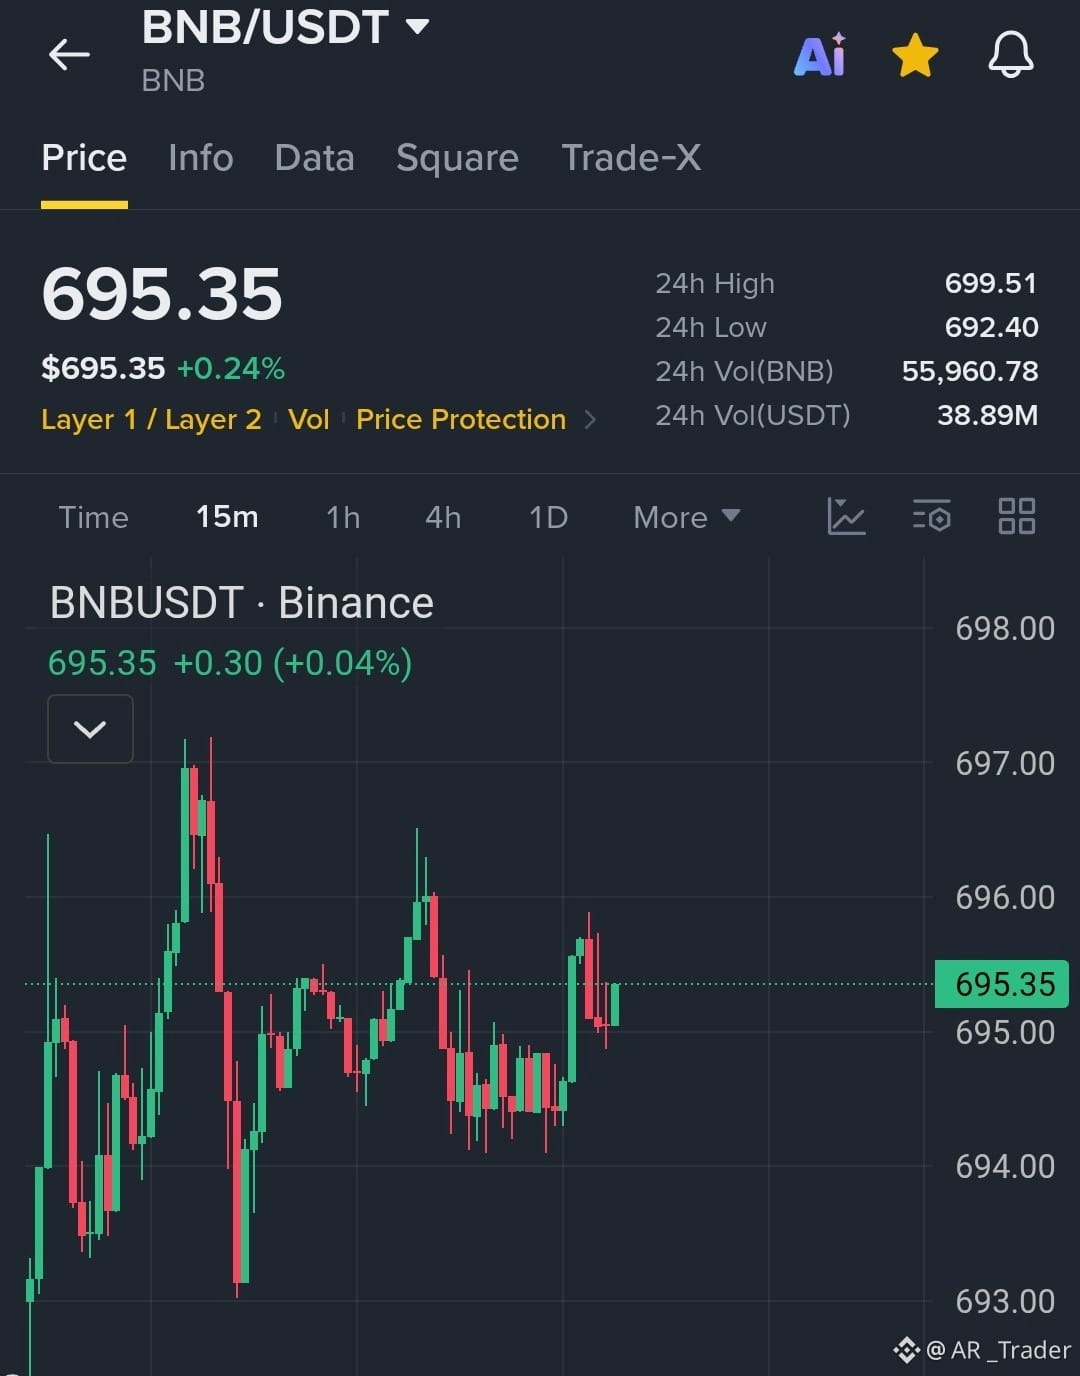
BNB is consolidating on the 15-minute chart, with buyers defending the $694.20–$694.50 support zone. Price is attempting to regain bullish momentum near $695.35. A breakout above $696.00 could open the way toward $697.00, $698.00, and the recent high near $699.50. $BNB
{future}(BNBUSDT)
$BNB /USDT — BULLISH BREAKOUT SETUP: BNB Buyers Prepare for a Push Toward $699
Trade Setup: LONG
Entry Zone: $696.00 – $696.30
TP1: $697.00
TP2: $698.00
TP3: $699.50
SL: $694.80
Market Setup:
BNB is consolidating on the 15-minute chart, with buyers defending the $694.20–$694.50 support zone. Price is attempting to regain bullish momentum near $695.35. A breakout above $696.00 could open the way toward $697.00, $698.00, and the recent high near $699.50. $BNB
Trade Setup: LONG
Entry Zone: $696.00 – $696.30
TP1: $697.00
TP2: $698.00
TP3: $699.50
SL: $694.80
Market Setup:
BNB is consolidating on the 15-minute chart, with buyers defending the $694.20–$694.50 support zone. Price is attempting to regain bullish momentum near $695.35. A breakout above $696.00 could open the way toward $697.00, $698.00, and the recent high near $699.50. $BNB
2
69
·
--
ブリッシュ
翻訳参照
$QNT /USDT Bulls Prepare for Another Recovery Toward $200 Resistance
Trade Setup: LONG
Entry Zone: 197.00–198.00
TP1: 200.00
TP2: 202.00
TP3: 205.00
SL: 195.50
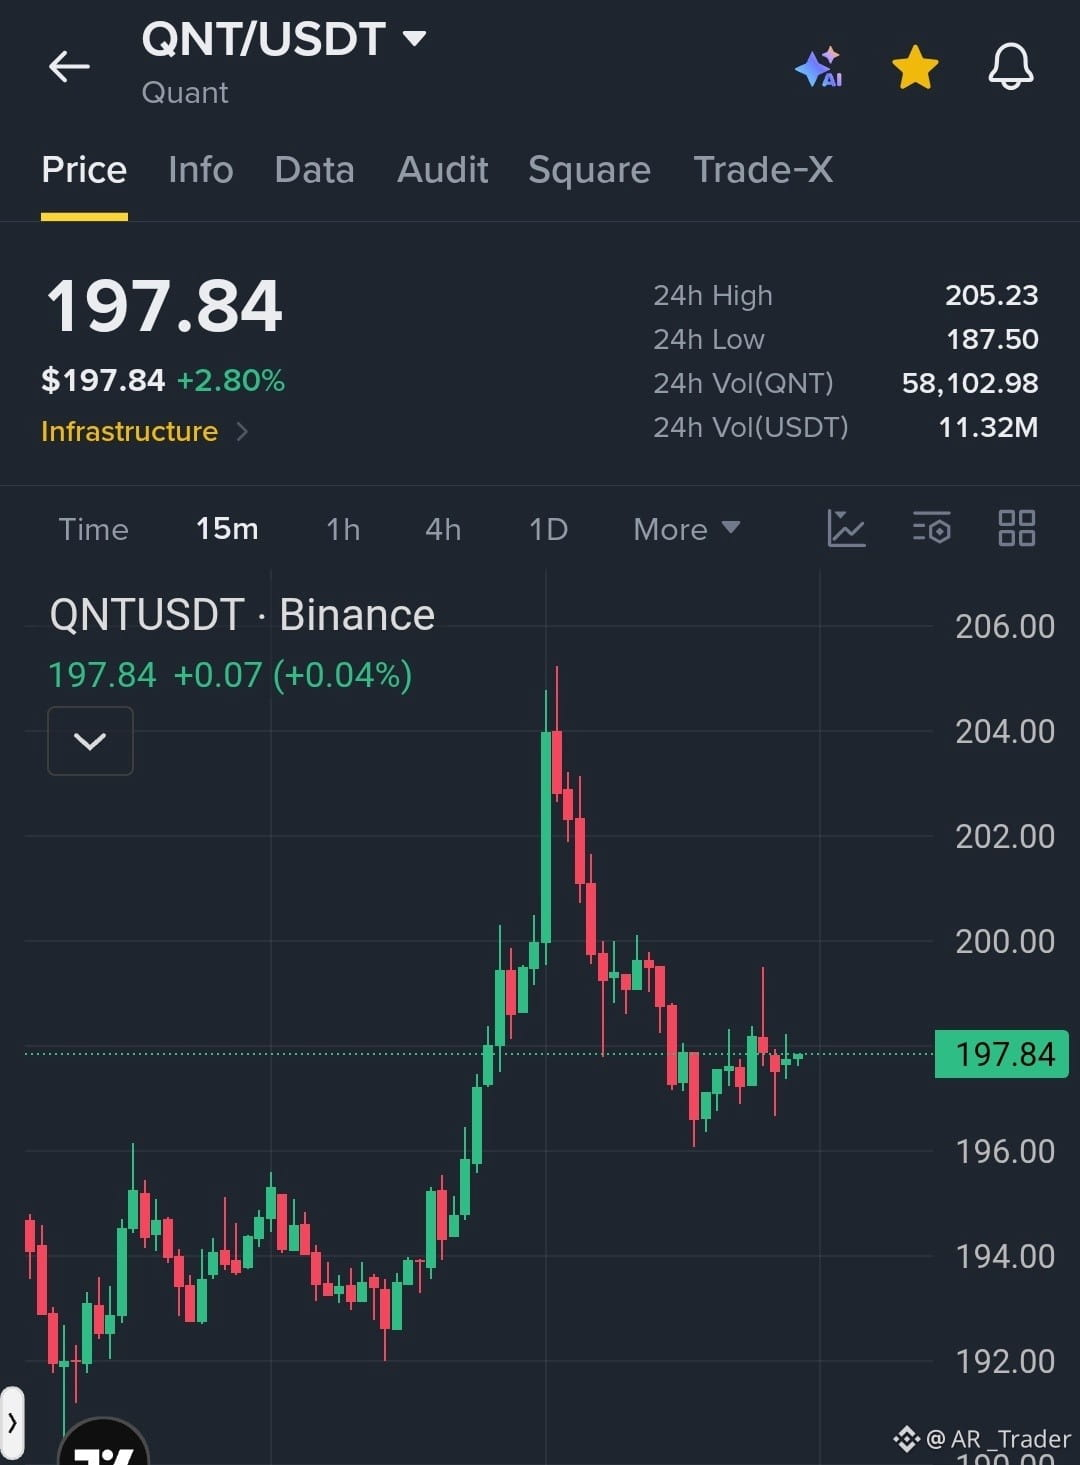
Market Setup: The 15M chart shows a strong rally followed by a healthy pullback and consolidation around $197–$198. Buyers are attempting to regain momentum. A breakout above $200 could open the way toward $202–$205, while losing $196 may weaken the bullish structure.
{spot}(QNTUSDT)
$QNT /USDT Bulls Prepare for Another Recovery Toward $200 Resistance
Trade Setup: LONG
Entry Zone: 197.00–198.00
TP1: 200.00
TP2: 202.00
TP3: 205.00
SL: 195.50
Market Setup: The 15M chart shows a strong rally followed by a healthy pullback and consolidation around $197–$198. Buyers are attempting to regain momentum. A breakout above $200 could open the way toward $202–$205, while losing $196 may weaken the bullish structure.
Trade Setup: LONG
Entry Zone: 197.00–198.00
TP1: 200.00
TP2: 202.00
TP3: 205.00
SL: 195.50
Market Setup: The 15M chart shows a strong rally followed by a healthy pullback and consolidation around $197–$198. Buyers are attempting to regain momentum. A breakout above $200 could open the way toward $202–$205, while losing $196 may weaken the bullish structure.
1
25
·
--
ブリッシュ
翻訳参照
$MET /USDT Bulls Hold Strong After a Sharp Breakout, Targeting Higher Levels
Trade Setup: LONG
Entry Zone: 0.2960–0.2980
TP1: 0.3000
TP2: 0.3030
TP3: 0.3070
SL: 0.2930
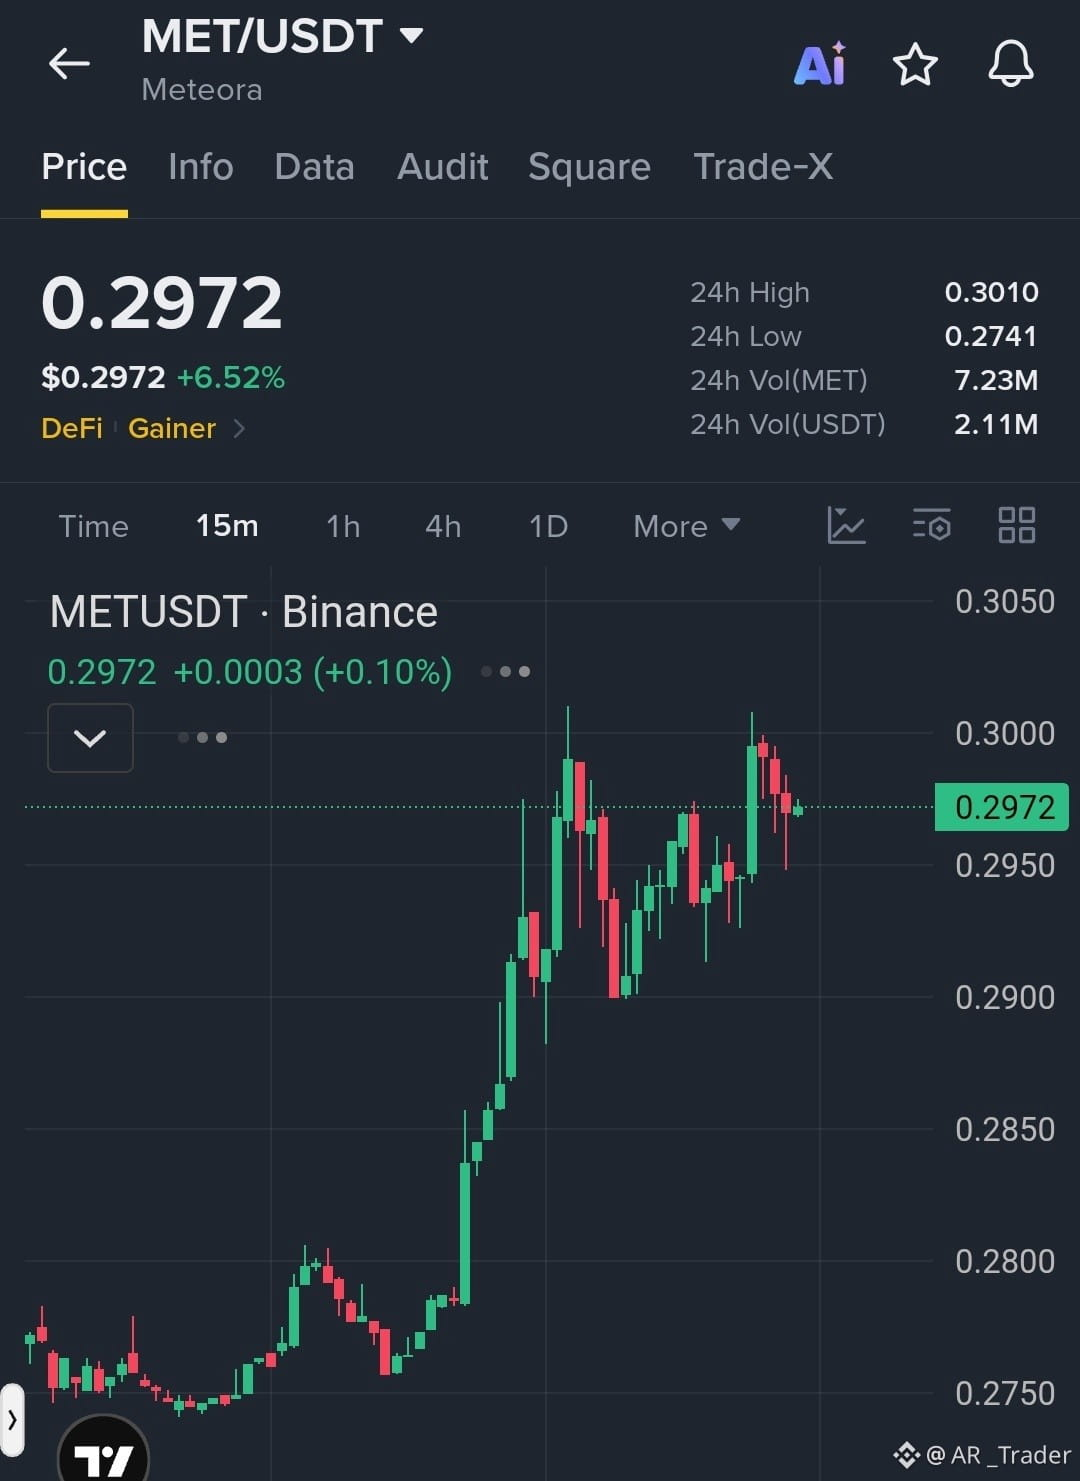
Market Setup: The 15M chart shows a strong bullish breakout from the 0.2750 region, followed by consolidation near 0.2970. Buyers are defending the recent breakout structure. A move above 0.3000 could trigger another upward push, while losing 0.2950 may lead to a pullback.
$MET /USDT Bulls Hold Strong After a Sharp Breakout, Targeting Higher Levels
Trade Setup: LONG
Entry Zone: 0.2960–0.2980
TP1: 0.3000
TP2: 0.3030
TP3: 0.3070
SL: 0.2930
Market Setup: The 15M chart shows a strong bullish breakout from the 0.2750 region, followed by consolidation near 0.2970. Buyers are defending the recent breakout structure. A move above 0.3000 could trigger another upward push, while losing 0.2950 may lead to a pullback.
Trade Setup: LONG
Entry Zone: 0.2960–0.2980
TP1: 0.3000
TP2: 0.3030
TP3: 0.3070
SL: 0.2930
Market Setup: The 15M chart shows a strong bullish breakout from the 0.2750 region, followed by consolidation near 0.2970. Buyers are defending the recent breakout structure. A move above 0.3000 could trigger another upward push, while losing 0.2950 may lead to a pullback.
2
53
·
--
ブリッシュ
翻訳参照
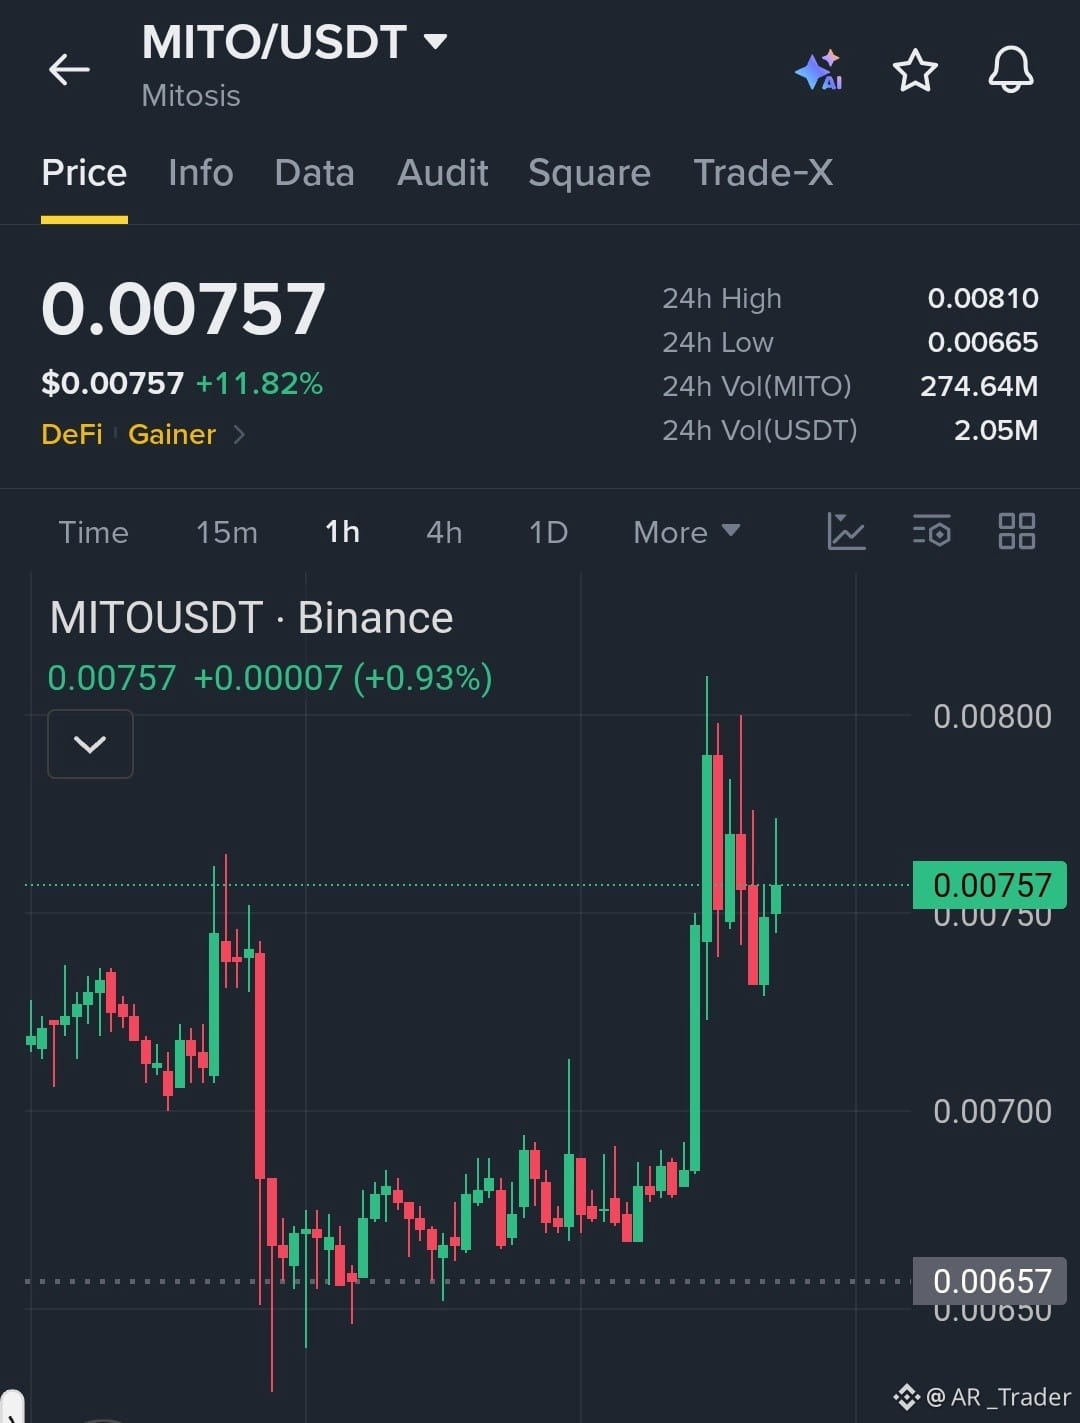
$MITO /USDT Bulls Maintain Breakout Momentum as Buyers Target Higher Levels
Trade Setup: LONG
Entry Zone: 0.00750–0.00760
TP1: 0.00780
TP2: 0.00800
TP3: 0.00830
SL: 0.00730
Market Setup: The 1H chart shows a strong bullish breakout from the 0.00660 consolidation zone. Buyers are defending the 0.00750 area after a sharp rally. Holding this level could support another push toward 0.00800–0.00830, while losing support may trigger a deeper pullback.
{spot}(MITOUSDT)
$MITO /USDT Bulls Maintain Breakout Momentum as Buyers Target Higher Levels
Trade Setup: LONG
Entry Zone: 0.00750–0.00760
TP1: 0.00780
TP2: 0.00800
TP3: 0.00830
SL: 0.00730
Market Setup: The 1H chart shows a strong bullish breakout from the 0.00660 consolidation zone. Buyers are defending the 0.00750 area after a sharp rally. Holding this level could support another push toward 0.00800–0.00830, while losing support may trigger a deeper pullback.
Trade Setup: LONG
Entry Zone: 0.00750–0.00760
TP1: 0.00780
TP2: 0.00800
TP3: 0.00830
SL: 0.00730
Market Setup: The 1H chart shows a strong bullish breakout from the 0.00660 consolidation zone. Buyers are defending the 0.00750 area after a sharp rally. Holding this level could support another push toward 0.00800–0.00830, while losing support may trigger a deeper pullback.
1
42
·
--
ブリッシュ
翻訳参照
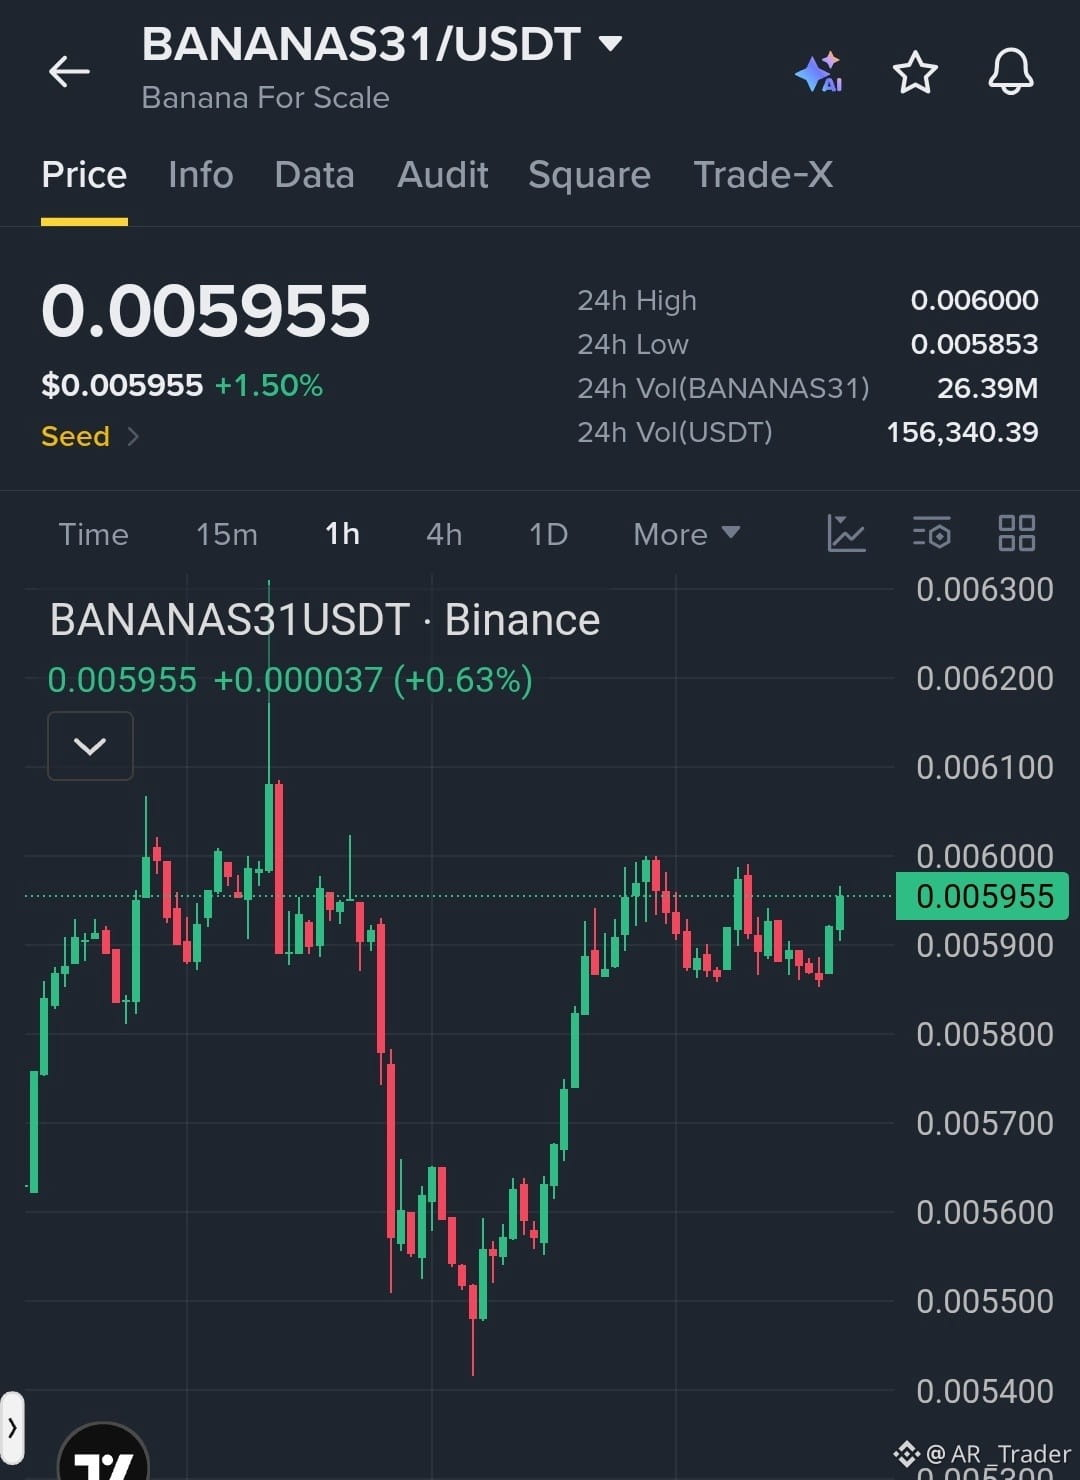
$BANANAS31 /USDT Bulls Challenge Resistance as Recovery Momentum Builds
Trade Setup: LONG
Entry Zone: 0.005920–0.005960
TP1: 0.006000
TP2: 0.006080
TP3: 0.006180
SL: 0.005850
Market Setup: The 1H chart shows a strong recovery from the 0.005450 support zone, with buyers gradually regaining control. Price is approaching resistance near 0.006000. A confirmed breakout could trigger further upside, while rejection may lead to another support retest.
{spot}(BANANAS31USDT)
$BANANAS31 /USDT Bulls Challenge Resistance as Recovery Momentum Builds
Trade Setup: LONG
Entry Zone: 0.005920–0.005960
TP1: 0.006000
TP2: 0.006080
TP3: 0.006180
SL: 0.005850
Market Setup: The 1H chart shows a strong recovery from the 0.005450 support zone, with buyers gradually regaining control. Price is approaching resistance near 0.006000. A confirmed breakout could trigger further upside, while rejection may lead to another support retest.
Trade Setup: LONG
Entry Zone: 0.005920–0.005960
TP1: 0.006000
TP2: 0.006080
TP3: 0.006180
SL: 0.005850
Market Setup: The 1H chart shows a strong recovery from the 0.005450 support zone, with buyers gradually regaining control. Price is approaching resistance near 0.006000. A confirmed breakout could trigger further upside, while rejection may lead to another support retest.
1
24
·
--
翻訳参照
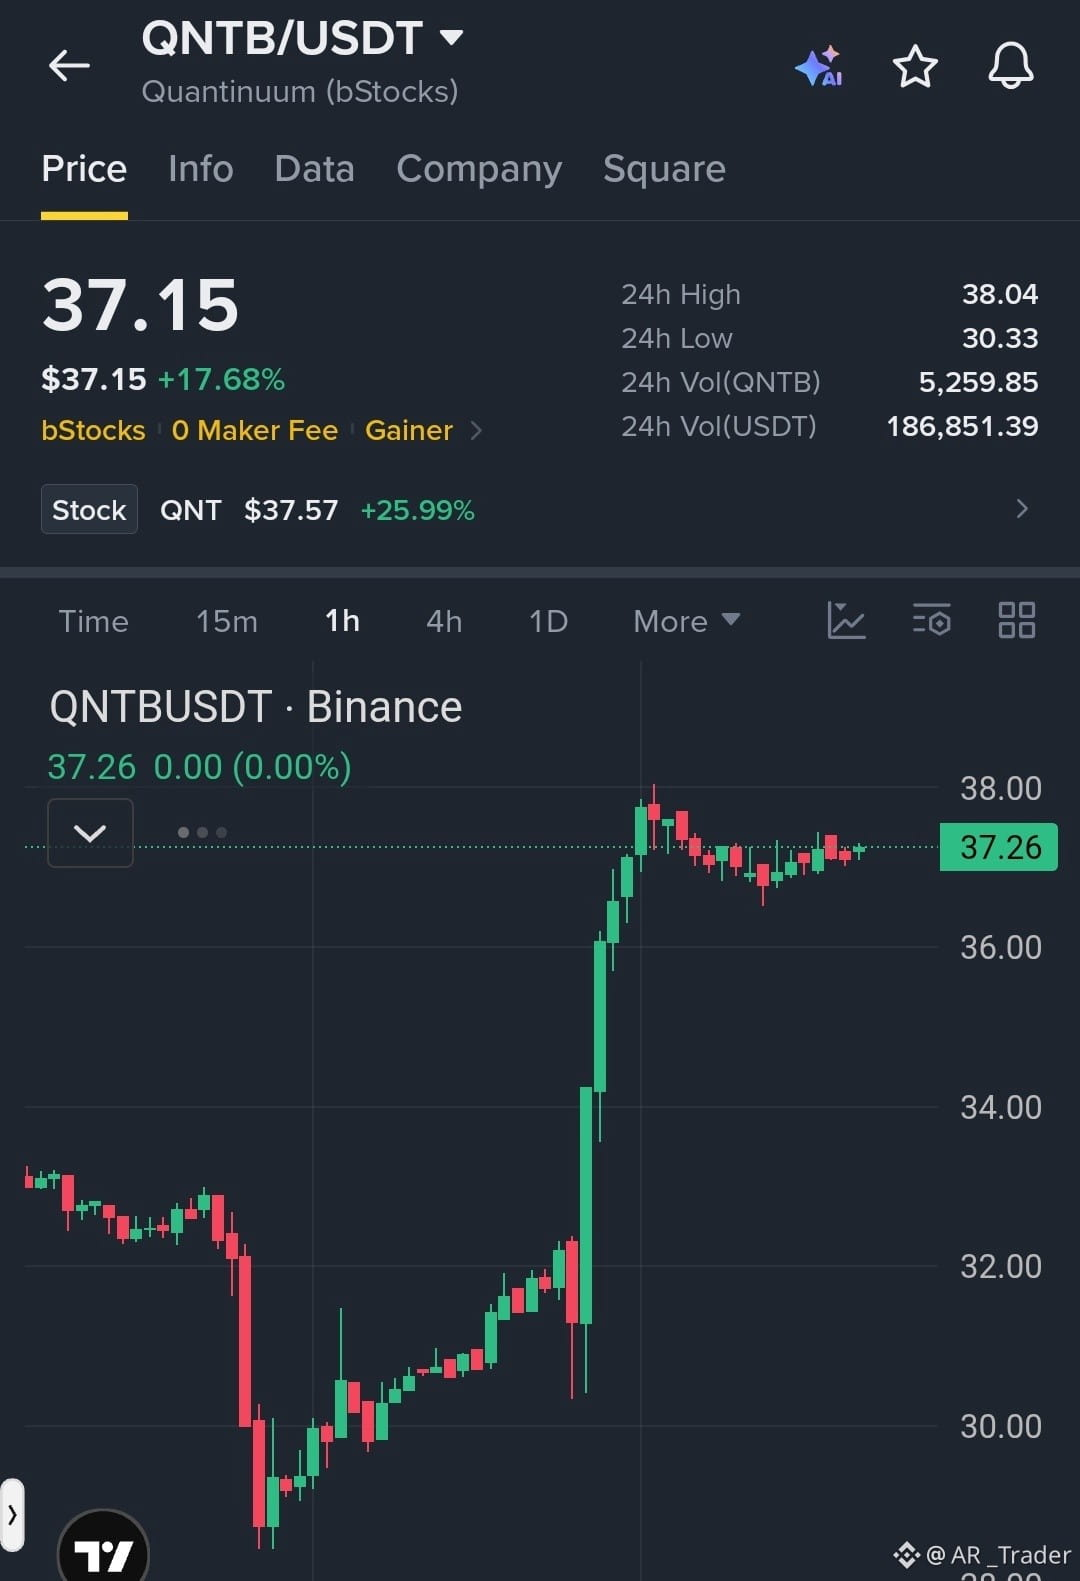
**$QNTB /USDT Bulls Hold Above Breakout Zone as Momentum Builds**
**Trade Setup: LONG**
**Entry Zone:** 37.00–37.30
**TP1:** 38.00
**TP2:** 39.00
**TP3:** 40.00
**SL:** 36.20
**Market Setup:** The 1H chart shows a powerful bullish breakout from the $30–$32 region, followed by consolidation near $37. Price is holding above the breakout zone, suggesting buyers remain in control. A move above $38 could trigger another upward push toward $40.
$QNT
{future}(QNTUSDT)
**$QNTB /USDT Bulls Hold Above Breakout Zone as Momentum Builds**
**Trade Setup: LONG**
**Entry Zone:** 37.00–37.30
**TP1:** 38.00
**TP2:** 39.00
**TP3:** 40.00
**SL:** 36.20
**Market Setup:** The 1H chart shows a powerful bullish breakout from the $30–$32 region, followed by consolidation near $37. Price is holding above the breakout zone, suggesting buyers remain in control. A move above $38 could trigger another upward push toward $40.
$QNT
**Trade Setup: LONG**
**Entry Zone:** 37.00–37.30
**TP1:** 38.00
**TP2:** 39.00
**TP3:** 40.00
**SL:** 36.20
**Market Setup:** The 1H chart shows a powerful bullish breakout from the $30–$32 region, followed by consolidation near $37. Price is holding above the breakout zone, suggesting buyers remain in control. A move above $38 could trigger another upward push toward $40.
$QNT
1
15
·
--
ブリッシュ
翻訳参照
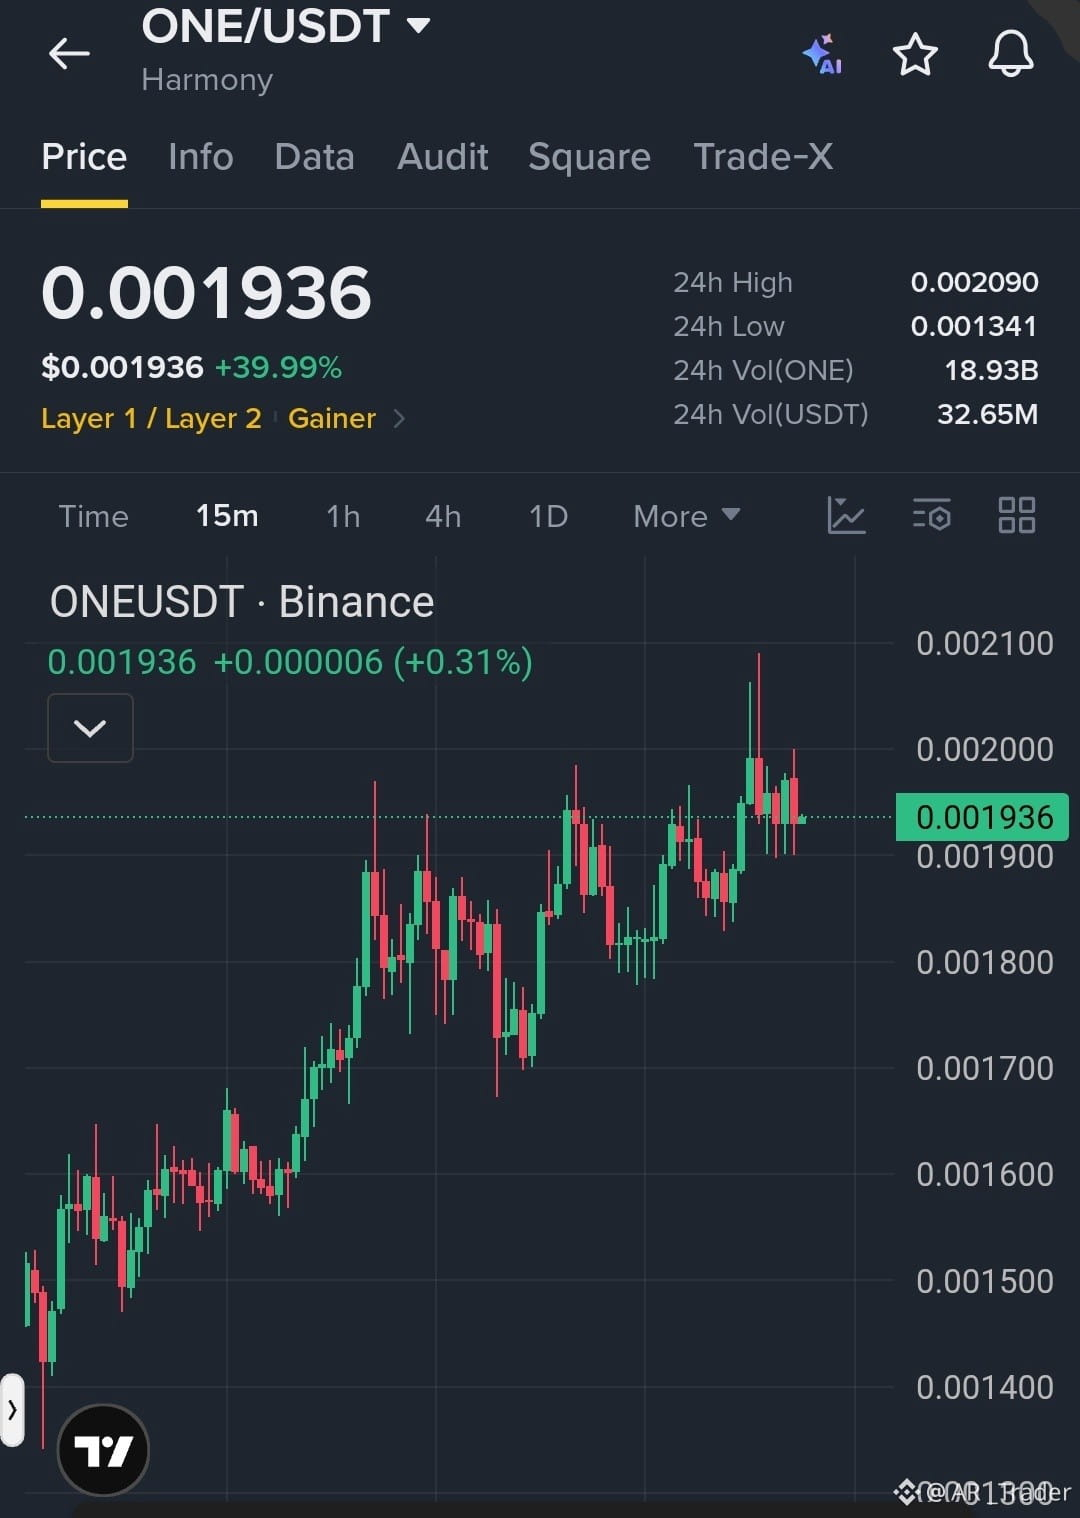
**$ONE /USDT Bulls Hold Strong Momentum as Price Consolidates Near Resistance**
**Trade Setup: LONG**
**Entry Zone:** 0.001910–0.001940
**TP1:** 0.001980
**TP2:** 0.002050
**TP3:** 0.002120
**SL:** 0.001860
**Market Setup:** The 15M chart shows a strong bullish structure with higher highs and higher lows. Price is consolidating near 0.001940 after a sharp rally. A breakout above 0.002000 could trigger another upward move, while losing 0.001900 may weaken momentum.
**$ONE /USDT Bulls Hold Strong Momentum as Price Consolidates Near Resistance**
**Trade Setup: LONG**
**Entry Zone:** 0.001910–0.001940
**TP1:** 0.001980
**TP2:** 0.002050
**TP3:** 0.002120
**SL:** 0.001860
**Market Setup:** The 15M chart shows a strong bullish structure with higher highs and higher lows. Price is consolidating near 0.001940 after a sharp rally. A breakout above 0.002000 could trigger another upward move, while losing 0.001900 may weaken momentum.
**Trade Setup: LONG**
**Entry Zone:** 0.001910–0.001940
**TP1:** 0.001980
**TP2:** 0.002050
**TP3:** 0.002120
**SL:** 0.001860
**Market Setup:** The 15M chart shows a strong bullish structure with higher highs and higher lows. Price is consolidating near 0.001940 after a sharp rally. A breakout above 0.002000 could trigger another upward move, while losing 0.001900 may weaken momentum.
1
17
·
--
ブリッシュ
翻訳参照
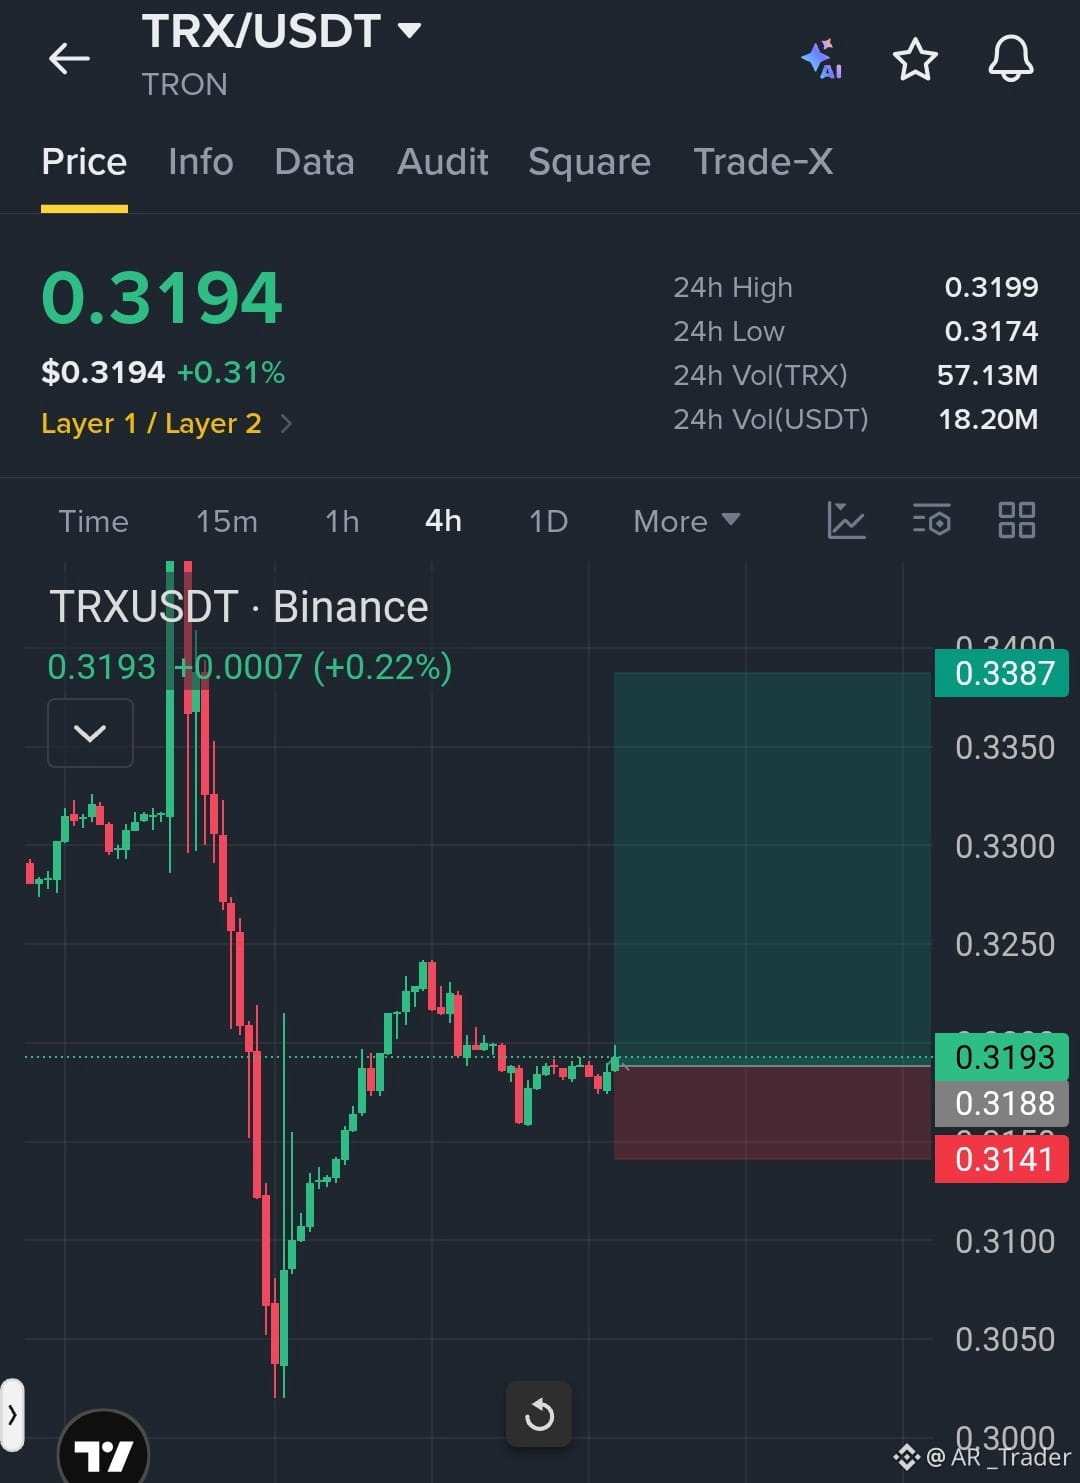
$TRX /USDT Bulls Prepare for a Recovery Toward the $0.3380 Resistance Zone
Trade Setup: LONG
Entry Zone: 0.3180–0.3200
TP1: 0.3250
TP2: 0.3320
TP3: 0.3380
SL: 0.3140
Market Setup: The 4H chart shows a recovery from the $0.3030 support area, followed by consolidation around $0.3190. Holding above $0.3180 could support another bullish move toward higher resistance. A breakdown below $0.3140 would invalidate the setup$TRX
{future}(TRXUSDT)
.
$TRX /USDT Bulls Prepare for a Recovery Toward the $0.3380 Resistance Zone
Trade Setup: LONG
Entry Zone: 0.3180–0.3200
TP1: 0.3250
TP2: 0.3320
TP3: 0.3380
SL: 0.3140
Market Setup: The 4H chart shows a recovery from the $0.3030 support area, followed by consolidation around $0.3190. Holding above $0.3180 could support another bullish move toward higher resistance. A breakdown below $0.3140 would invalidate the setup$TRX
.
Trade Setup: LONG
Entry Zone: 0.3180–0.3200
TP1: 0.3250
TP2: 0.3320
TP3: 0.3380
SL: 0.3140
Market Setup: The 4H chart shows a recovery from the $0.3030 support area, followed by consolidation around $0.3190. Holding above $0.3180 could support another bullish move toward higher resistance. A breakdown below $0.3140 would invalidate the setup$TRX
.
1
33
·
--
ブリッシュ
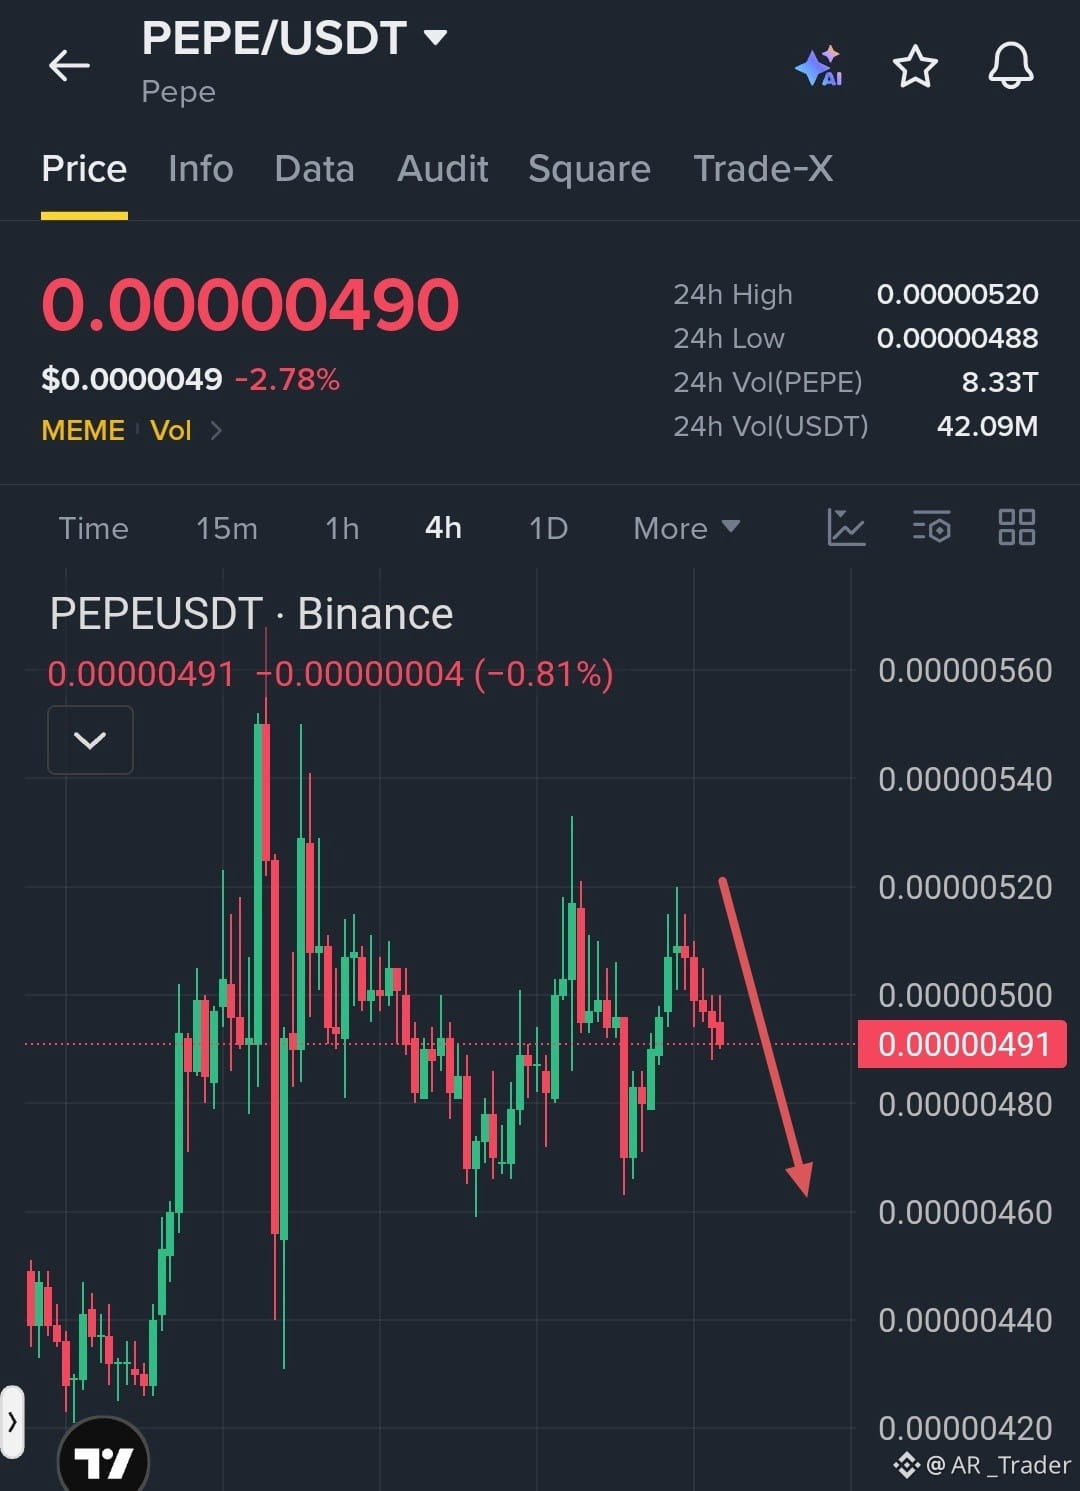
$PEPE /USDT:売り圧力が強まる中、弱気派は下方ブレイクを狙う
取引戦略:ショート
エントリーゾーン:0.00000490–0.00000495
利確1:0.00000480
利確2:0.00000470
利確3:0.00000460
損切り:0.00000510
相場状況:4時間足チャートでは、0.00000515付近で上値を拒まれた後、モメンタムの弱まりが見られます。高値の切り下げと売り圧力の増加は、さらなる下落の可能性を示唆しています。0.00000480を下抜けると、より低いサポート水準に向けて下落が加速する可能性があります。レジスタンスを上抜けて回復すれば、弱気シナリオは無効となる可能性があります$PEPE
{spot}(PEPEUSDT)
$PENGU
{future}(PENGUUSDT)
.
$PEPE /USDT:売り圧力が強まる中、弱気派は下方ブレイクを狙う
取引戦略:ショート
エントリーゾーン:0.00000490–0.00000495
利確1:0.00000480
利確2:0.00000470
利確3:0.00000460
損切り:0.00000510
相場状況:4時間足チャートでは、0.00000515付近で上値を拒まれた後、モメンタムの弱まりが見られます。高値の切り下げと売り圧力の増加は、さらなる下落の可能性を示唆しています。0.00000480を下抜けると、より低いサポート水準に向けて下落が加速する可能性があります。レジスタンスを上抜けて回復すれば、弱気シナリオは無効となる可能性があります$PEPE
$PENGU
.
取引戦略:ショート
エントリーゾーン:0.00000490–0.00000495
利確1:0.00000480
利確2:0.00000470
利確3:0.00000460
損切り:0.00000510
相場状況:4時間足チャートでは、0.00000515付近で上値を拒まれた後、モメンタムの弱まりが見られます。高値の切り下げと売り圧力の増加は、さらなる下落の可能性を示唆しています。0.00000480を下抜けると、より低いサポート水準に向けて下落が加速する可能性があります。レジスタンスを上抜けて回復すれば、弱気シナリオは無効となる可能性があります$PEPE
$PENGU
.
26
·
--
ブリッシュ
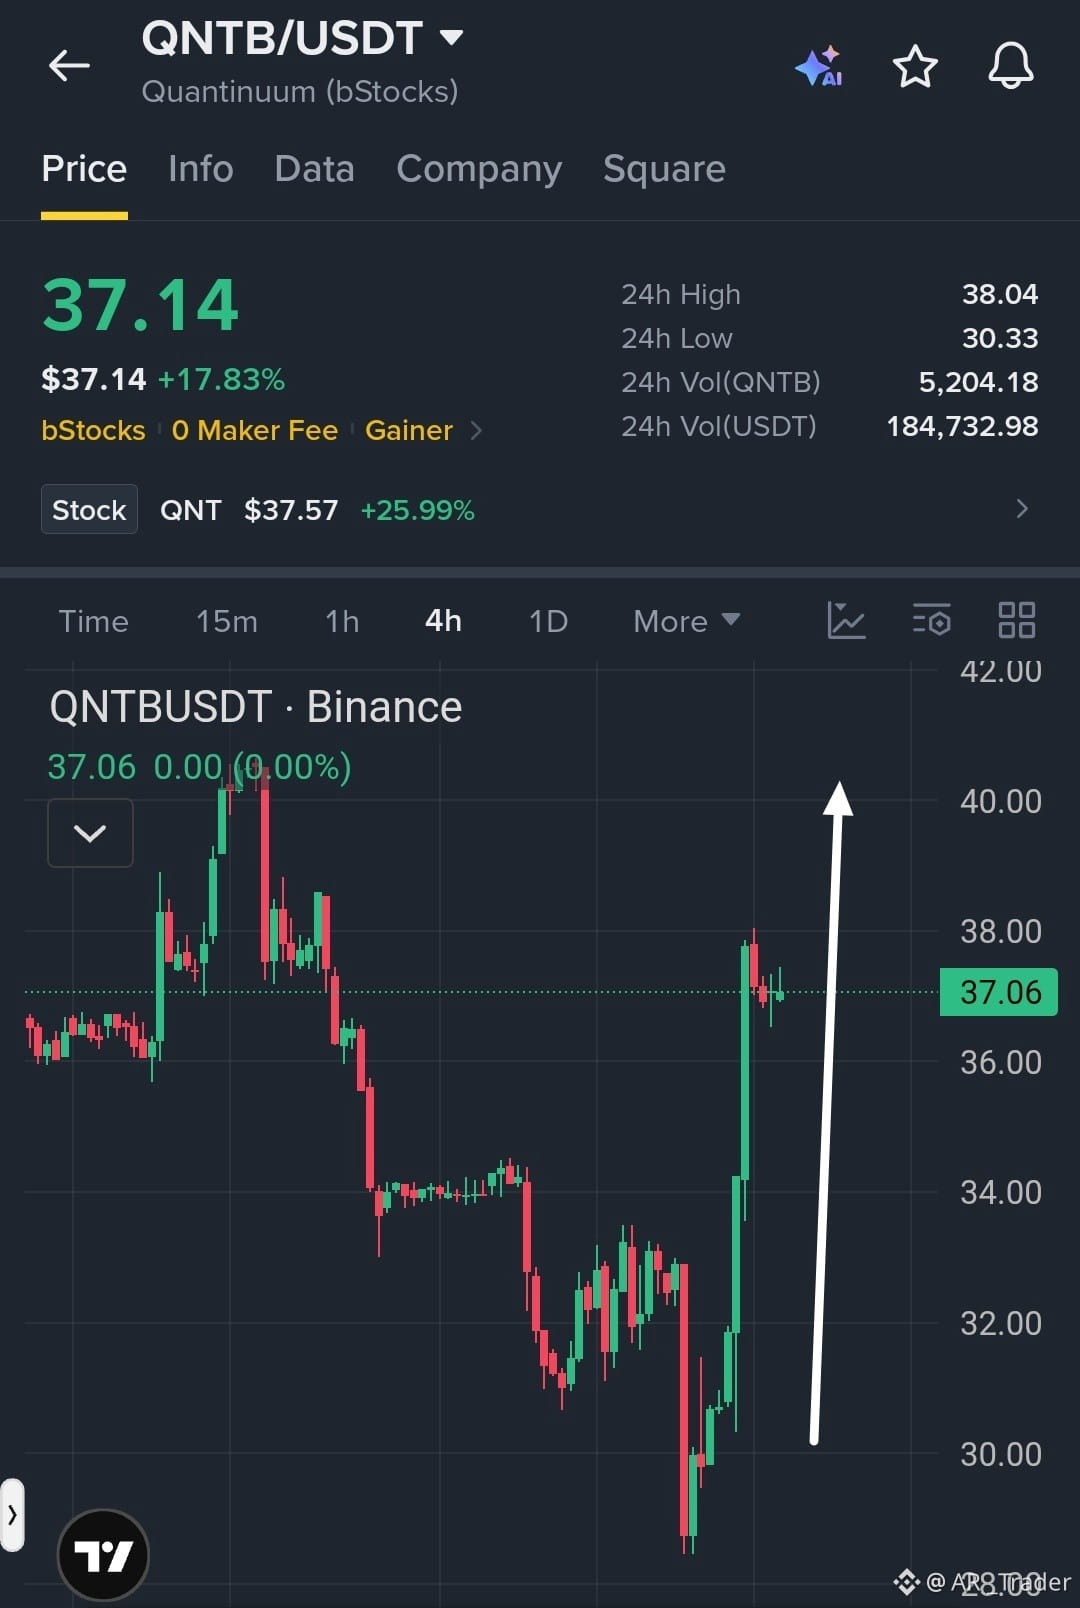
$QNTB /USDT、強い反発で40ドルのレジスタンスゾーンを目指す
取引戦略:ロング
エントリーゾーン:36.80–37.20
利確目標1:38.00
利確目標2:39.00
利確目標3:40.00
損切り:35.80
市場分析:4時間足チャートでは、29ドルのサポートエリアから力強く反転した後、38ドルに向けて急上昇しています。価格は37ドル付近で持ち合っており、36.50ドルを上回って維持できれば、40ドルに向けてさらに上昇する可能性があります。サポートを下抜けると、強気シナリオが弱まる可能性があります。
{spot}(QNTBUSDT)
$QNT
{future}(QNTUSDT)
.$QNTB
$QNTB /USDT、強い反発で40ドルのレジスタンスゾーンを目指す
取引戦略:ロング
エントリーゾーン:36.80–37.20
利確目標1:38.00
利確目標2:39.00
利確目標3:40.00
損切り:35.80
市場分析:4時間足チャートでは、29ドルのサポートエリアから力強く反転した後、38ドルに向けて急上昇しています。価格は37ドル付近で持ち合っており、36.50ドルを上回って維持できれば、40ドルに向けてさらに上昇する可能性があります。サポートを下抜けると、強気シナリオが弱まる可能性があります。
$QNT
.$QNTB
取引戦略:ロング
エントリーゾーン:36.80–37.20
利確目標1:38.00
利確目標2:39.00
利確目標3:40.00
損切り:35.80
市場分析:4時間足チャートでは、29ドルのサポートエリアから力強く反転した後、38ドルに向けて急上昇しています。価格は37ドル付近で持ち合っており、36.50ドルを上回って維持できれば、40ドルに向けてさらに上昇する可能性があります。サポートを下抜けると、強気シナリオが弱まる可能性があります。
$QNT
.$QNTB
20
·
--
ブリッシュ
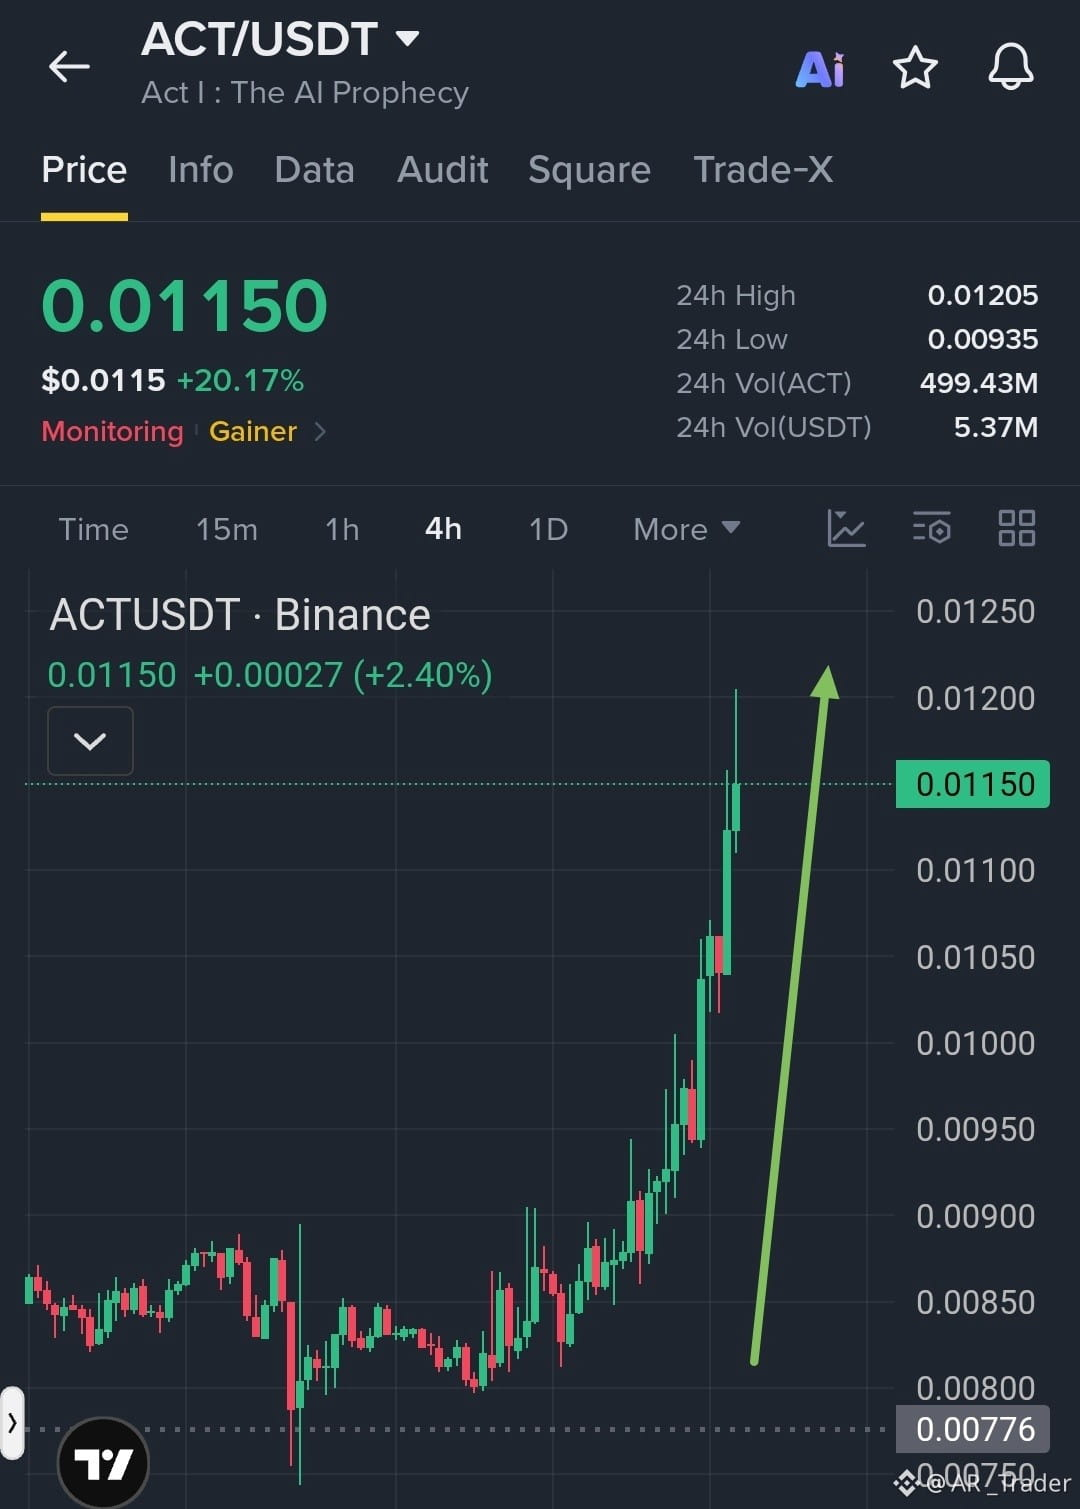
$ACT /USDT 強気派が勢いを維持、ブレイクアウトの目標に注目
トレード設定:ロング
エントリーゾーン:0.01130–0.01155
TP1:0.01180
TP2:0.01210
TP3:0.01250
SL:0.01090
市場状況:4時間足チャートでは、連続する陽線と買い圧力の高まりを伴う強い上昇ブレイクアウトが見られます。0.01120を上回って維持できれば、0.01200–0.01250に向けてさらに上昇する可能性があります。ブレイクアウトゾーンを下回ると、強気の勢いが弱まる可能性があります$ACT
{future}(ACTUSDT)
。
$ACT /USDT 強気派が勢いを維持、ブレイクアウトの目標に注目
トレード設定:ロング
エントリーゾーン:0.01130–0.01155
TP1:0.01180
TP2:0.01210
TP3:0.01250
SL:0.01090
市場状況:4時間足チャートでは、連続する陽線と買い圧力の高まりを伴う強い上昇ブレイクアウトが見られます。0.01120を上回って維持できれば、0.01200–0.01250に向けてさらに上昇する可能性があります。ブレイクアウトゾーンを下回ると、強気の勢いが弱まる可能性があります$ACT
。
トレード設定:ロング
エントリーゾーン:0.01130–0.01155
TP1:0.01180
TP2:0.01210
TP3:0.01250
SL:0.01090
市場状況:4時間足チャートでは、連続する陽線と買い圧力の高まりを伴う強い上昇ブレイクアウトが見られます。0.01120を上回って維持できれば、0.01200–0.01250に向けてさらに上昇する可能性があります。ブレイクアウトゾーンを下回ると、強気の勢いが弱まる可能性があります$ACT
。
34
·
--
ブリッシュ
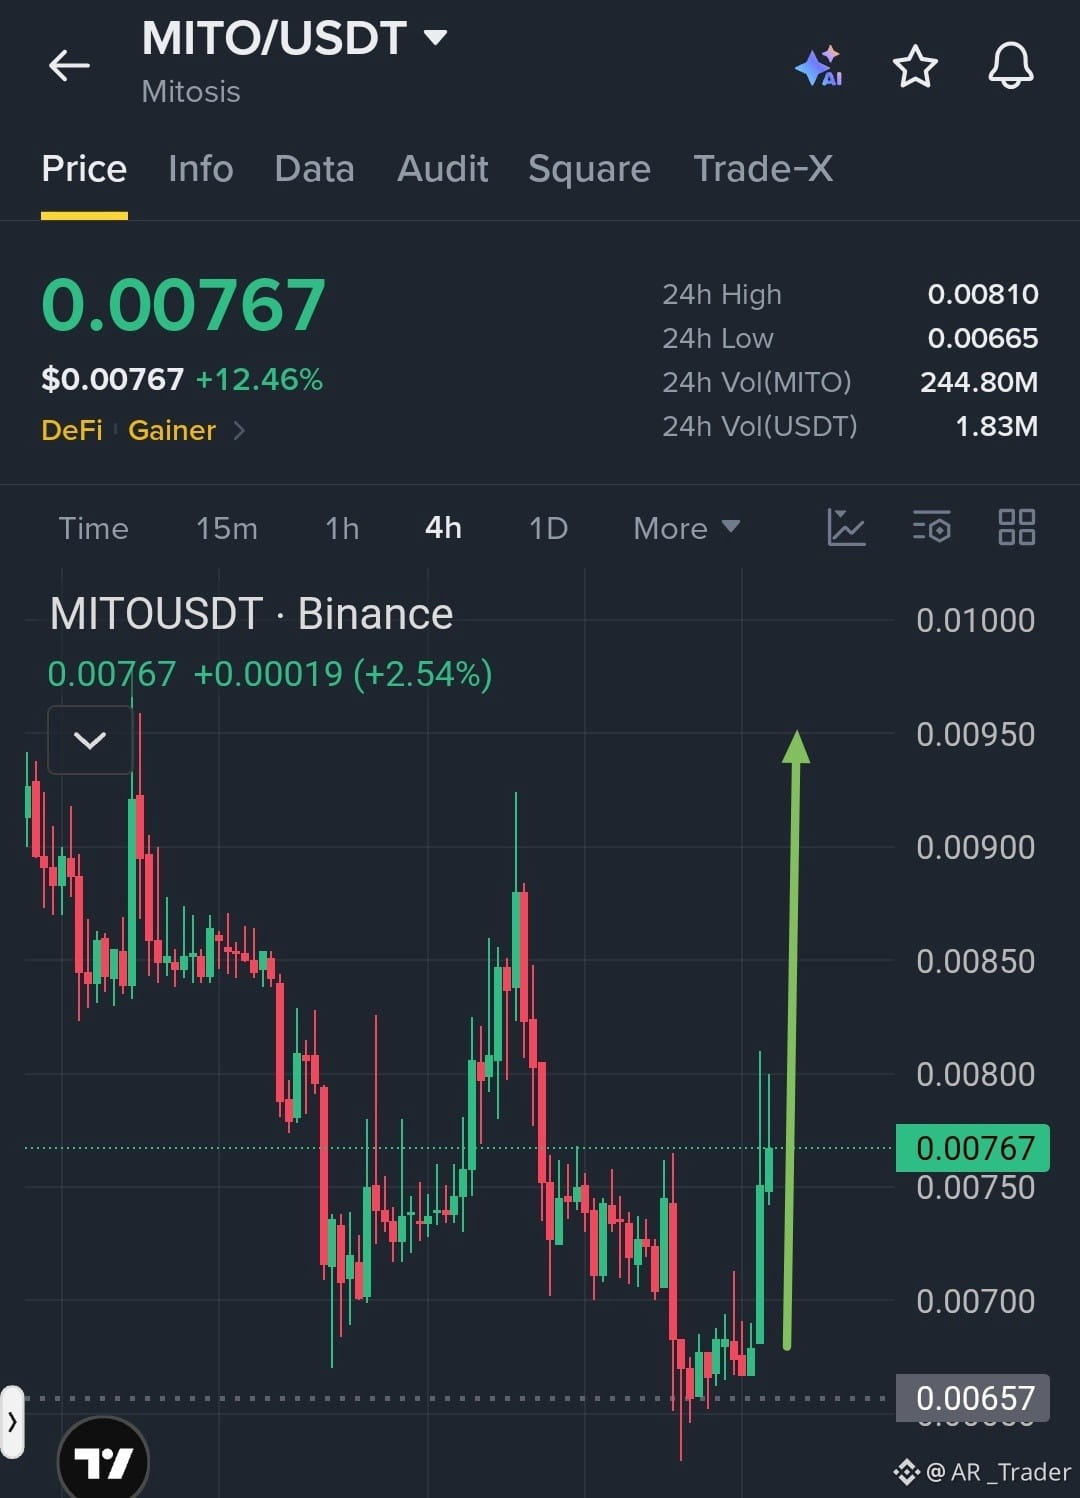
$MITO /USDT 強気派は、より高いレジスタンスに向けた力強い回復を準備
取引設定:ロング
エントリーゾーン:0.00755–0.00770
利確1:0.00800
利確2:0.00850
利確3:0.00900
損切り:0.00720
市場状況:4時間足チャートでは、0.00660のサポートゾーンから力強く反発し、買い手が価格を直近の持ち合い水準より上に押し上げています。0.00750を上回って維持できれば、さらに上のレジスタンス水準に向けて上昇する可能性があります。サポートを失うと、回復基調が弱まる可能性があります$MITO
{spot}(MITOUSDT)
.
$MITO /USDT 強気派は、より高いレジスタンスに向けた力強い回復を準備
取引設定:ロング
エントリーゾーン:0.00755–0.00770
利確1:0.00800
利確2:0.00850
利確3:0.00900
損切り:0.00720
市場状況:4時間足チャートでは、0.00660のサポートゾーンから力強く反発し、買い手が価格を直近の持ち合い水準より上に押し上げています。0.00750を上回って維持できれば、さらに上のレジスタンス水準に向けて上昇する可能性があります。サポートを失うと、回復基調が弱まる可能性があります$MITO
.
取引設定:ロング
エントリーゾーン:0.00755–0.00770
利確1:0.00800
利確2:0.00850
利確3:0.00900
損切り:0.00720
市場状況:4時間足チャートでは、0.00660のサポートゾーンから力強く反発し、買い手が価格を直近の持ち合い水準より上に押し上げています。0.00750を上回って維持できれば、さらに上のレジスタンス水準に向けて上昇する可能性があります。サポートを失うと、回復基調が弱まる可能性があります$MITO
.
59
·
--
弱気相場
翻訳参照
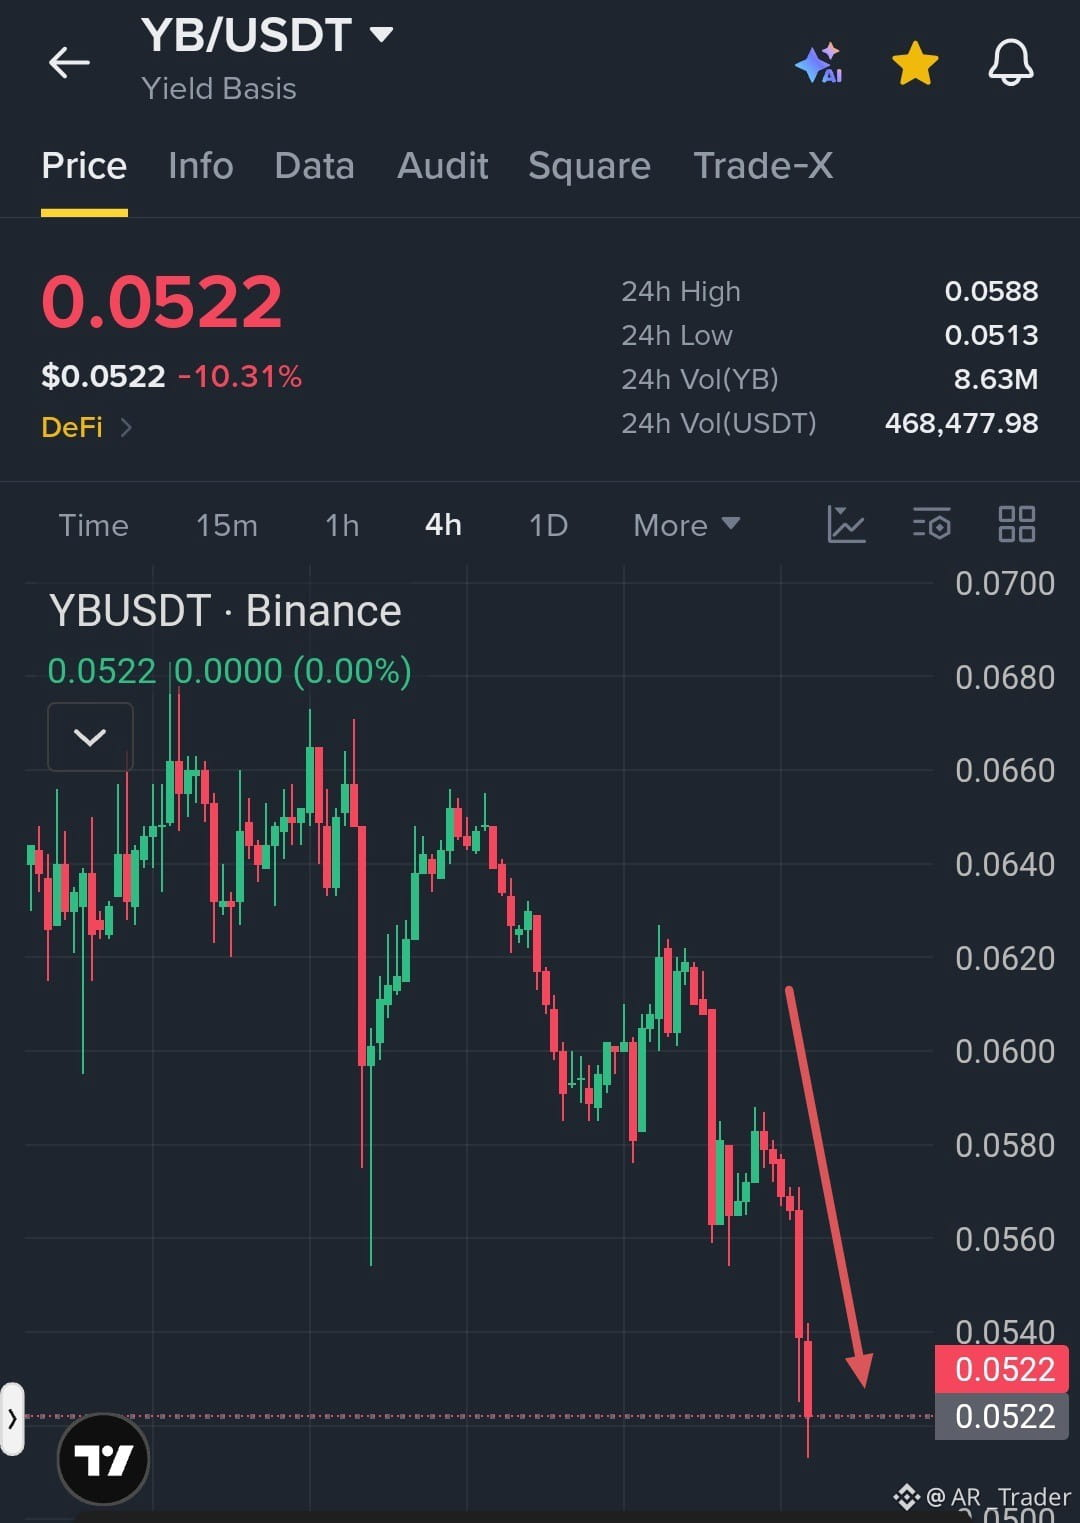
$YB /USDT Bears Strengthen Their Grip as Downside Pressure Accelerates
Trade Setup: SHORT
Entry Zone: 0.0520–0.0530
TP1: 0.0510
TP2: 0.0495
TP3: 0.0480
SL: 0.0545
Market Setup: The 4H chart shows a clear bearish structure with lower highs and lower lows. Strong selling pressure has pushed price toward fresh support near 0.0520. A confirmed breakdown could extend the decline toward lower support zones, while a recovery above resistance may invalidate the short setup$YB
{future}(YBUSDT)
$YGG
{future}(YGGUSDT)
.
$YB /USDT Bears Strengthen Their Grip as Downside Pressure Accelerates
Trade Setup: SHORT
Entry Zone: 0.0520–0.0530
TP1: 0.0510
TP2: 0.0495
TP3: 0.0480
SL: 0.0545
Market Setup: The 4H chart shows a clear bearish structure with lower highs and lower lows. Strong selling pressure has pushed price toward fresh support near 0.0520. A confirmed breakdown could extend the decline toward lower support zones, while a recovery above resistance may invalidate the short setup$YB
$YGG
.
Trade Setup: SHORT
Entry Zone: 0.0520–0.0530
TP1: 0.0510
TP2: 0.0495
TP3: 0.0480
SL: 0.0545
Market Setup: The 4H chart shows a clear bearish structure with lower highs and lower lows. Strong selling pressure has pushed price toward fresh support near 0.0520. A confirmed breakdown could extend the decline toward lower support zones, while a recovery above resistance may invalidate the short setup$YB
$YGG
.
27
·
--
ブリッシュ
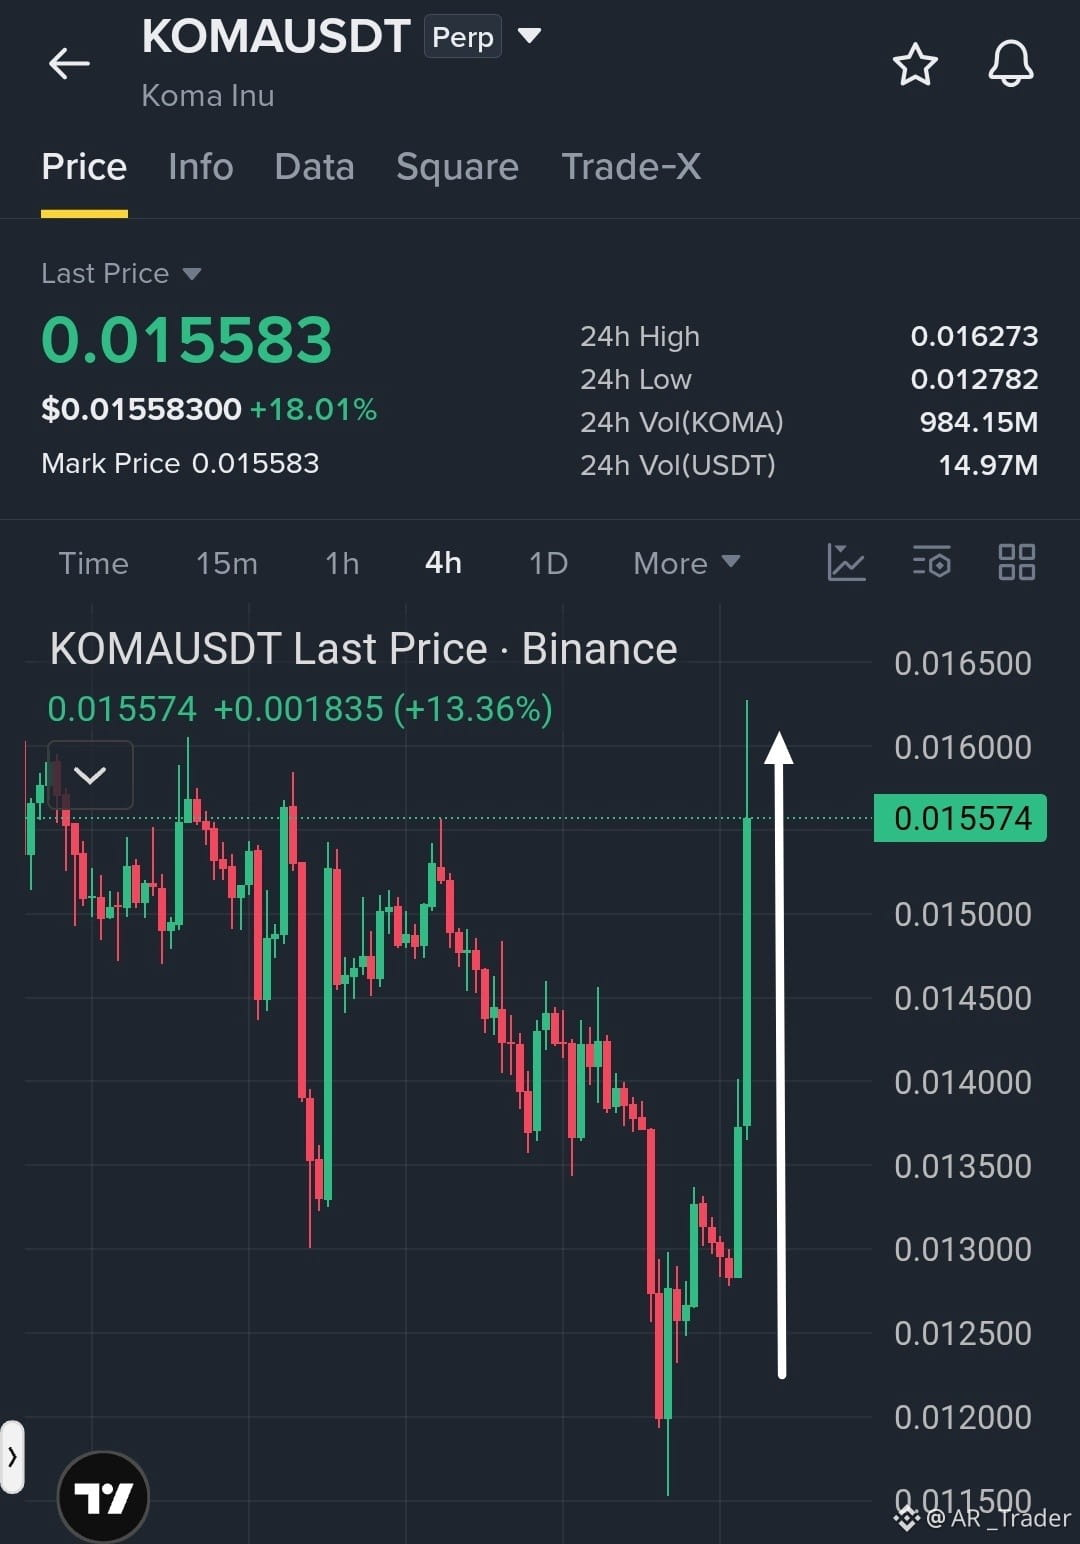
$KOMA USDT 強気派が力強い反転を見せ、さらなる上昇余地も
取引戦略: ロング
エントリーゾーン: 0.015400–0.015600
利確1: 0.016000
利確2: 0.016500
利確3: 0.017000
損切り: 0.014900
相場状況: 4時間足チャートでは、直近の持ち合いを大きな陽線で上抜け、力強い強気反転が見られます。0.015400を上回る勢いが続けば、さらに上昇する可能性があります。0.016000付近の抵抗に注意し、価格がブレイクアウトのサポートを失った場合は、高値を追って買わないようにしましょう$KOMA
{future}(KOMAUSDT)
$KO
{future}(KOUSDT)
。
$KOMA USDT 強気派が力強い反転を見せ、さらなる上昇余地も
取引戦略: ロング
エントリーゾーン: 0.015400–0.015600
利確1: 0.016000
利確2: 0.016500
利確3: 0.017000
損切り: 0.014900
相場状況: 4時間足チャートでは、直近の持ち合いを大きな陽線で上抜け、力強い強気反転が見られます。0.015400を上回る勢いが続けば、さらに上昇する可能性があります。0.016000付近の抵抗に注意し、価格がブレイクアウトのサポートを失った場合は、高値を追って買わないようにしましょう$KOMA
$KO
。
取引戦略: ロング
エントリーゾーン: 0.015400–0.015600
利確1: 0.016000
利確2: 0.016500
利確3: 0.017000
損切り: 0.014900
相場状況: 4時間足チャートでは、直近の持ち合いを大きな陽線で上抜け、力強い強気反転が見られます。0.015400を上回る勢いが続けば、さらに上昇する可能性があります。0.016000付近の抵抗に注意し、価格がブレイクアウトのサポートを失った場合は、高値を追って買わないようにしましょう$KOMA
$KO
。
239
ログインして、さらにコンテンツを読む
厳選トピックで世界の暗号資産トレーダーの仲間入り
⚡️ 暗号資産に関する最新かつ有益な情報が見つかります。
💬 世界最大の暗号資産取引所から信頼されています。
👍 認証を受けたクリエイターから、有益なインサイトを得られます。
メール / 電話番号