
ProfessorLeoSir
813 投稿

ProfessorLeoSir
報告
ユーザーをブロック
Crypto Expert & Market Analyst || Scalper || Follow me on Twitter or X: @ProfessorLeoSir || If you want to Lead the market with every analysis ||
低高頻度トレーダー
1.8年
15 フォロー
774 フォロワー
2.4K+ いいね
投稿
すべて
引用
動画
何か面白いことが進行中………
$XRP は静かに動いていますが、私は構造を注意深く見ています。
今は次のローソク足を予測することよりも、このレンジからXRPがどこでブレイクするかに興味があります。
私にとって重要なのは$3.00のあたりです。
買い手がまともな出来高を伴ってその水準を取り戻し、上で維持できるなら、次に注目するのは:
🎯 $3.15
🎯 $3.30
🎯 $3.50
しかし、もう一つの側面もあります。
もしXRPが現在のサポート・ゾーンを維持できず、売り手が主導権を取るなら、別のロングのセットアップを考える前に、より深い押し目が入ることを想定します。
私のトレード見立て:
$3.00を上回る確証を見ています。
追いかけない。FOMOしない。
ブレイク自体は面白い。
ブレイク+リテストのほうがはるかに良い。
次に何が起きると思いますか?👇
この戦いでどちらが勝つのか見てみましょう。
{future}(XRPUSDT)
何か面白いことが進行中………
$XRP は静かに動いていますが、私は構造を注意深く見ています。
今は次のローソク足を予測することよりも、このレンジからXRPがどこでブレイクするかに興味があります。
私にとって重要なのは$3.00のあたりです。
買い手がまともな出来高を伴ってその水準を取り戻し、上で維持できるなら、次に注目するのは:
🎯 $3.15
🎯 $3.30
🎯 $3.50
しかし、もう一つの側面もあります。
もしXRPが現在のサポート・ゾーンを維持できず、売り手が主導権を取るなら、別のロングのセットアップを考える前に、より深い押し目が入ることを想定します。
私のトレード見立て:
$3.00を上回る確証を見ています。
追いかけない。FOMOしない。
ブレイク自体は面白い。
ブレイク+リテストのほうがはるかに良い。
次に何が起きると思いますか?👇
この戦いでどちらが勝つのか見てみましょう。
$XRP は静かに動いていますが、私は構造を注意深く見ています。
今は次のローソク足を予測することよりも、このレンジからXRPがどこでブレイクするかに興味があります。
私にとって重要なのは$3.00のあたりです。
買い手がまともな出来高を伴ってその水準を取り戻し、上で維持できるなら、次に注目するのは:
🎯 $3.15
🎯 $3.30
🎯 $3.50
しかし、もう一つの側面もあります。
もしXRPが現在のサポート・ゾーンを維持できず、売り手が主導権を取るなら、別のロングのセットアップを考える前に、より深い押し目が入ることを想定します。
私のトレード見立て:
$3.00を上回る確証を見ています。
追いかけない。FOMOしない。
ブレイク自体は面白い。
ブレイク+リテストのほうがはるかに良い。
次に何が起きると思いますか?👇
この戦いでどちらが勝つのか見てみましょう。
XRP stays in the range
13%
XRP reclaims $3.00
52%
XRP loses support
22%
🚀 XRP breaks out directly
13%
63 投票 • 投票は終了しました
1
819
·
--
ブリッシュ
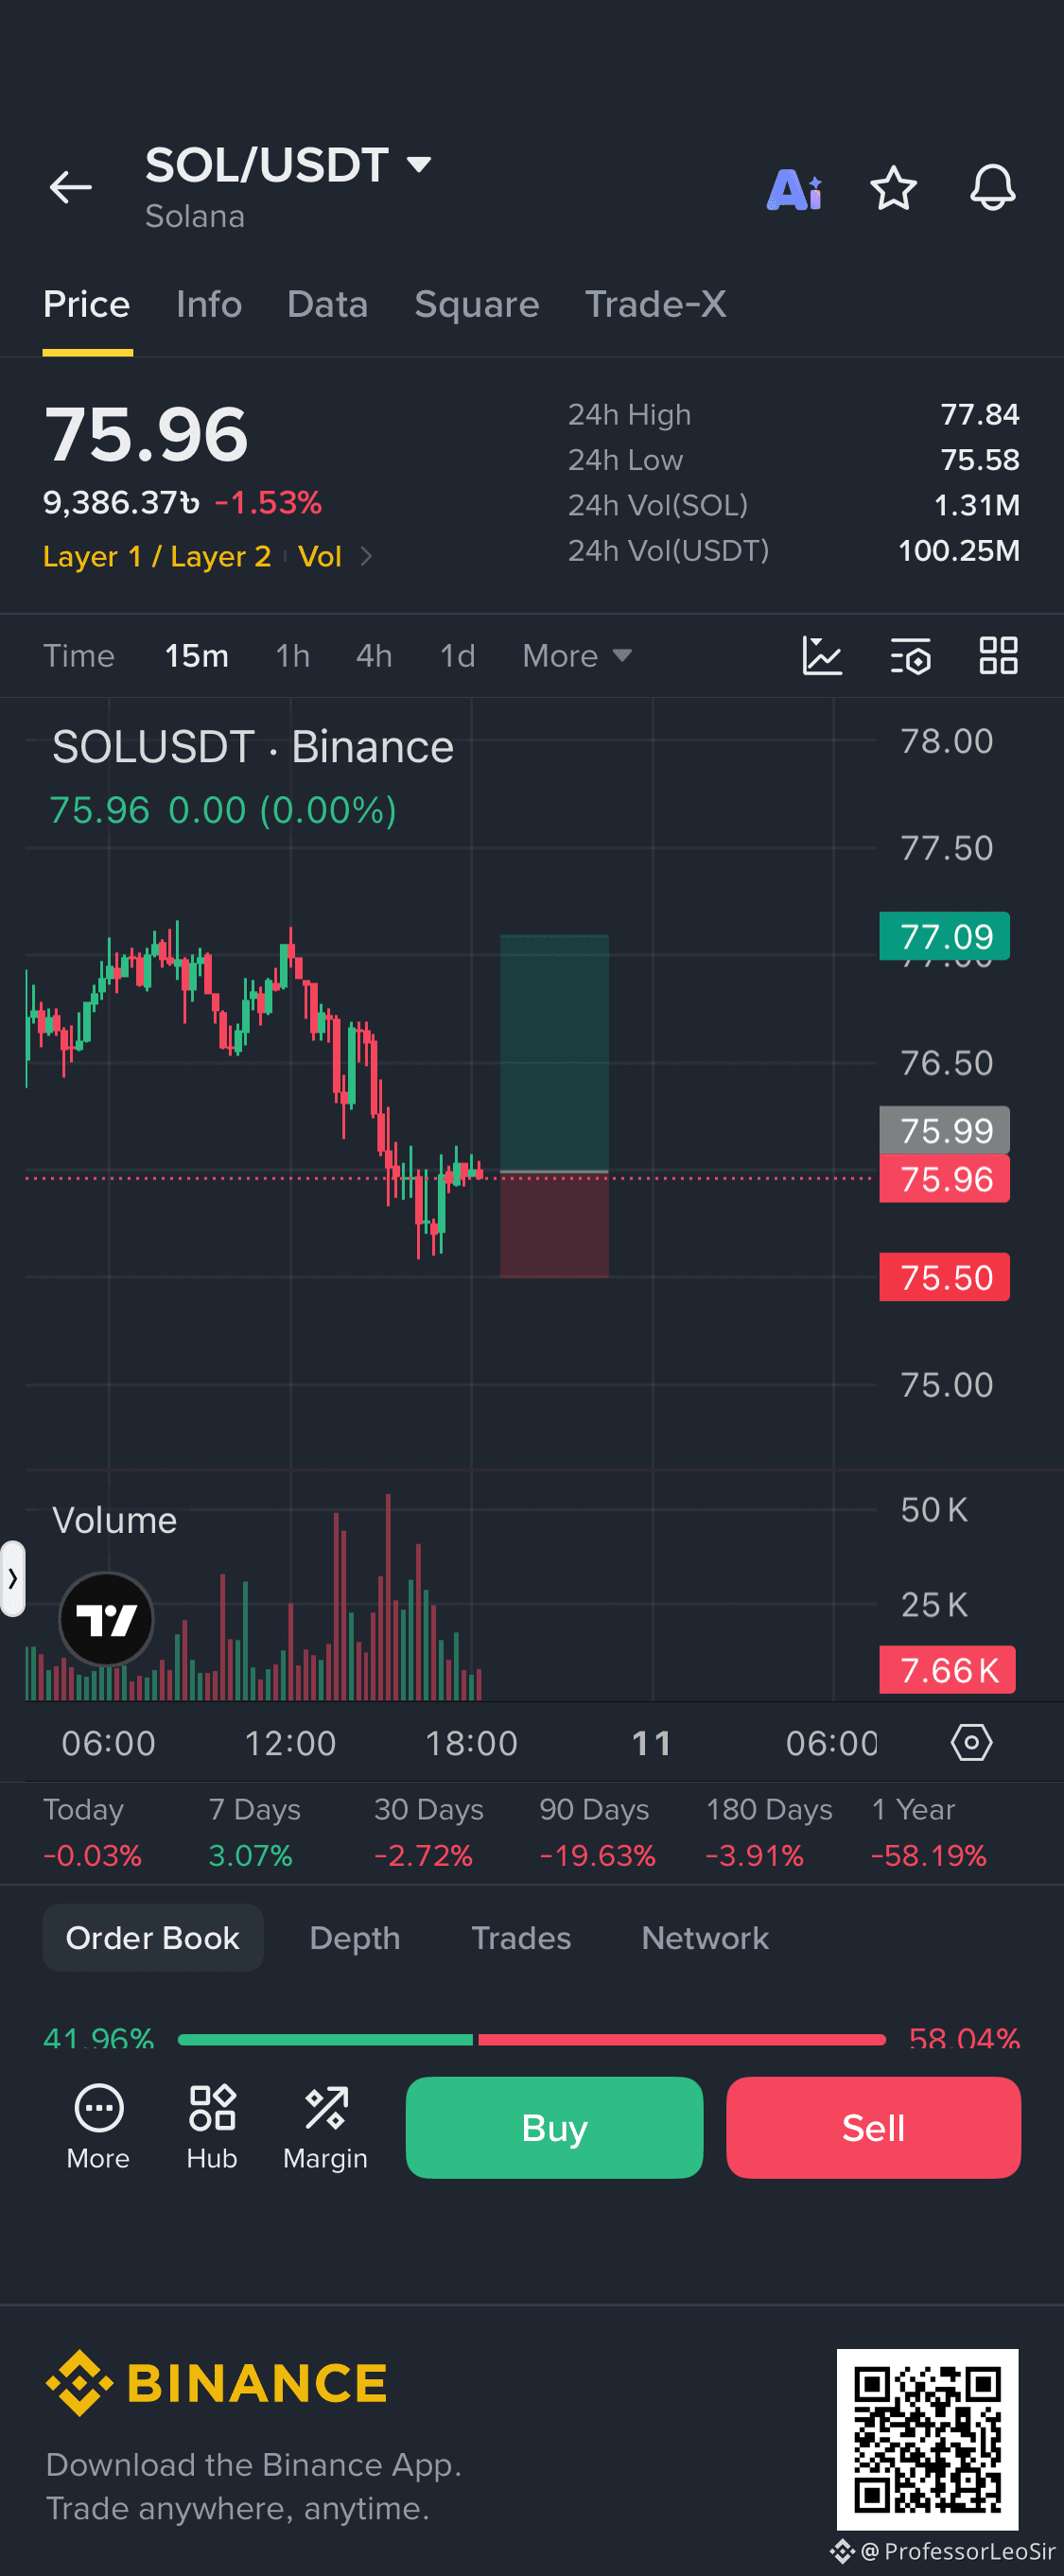
$SOL Scalpingアラート..
4時間足では上昇しているように見えますが、1時間足では大きく下落しているのが確認できます。なので、いまは回復のタイミングです。
エントリーは今
まずは1ドルの利益を狙うだけ
損切りは75.50
損切りを適切に維持してください。
$SOL Scalpingアラート..
4時間足では上昇しているように見えますが、1時間足では大きく下落しているのが確認できます。なので、いまは回復のタイミングです。
エントリーは今
まずは1ドルの利益を狙うだけ
損切りは75.50
損切りを適切に維持してください。
4時間足では上昇しているように見えますが、1時間足では大きく下落しているのが確認できます。なので、いまは回復のタイミングです。
エントリーは今
まずは1ドルの利益を狙うだけ
損切りは75.50
損切りを適切に維持してください。
情報源:ユーザーがバイナンス上で共有したコンテンツ
1
100
·
--
ブリッシュ
$BNB もう最初のターゲットをヒットした。
そして今は次のターゲット、612に触れようとしている。
スキャルピングアラート
ポンプのたびに利益2ドルを612まで狙う。
ストップロスは600に維持する。
{future}(BNBUSDT)
$BNB もう最初のターゲットをヒットした。
そして今は次のターゲット、612に触れようとしている。
スキャルピングアラート
ポンプのたびに利益2ドルを612まで狙う。
ストップロスは600に維持する。
そして今は次のターゲット、612に触れようとしている。
スキャルピングアラート
ポンプのたびに利益2ドルを612まで狙う。
ストップロスは600に維持する。
ProfessorLeoSir
·
--
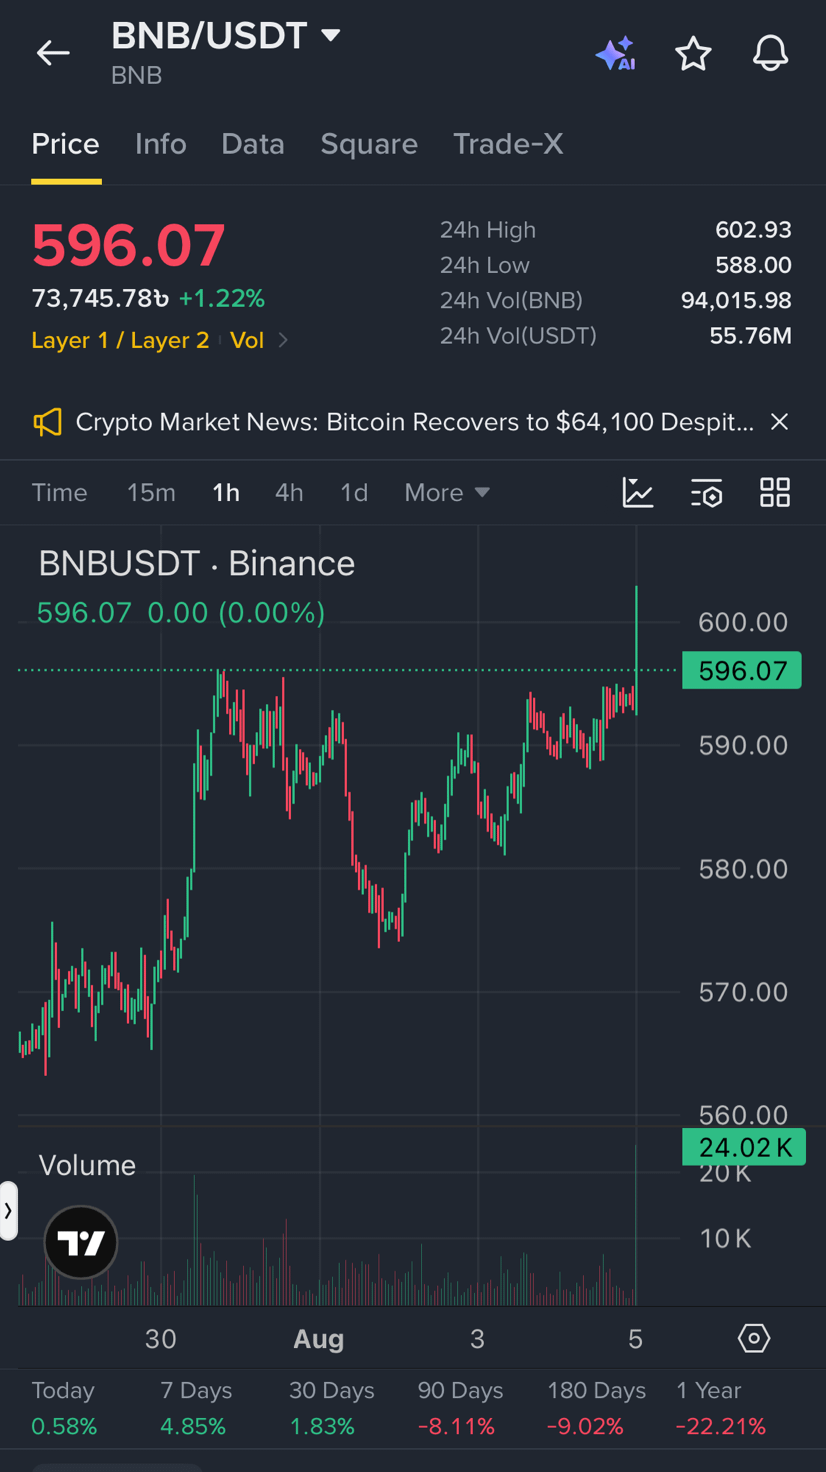
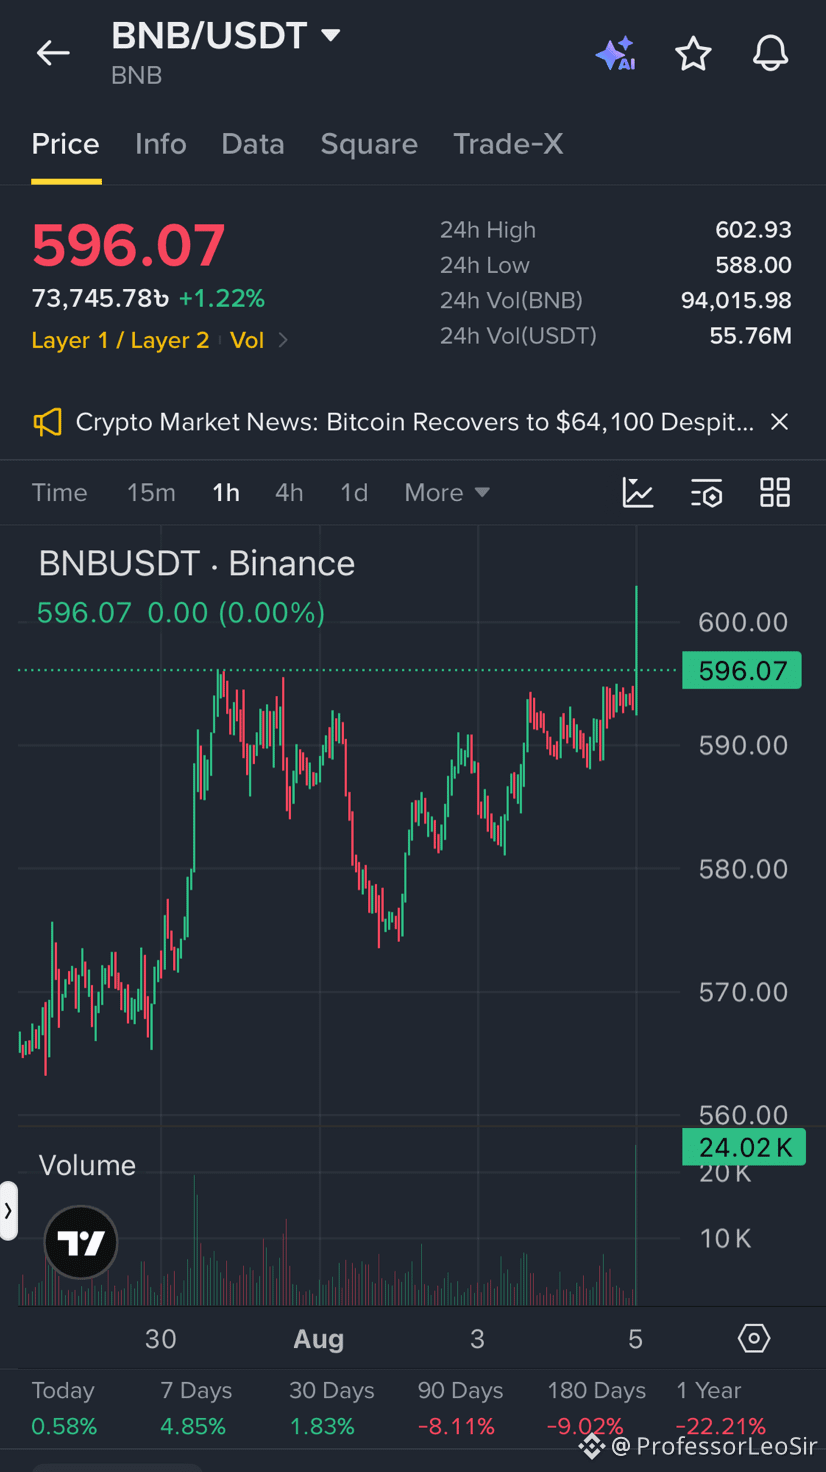
ブリッシュ$BNB は$596.07付近で鍵となるローカル抵抗を押しながら、24.02K BNBの急激な1h出来高急増の後に動いています。市場構造は、買い手が上方の流動性を吸収して、$602.93の24時間高値に向けた拡大テストを行おうとしていることを示しています。
$597.00を上回る、クリーンな1hローソク足の終値を待ってから、ローカル高値方向への継続を確認してください。
方向性セットアップ:強気のブレイクアウト
条件:$597.00を上回る1h終値かつ継続的な買い出来高
エントリーゾーン:$594.00〜$597.00
テイクプロフィット1:$603.00
テイクプロフィット2:$612.00
損切り(無効化):$587.50
この$BNB のブレイクアウトに対してロングポジションを開きますか?それとも$603のレジスタンス近辺で利確しますか?
#bnb #cryptotrading #TradingSignal #BinanceSquare
$597.00を上回る、クリーンな1hローソク足の終値を待ってから、ローカル高値方向への継続を確認してください。
方向性セットアップ:強気のブレイクアウト
条件:$597.00を上回る1h終値かつ継続的な買い出来高
エントリーゾーン:$594.00〜$597.00
テイクプロフィット1:$603.00
テイクプロフィット2:$612.00
損切り(無効化):$587.50
この$BNB のブレイクアウトに対してロングポジションを開きますか?それとも$603のレジスタンス近辺で利確しますか?
#bnb #cryptotrading #TradingSignal #BinanceSquare
1
11
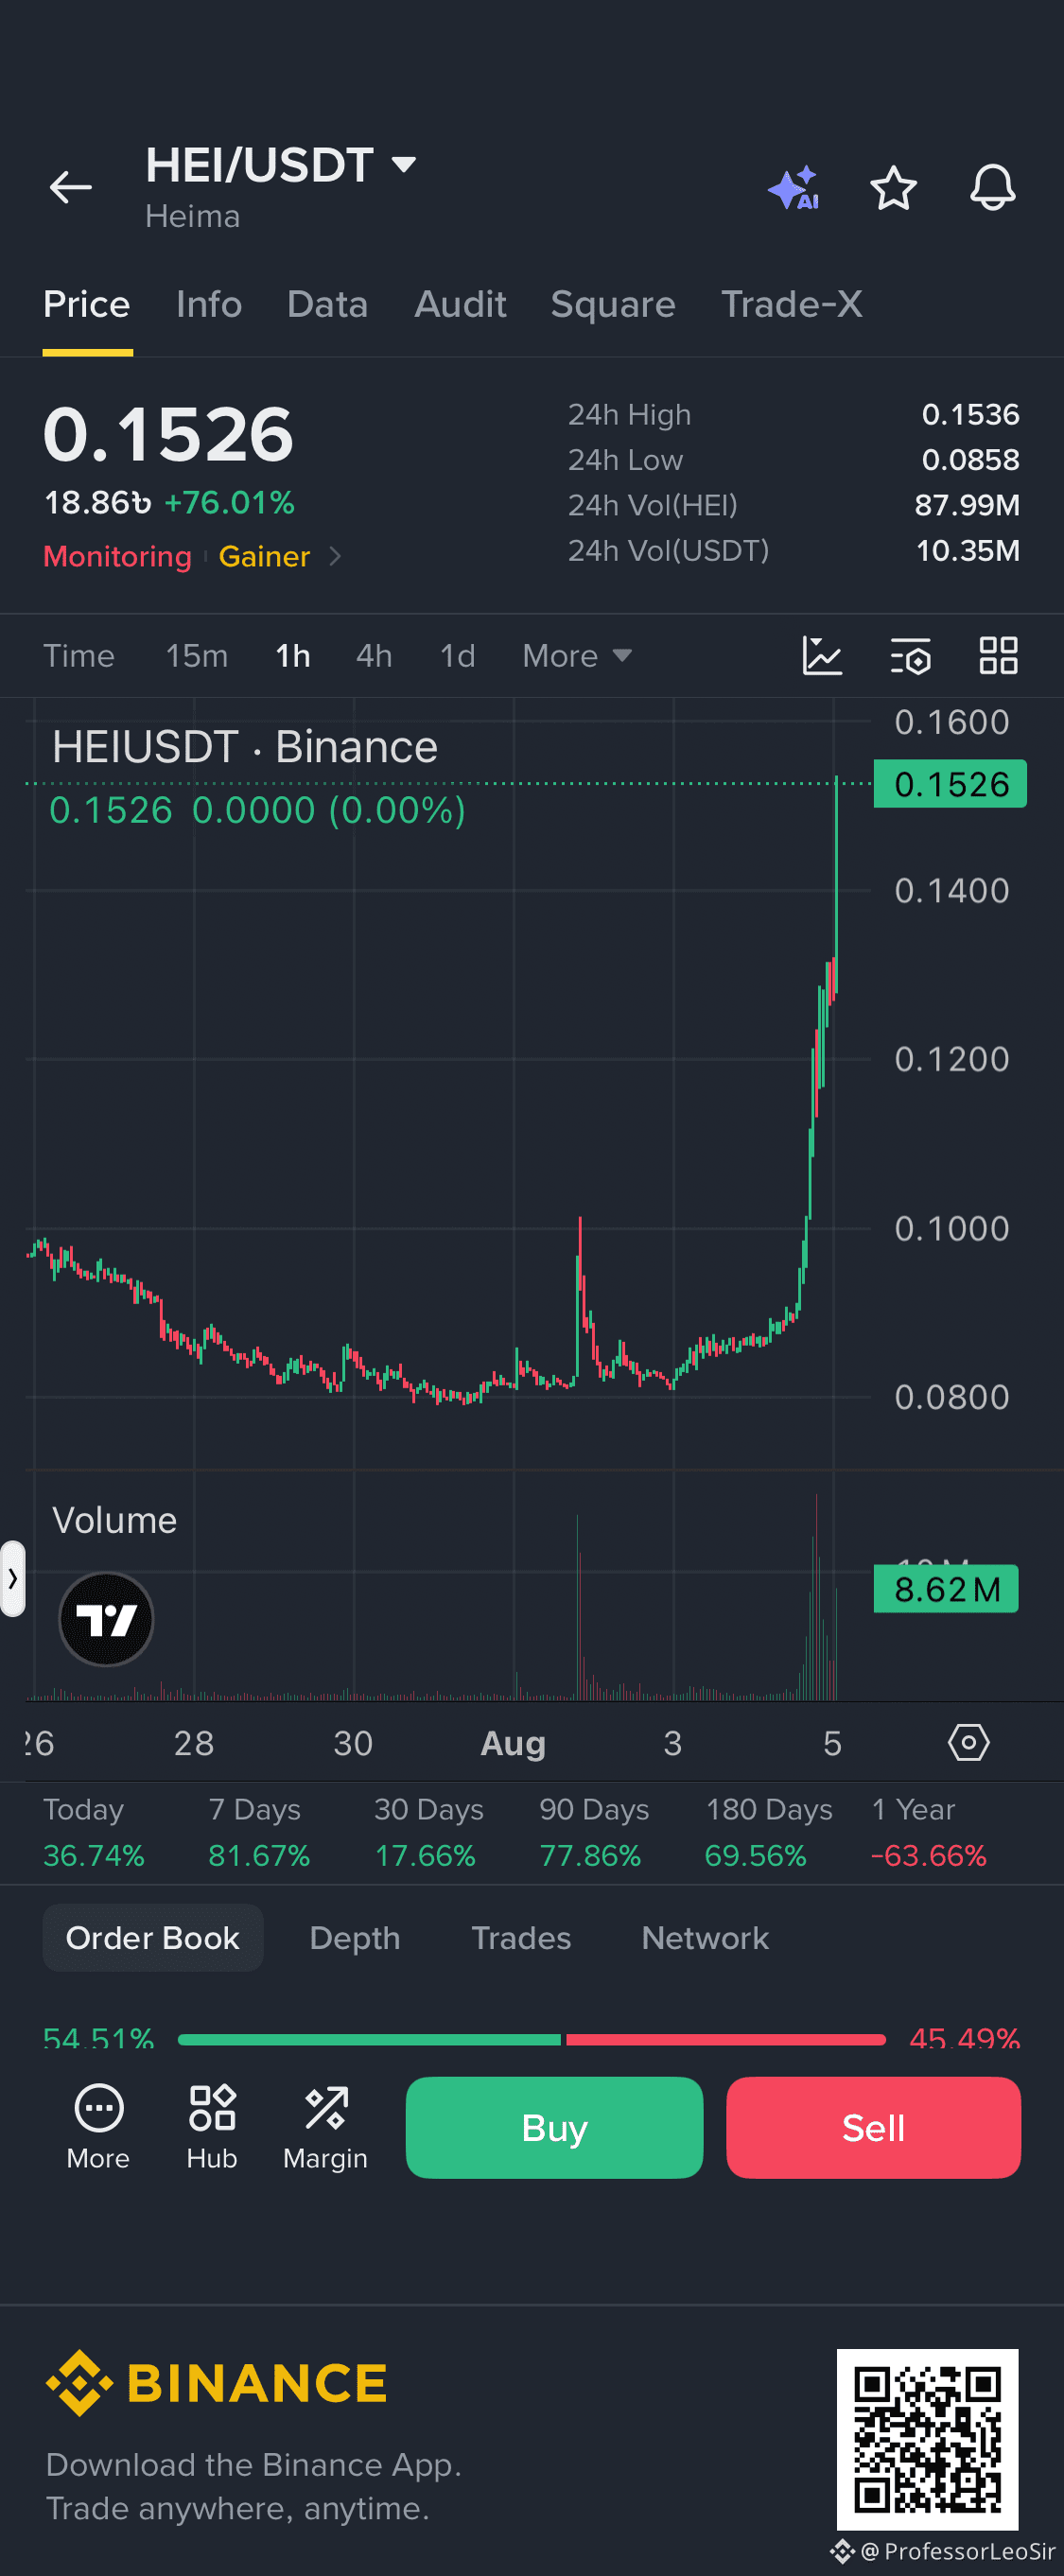
この放物線ポンプは $HEI の設定で、ブロウオフ・トップのリトレース準備をしているのか?それとも買い手が $0.1600 を超えて押し上げるのか?
HEI/USDT – 過度に延びた上昇の流動性トラップ
ストーリー
HEI/USDT は安値 $0.0858 から急激に膨張(+76.01% / 24h)し、抵抗水準付近の $0.1536 に到達しました。1H(1時間足)では、出来高の大きいスパイクを伴うまま上方の供給帯へ垂直に伸びており、価格が基礎となる市場構造から大きく逸脱しています。そのため、急激な平均回帰(ミーン・リバージョン)による押し戻しの確率が高まっています。
ゲームプラン
下落への反転を確認するために、1H で価格が拒否(リジェクション)されるか、$0.1420 の主要なミクロサポートを下回って構造が崩れるのを注視しましょう。その後、下方向へのリトレースを、主要な需要ゾーンへ向けて狙います。
シグナルボックス
* セットアップ:弱気のリジェクション / 押し戻し
* 条件:24h高値でのリジェクション後、1H足が $0.1420 を下回って終値確定
* エントリーゾーン:$0.1480 – $0.1530
* 利確1:$0.1250
* 利確2:$0.1020
* 損切り(無効化):$0.1610
{future}(HEIUSDT)
この放物線ポンプは $HEI の設定で、ブロウオフ・トップのリトレース準備をしているのか?それとも買い手が $0.1600 を超えて押し上げるのか?
HEI/USDT – 過度に延びた上昇の流動性トラップ
ストーリー
HEI/USDT は安値 $0.0858 から急激に膨張(+76.01% / 24h)し、抵抗水準付近の $0.1536 に到達しました。1H(1時間足)では、出来高の大きいスパイクを伴うまま上方の供給帯へ垂直に伸びており、価格が基礎となる市場構造から大きく逸脱しています。そのため、急激な平均回帰(ミーン・リバージョン)による押し戻しの確率が高まっています。
ゲームプラン
下落への反転を確認するために、1H で価格が拒否(リジェクション)されるか、$0.1420 の主要なミクロサポートを下回って構造が崩れるのを注視しましょう。その後、下方向へのリトレースを、主要な需要ゾーンへ向けて狙います。
シグナルボックス
* セットアップ:弱気のリジェクション / 押し戻し
* 条件:24h高値でのリジェクション後、1H足が $0.1420 を下回って終値確定
* エントリーゾーン:$0.1480 – $0.1530
* 利確1:$0.1250
* 利確2:$0.1020
* 損切り(無効化):$0.1610
HEI/USDT – 過度に延びた上昇の流動性トラップ
ストーリー
HEI/USDT は安値 $0.0858 から急激に膨張(+76.01% / 24h)し、抵抗水準付近の $0.1536 に到達しました。1H(1時間足)では、出来高の大きいスパイクを伴うまま上方の供給帯へ垂直に伸びており、価格が基礎となる市場構造から大きく逸脱しています。そのため、急激な平均回帰(ミーン・リバージョン)による押し戻しの確率が高まっています。
ゲームプラン
下落への反転を確認するために、1H で価格が拒否(リジェクション)されるか、$0.1420 の主要なミクロサポートを下回って構造が崩れるのを注視しましょう。その後、下方向へのリトレースを、主要な需要ゾーンへ向けて狙います。
シグナルボックス
* セットアップ:弱気のリジェクション / 押し戻し
* 条件:24h高値でのリジェクション後、1H足が $0.1420 を下回って終値確定
* エントリーゾーン:$0.1480 – $0.1530
* 利確1:$0.1250
* 利確2:$0.1020
* 損切り(無効化):$0.1610
情報源:ユーザーがバイナンス上で共有したコンテンツ
1
137
·
--
ブリッシュ
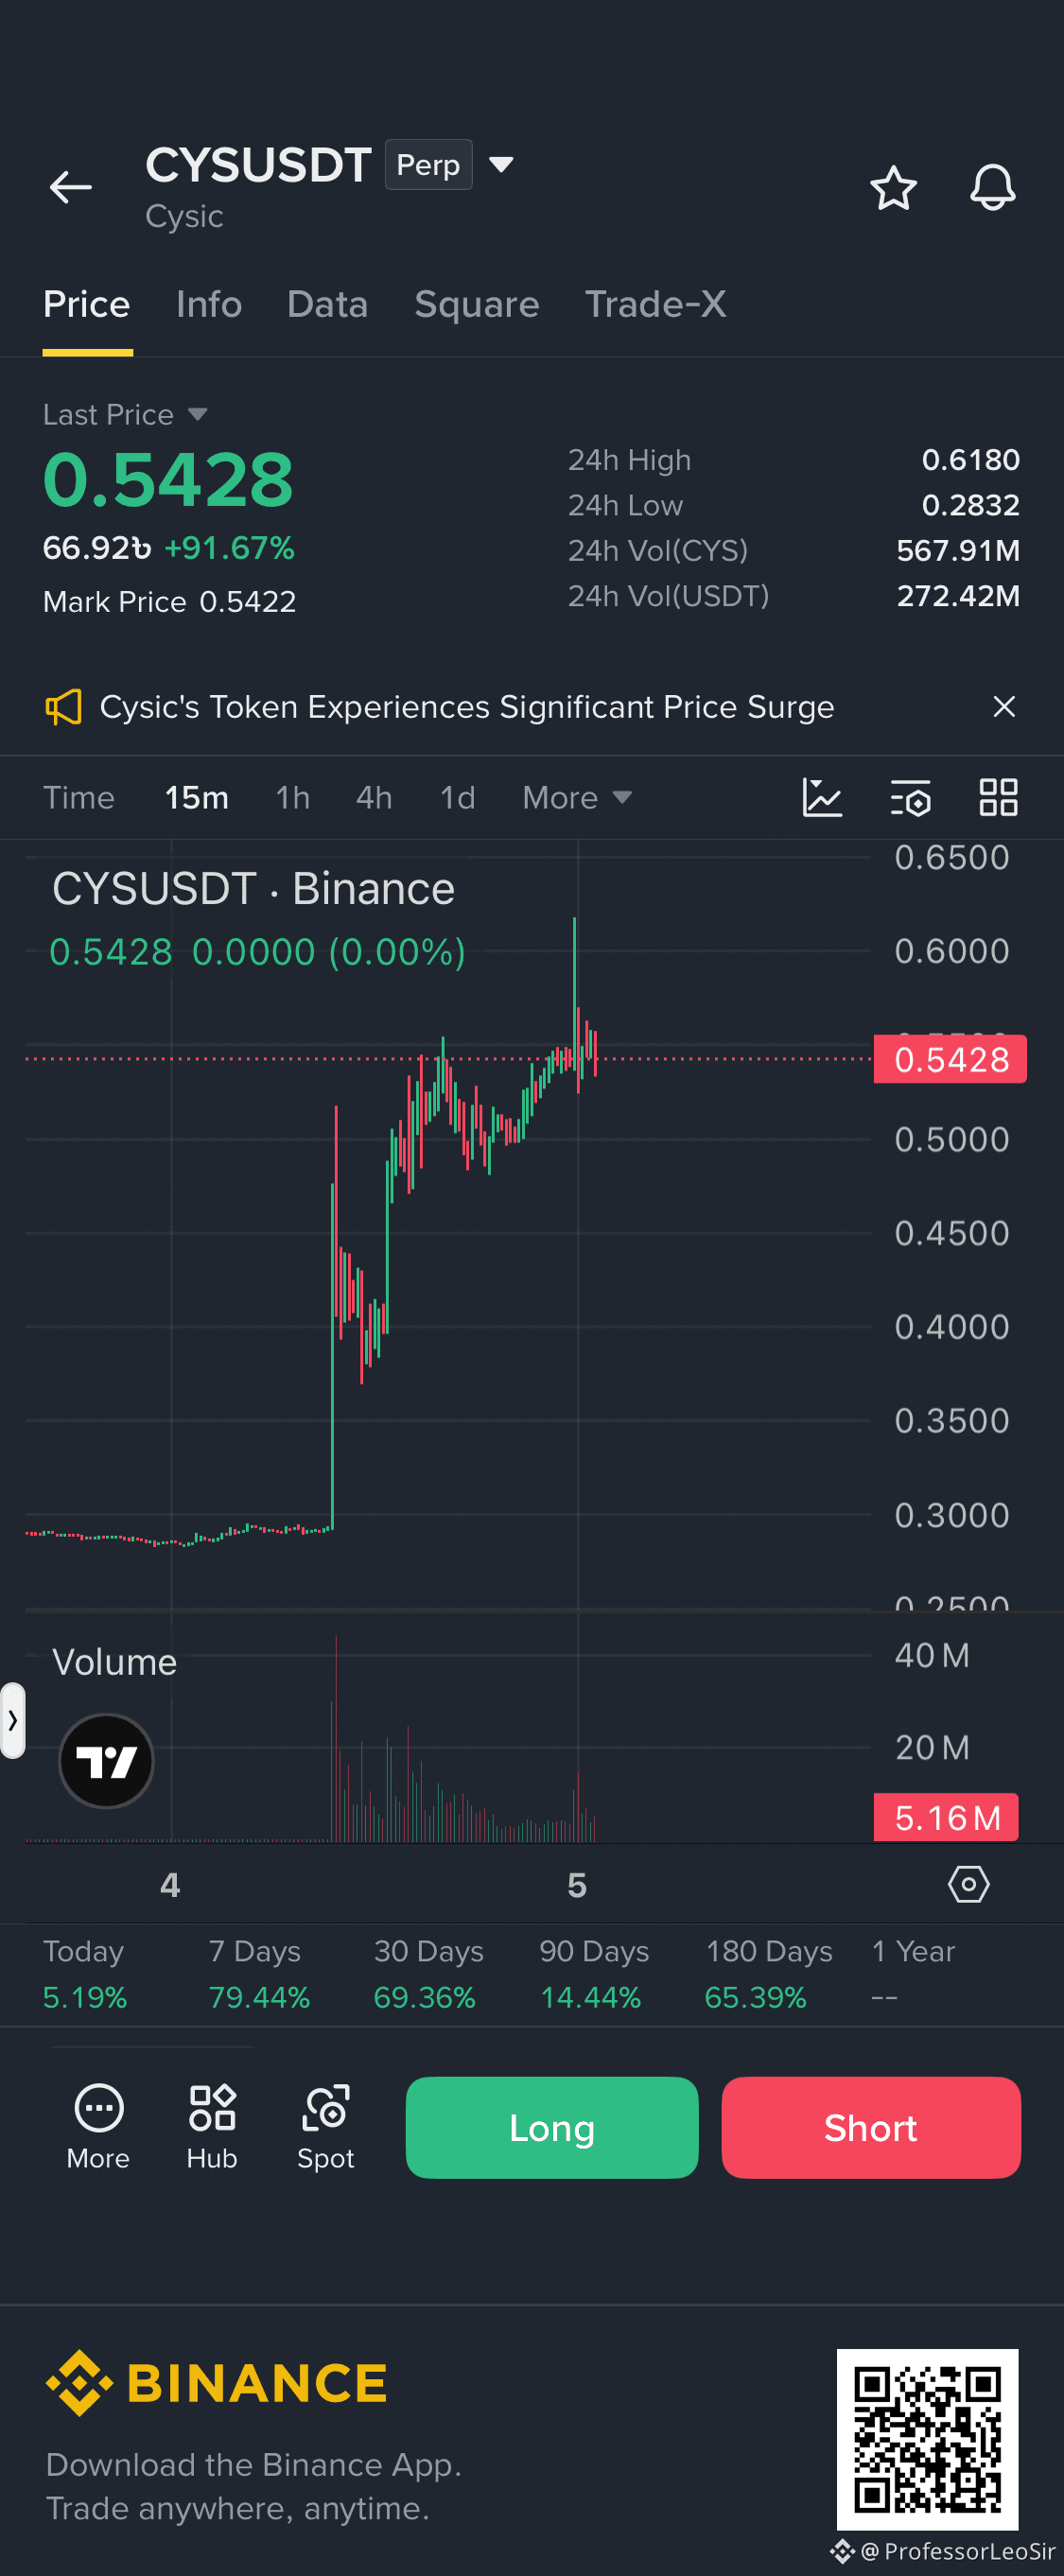
$CYS は急激な上昇で24時間の高値$0.6180(出来高$272.42M USDT)まで駆け上がった後、$0.5428まで押し戻されています。15分足チャートでは、$0.6180で上方の流動性を拒否した後、約$0.5200のミッドレンジのサポート付近を上回ったまま推移し、価格がレンジ内に落ち着いています。
24時間高値に向けた継続を確認するために、$0.5650を上回るクリーンな15分足のクローズを待ちましょう。
方向性のセットアップ:条件付きブレイクアウト
条件:買い注文の出来高が拡大し、15分足が$0.5650を上抜けて終値確定
エントリーゾーン:$0.5300〜$0.5500
利確1:$0.6180
利確2:$0.6700
損切り(無効化):$0.4950
あなたはCYSで$0.5650のブレイクアウト・トリガーを取引するのか、それとも$0.5200の需要ゾーンへ向けたより深いリテストを待つのか?
#CYS #cryptotrading #TradingSignals #BinanceSquare
{future}(CYSUSDT)
$CYS は急激な上昇で24時間の高値$0.6180(出来高$272.42M USDT)まで駆け上がった後、$0.5428まで押し戻されています。15分足チャートでは、$0.6180で上方の流動性を拒否した後、約$0.5200のミッドレンジのサポート付近を上回ったまま推移し、価格がレンジ内に落ち着いています。
24時間高値に向けた継続を確認するために、$0.5650を上回るクリーンな15分足のクローズを待ちましょう。
方向性のセットアップ:条件付きブレイクアウト
条件:買い注文の出来高が拡大し、15分足が$0.5650を上抜けて終値確定
エントリーゾーン:$0.5300〜$0.5500
利確1:$0.6180
利確2:$0.6700
損切り(無効化):$0.4950
あなたはCYSで$0.5650のブレイクアウト・トリガーを取引するのか、それとも$0.5200の需要ゾーンへ向けたより深いリテストを待つのか?
#CYS #cryptotrading #TradingSignals #BinanceSquare
24時間高値に向けた継続を確認するために、$0.5650を上回るクリーンな15分足のクローズを待ちましょう。
方向性のセットアップ:条件付きブレイクアウト
条件:買い注文の出来高が拡大し、15分足が$0.5650を上抜けて終値確定
エントリーゾーン:$0.5300〜$0.5500
利確1:$0.6180
利確2:$0.6700
損切り(無効化):$0.4950
あなたはCYSで$0.5650のブレイクアウト・トリガーを取引するのか、それとも$0.5200の需要ゾーンへ向けたより深いリテストを待つのか?
#CYS #cryptotrading #TradingSignals #BinanceSquare
情報源:ユーザーがバイナンス上で共有したコンテンツ
1
167
·
--
ブリッシュ
$BNB は$596.07付近で鍵となるローカル抵抗を押しながら、24.02K BNBの急激な1h出来高急増の後に動いています。市場構造は、買い手が上方の流動性を吸収して、$602.93の24時間高値に向けた拡大テストを行おうとしていることを示しています。
$597.00を上回る、クリーンな1hローソク足の終値を待ってから、ローカル高値方向への継続を確認してください。
方向性セットアップ:強気のブレイクアウト
条件:$597.00を上回る1h終値かつ継続的な買い出来高
エントリーゾーン:$594.00〜$597.00
テイクプロフィット1:$603.00
テイクプロフィット2:$612.00
損切り(無効化):$587.50
この$BNB のブレイクアウトに対してロングポジションを開きますか?それとも$603のレジスタンス近辺で利確しますか?
#bnb #cryptotrading #TradingSignal #BinanceSquare
{future}(BNBUSDT)
$BNB は$596.07付近で鍵となるローカル抵抗を押しながら、24.02K BNBの急激な1h出来高急増の後に動いています。市場構造は、買い手が上方の流動性を吸収して、$602.93の24時間高値に向けた拡大テストを行おうとしていることを示しています。
$597.00を上回る、クリーンな1hローソク足の終値を待ってから、ローカル高値方向への継続を確認してください。
方向性セットアップ:強気のブレイクアウト
条件:$597.00を上回る1h終値かつ継続的な買い出来高
エントリーゾーン:$594.00〜$597.00
テイクプロフィット1:$603.00
テイクプロフィット2:$612.00
損切り(無効化):$587.50
この$BNB のブレイクアウトに対してロングポジションを開きますか?それとも$603のレジスタンス近辺で利確しますか?
#bnb #cryptotrading #TradingSignal #BinanceSquare
$597.00を上回る、クリーンな1hローソク足の終値を待ってから、ローカル高値方向への継続を確認してください。
方向性セットアップ:強気のブレイクアウト
条件:$597.00を上回る1h終値かつ継続的な買い出来高
エントリーゾーン:$594.00〜$597.00
テイクプロフィット1:$603.00
テイクプロフィット2:$612.00
損切り(無効化):$587.50
この$BNB のブレイクアウトに対してロングポジションを開きますか?それとも$603のレジスタンス近辺で利確しますか?
#bnb #cryptotrading #TradingSignal #BinanceSquare
1
1
21
$BANK has生成した巨大なボリューム・インパルスにより、そのローカルなベースラインから強いモメンタム拡大が加速されています。
{future}(BANKUSDT)
現在、BANK/USDTパーペチュアルで$0.05141と評価されており、16.95%上昇。価格は24時間安値の$0.03680から拡大し、$0.06186付近でレジスタンスに遭遇するまで上昇しました。取引量は$467.38Mに急増しており、ヘビーな機関投資家または投機筋のポジショニングを反映しています。
構造的なブレイクアウトは明確ですが、$0.06186をテストした後、アセットは統合(コンソリデーション)フェーズに入っています。主要なブレイクアウト水準である$0.04800より上を維持することが、全面的な押し戻し(リトレース)を防ぐうえで重要です。押し目で$0.04800が維持されるなら、買い手は$0.06000プラスの領域を再度テストしに行く可能性があります。
$0.04800の上で安定化するかどうかを見て、セカンダリー(次の)エントリーの可能性を判断しましょう。この水準を下抜けると、下方のレンジ下限へ急速に戻るサインとなります
$BANK has生成した巨大なボリューム・インパルスにより、そのローカルなベースラインから強いモメンタム拡大が加速されています。
現在、BANK/USDTパーペチュアルで$0.05141と評価されており、16.95%上昇。価格は24時間安値の$0.03680から拡大し、$0.06186付近でレジスタンスに遭遇するまで上昇しました。取引量は$467.38Mに急増しており、ヘビーな機関投資家または投機筋のポジショニングを反映しています。
構造的なブレイクアウトは明確ですが、$0.06186をテストした後、アセットは統合(コンソリデーション)フェーズに入っています。主要なブレイクアウト水準である$0.04800より上を維持することが、全面的な押し戻し(リトレース)を防ぐうえで重要です。押し目で$0.04800が維持されるなら、買い手は$0.06000プラスの領域を再度テストしに行く可能性があります。
$0.04800の上で安定化するかどうかを見て、セカンダリー(次の)エントリーの可能性を判断しましょう。この水準を下抜けると、下方のレンジ下限へ急速に戻るサインとなります
現在、BANK/USDTパーペチュアルで$0.05141と評価されており、16.95%上昇。価格は24時間安値の$0.03680から拡大し、$0.06186付近でレジスタンスに遭遇するまで上昇しました。取引量は$467.38Mに急増しており、ヘビーな機関投資家または投機筋のポジショニングを反映しています。
構造的なブレイクアウトは明確ですが、$0.06186をテストした後、アセットは統合(コンソリデーション)フェーズに入っています。主要なブレイクアウト水準である$0.04800より上を維持することが、全面的な押し戻し(リトレース)を防ぐうえで重要です。押し目で$0.04800が維持されるなら、買い手は$0.06000プラスの領域を再度テストしに行く可能性があります。
$0.04800の上で安定化するかどうかを見て、セカンダリー(次の)エントリーの可能性を判断しましょう。この水準を下抜けると、下方のレンジ下限へ急速に戻るサインとなります
1
150
·
--
ブリッシュ
$BTC は、主要な需要の上でマクロ的な調整レンジを維持しており、出来高が主要な構造的サポート上で安定するにつれて買い手が売り圧を吸収しています。
BTC/USDTで$64,010付近で取引されており、価格アクションは直近の日足レジスタンスの下で狭いレンジ内に収束しています。浅い押し目は活発な現物の積み増しを示唆しますが、上方向のオーバーヘッド目標に向けたボラティリティ拡大を確認するには、$64,500を上回る4時間足での決定的な終値が必要です。
{future}(BTCUSDT)
• 想定方向:レンジ拡大
• 条件:$64,500を上回るクリーンな4時間足終値
• エントリーゾーン:$63,600 – $64,100
• 利確1:$65,200
• 利確2:$66,400
• 損切り(無効条件):$63,100
ここでローカルのサポートゾーンに買いを入れますか?それとも$64,500のブレイク確認を待ちますか?
下にあなたのプランをどうぞ!
#BTC #Bitcoin #CryptoSignals #TradingAnalysis
$BTC は、主要な需要の上でマクロ的な調整レンジを維持しており、出来高が主要な構造的サポート上で安定するにつれて買い手が売り圧を吸収しています。
BTC/USDTで$64,010付近で取引されており、価格アクションは直近の日足レジスタンスの下で狭いレンジ内に収束しています。浅い押し目は活発な現物の積み増しを示唆しますが、上方向のオーバーヘッド目標に向けたボラティリティ拡大を確認するには、$64,500を上回る4時間足での決定的な終値が必要です。
• 想定方向:レンジ拡大
• 条件:$64,500を上回るクリーンな4時間足終値
• エントリーゾーン:$63,600 – $64,100
• 利確1:$65,200
• 利確2:$66,400
• 損切り(無効条件):$63,100
ここでローカルのサポートゾーンに買いを入れますか?それとも$64,500のブレイク確認を待ちますか?
下にあなたのプランをどうぞ!
#BTC #Bitcoin #CryptoSignals #TradingAnalysis
BTC/USDTで$64,010付近で取引されており、価格アクションは直近の日足レジスタンスの下で狭いレンジ内に収束しています。浅い押し目は活発な現物の積み増しを示唆しますが、上方向のオーバーヘッド目標に向けたボラティリティ拡大を確認するには、$64,500を上回る4時間足での決定的な終値が必要です。
• 想定方向:レンジ拡大
• 条件:$64,500を上回るクリーンな4時間足終値
• エントリーゾーン:$63,600 – $64,100
• 利確1:$65,200
• 利確2:$66,400
• 損切り(無効条件):$63,100
ここでローカルのサポートゾーンに買いを入れますか?それとも$64,500のブレイク確認を待ちますか?
下にあなたのプランをどうぞ!
#BTC #Bitcoin #CryptoSignals #TradingAnalysis
1
18
$SOL は、主要な日足レジスタンスの直下で安定したボックス型の整理(コンソリデーション)構造を維持しており、健全な出来高(コントラクトボリューム)を背景に買い手が局所的なサポートを防衛しています。
SOL/USDTで価格は$73.83付近で推移しており、$72.80の需要ゾーンの上でタイトな圧縮チャネル内にコイル状に収束しています。浅い押し戻しと安定したオンチェーン活動は、分配ではなく積極的な蓄積を示唆しています。勢い(モメンタム)の拡大を上方のレジスタンス帯まで確認するには、$74.50を上回る決定的な4時間足の終値が必要です。
{future}(SOLUSDT)
バイアス:強気ブレイクアウト • 条件:$74.50を上回るクリーンな4時間足の終値 • エントリーゾーン:$73.20 – $74.00 • 利確1:$76.80 • 利確2:$79.50 • 想定破棄(ストップロス):$71.80
あなたは$74.50のブレイクアウトを買いますか?それとも$72.80付近の下側サポートに指値で待ちますか?下にプランを投稿してください。
#SOL #Solana #CryptoSignals #TradingAnalysis
$SOL は、主要な日足レジスタンスの直下で安定したボックス型の整理(コンソリデーション)構造を維持しており、健全な出来高(コントラクトボリューム)を背景に買い手が局所的なサポートを防衛しています。
SOL/USDTで価格は$73.83付近で推移しており、$72.80の需要ゾーンの上でタイトな圧縮チャネル内にコイル状に収束しています。浅い押し戻しと安定したオンチェーン活動は、分配ではなく積極的な蓄積を示唆しています。勢い(モメンタム)の拡大を上方のレジスタンス帯まで確認するには、$74.50を上回る決定的な4時間足の終値が必要です。
バイアス:強気ブレイクアウト • 条件:$74.50を上回るクリーンな4時間足の終値 • エントリーゾーン:$73.20 – $74.00 • 利確1:$76.80 • 利確2:$79.50 • 想定破棄(ストップロス):$71.80
あなたは$74.50のブレイクアウトを買いますか?それとも$72.80付近の下側サポートに指値で待ちますか?下にプランを投稿してください。
#SOL #Solana #CryptoSignals #TradingAnalysis
SOL/USDTで価格は$73.83付近で推移しており、$72.80の需要ゾーンの上でタイトな圧縮チャネル内にコイル状に収束しています。浅い押し戻しと安定したオンチェーン活動は、分配ではなく積極的な蓄積を示唆しています。勢い(モメンタム)の拡大を上方のレジスタンス帯まで確認するには、$74.50を上回る決定的な4時間足の終値が必要です。
バイアス:強気ブレイクアウト • 条件:$74.50を上回るクリーンな4時間足の終値 • エントリーゾーン:$73.20 – $74.00 • 利確1:$76.80 • 利確2:$79.50 • 想定破棄(ストップロス):$71.80
あなたは$74.50のブレイクアウトを買いますか?それとも$72.80付近の下側サポートに指値で待ちますか?下にプランを投稿してください。
#SOL #Solana #CryptoSignals #TradingAnalysis
30
$SOL / SOLUSDT
ソラナは、$73.02 から $74.44 の間にあるタイトな24時間のレンジ内に収まっています。出来高は $939M とまずまずですが、価格は本当の方向性を示すトリガー待ちの状態です。資本を投入する前に、市場がレンジをブレイクするのを待ちましょう。
{future}(SOLUSDT)
見通し: レンジ拡大
重要水準: $74.50 を上回っての受容
エントリーエリア: $74.00 ~ $74.50
目標: $76.80 | $78.50
無効化: $72.80
$SOL / SOLUSDT
ソラナは、$73.02 から $74.44 の間にあるタイトな24時間のレンジ内に収まっています。出来高は $939M とまずまずですが、価格は本当の方向性を示すトリガー待ちの状態です。資本を投入する前に、市場がレンジをブレイクするのを待ちましょう。
見通し: レンジ拡大
重要水準: $74.50 を上回っての受容
エントリーエリア: $74.00 ~ $74.50
目標: $76.80 | $78.50
無効化: $72.80
ソラナは、$73.02 から $74.44 の間にあるタイトな24時間のレンジ内に収まっています。出来高は $939M とまずまずですが、価格は本当の方向性を示すトリガー待ちの状態です。資本を投入する前に、市場がレンジをブレイクするのを待ちましょう。
見通し: レンジ拡大
重要水準: $74.50 を上回っての受容
エントリーエリア: $74.00 ~ $74.50
目標: $76.80 | $78.50
無効化: $72.80
21
$ETH イーサリアムは、24時間の出来高$5.31Bで、$1,881.72付近のローカル・レジスタンスに押し寄せています。買い手は押し目を浅く保っていますが、モメンタムは依然として慎重です。高い出来高のローソク足が上方の流動性をクリアするまで、エクスポージャーを取るのを待っています。
{future}(ETHUSDT)
ETHUSDT
バイアス:条件付きの強気
重要水準:$1,882を超えて維持
エントリーエリア:$1,875 – $1,882
ターゲット:$1,920 | $1,960
無効ライン:$1,845
$ETH イーサリアムは、24時間の出来高$5.31Bで、$1,881.72付近のローカル・レジスタンスに押し寄せています。買い手は押し目を浅く保っていますが、モメンタムは依然として慎重です。高い出来高のローソク足が上方の流動性をクリアするまで、エクスポージャーを取るのを待っています。
ETHUSDT
バイアス:条件付きの強気
重要水準:$1,882を超えて維持
エントリーエリア:$1,875 – $1,882
ターゲット:$1,920 | $1,960
無効ライン:$1,845
ETHUSDT
バイアス:条件付きの強気
重要水準:$1,882を超えて維持
エントリーエリア:$1,875 – $1,882
ターゲット:$1,920 | $1,960
無効ライン:$1,845
ログインして、さらにコンテンツを読む
厳選トピックで世界の暗号資産トレーダーの仲間入り
⚡️ 暗号資産に関する最新かつ有益な情報が見つかります。
💬 世界最大の暗号資産取引所から信頼されています。
👍 認証を受けたクリエイターから、有益なインサイトを得られます。
メール / 電話番号
トレンドトピック
SaylorHintsStrategyBitcoinBuy
閲覧回数 2.2M
11,188人が討論中
#SaylorHintsStrategyBitcoinBuy
🚀 マイケル・セイラーが戦略の次の巨大ビットコイン・ムーブを示唆!🧡
マイケル・セイラーがXでまたしても“おなじみの”暗号めいたヒントを投下したことで、クリプト市場がざわついています!戦略の象徴的なトレジャリー・チャートを投稿し、そこに添えたのはわずか3語だけ。「もう少しオレンジを」。📊⚡
投資家たちはそれが何を意味するか知っています――オレンジ色のドットは、新たな$BTC の買収(acquisitions)を示すのです!短い間を置いたあと、株式の自社買い(share buybacks)に焦点を当てたことから、戦略は巨大な845,050 BTCの保有にさらに追加しそうです。
すでに保有額は数十億ドル規模。トレーダーはSECの開示を注意深く見ています。セイラーは今週、さらに“メガ買い”でインターネットを揺らすのでしょうか?💸📈
#Strategy #bitcoin #Saylor 💎🙌
#Nadeemgujjar143
@A锦源 @Andy-加密不落客 @marya adenya @aasho
$BTC
$BNB
NADEEM Gujjar143
·いいね:0件
·閲覧回数 17
BOJRaisesRatesTo31YearHigh
閲覧回数 171,174
2,571人が討論中
BuffettStepsDownAsBerkshireChairman
閲覧回数 82,651
1,324人が討論中