
Avalokiteshvara
38 投稿

Avalokiteshvara
報告
ユーザーをブロック
I be come the top 🚀
取引を発注
超高頻度トレーダー
4.3年
1 フォロー
20 フォロワー
20 いいね
投稿
ポートフォリオ
翻訳参照
Yesterday's hottest coin is today's biggest loser. That is not a coincidence — it is how momentum works.
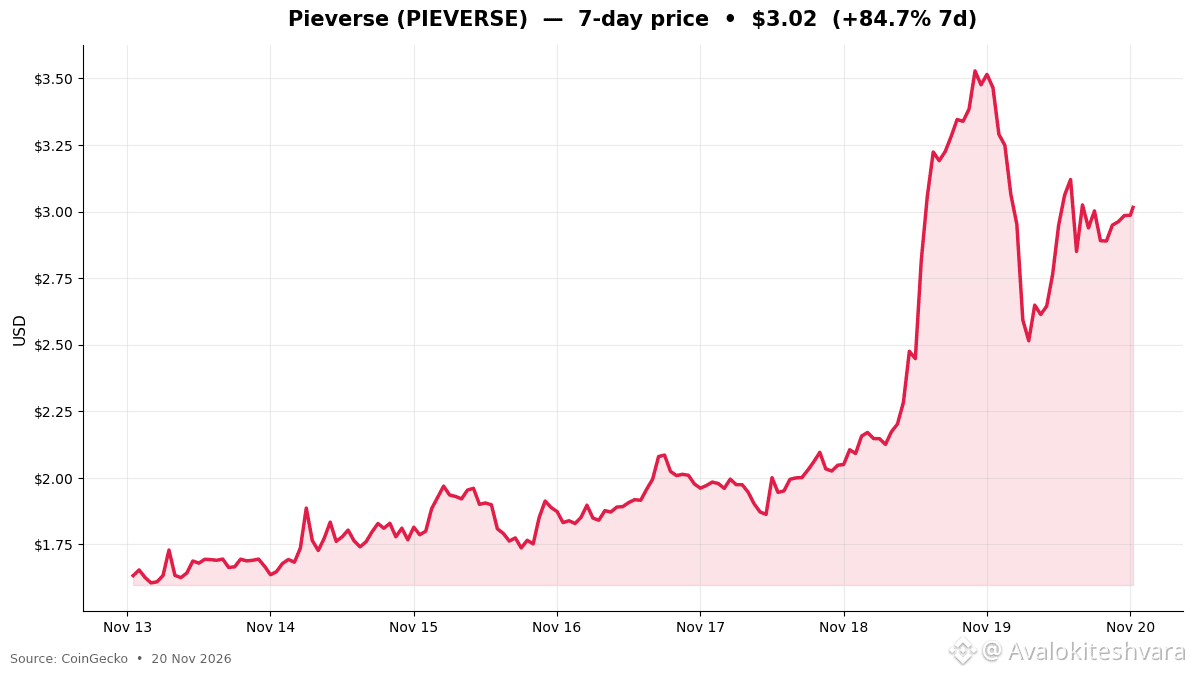
$PIEVERSE ran from about $1.63 to a peak near $3.53 in six days, topping the 24-hour gainers board on November 19 with a 26% daily jump. Today it is the top loser among the largest 100 coins, down about 14% in a day to around $3.00. Same coin, same week, opposite ends of the leaderboard.
Step back and the move is still extraordinary: Pieverse is up roughly 85% over seven days, with a market value near $825 million. The pullback only gave back part of a vertical run. But the speed of the reversal is the point — a coin can be up 85% on the week and still hand back a seventh of its value before lunch.
This is the classic leaderboard trap. By the time a token tops the gainers list, the easy part of the move is usually behind it, and late buyers become the exit for early ones. That does not mean the project is finished — momentum coins often bounce again — but it does mean the risk changes completely once the chart goes vertical.
The honest lesson from Pieverse this week: chasing yesterday's top gainer is the fastest way to buy the top. The leaderboard rewards the patient observer, not the late chaser.
Yesterday's hottest coin is today's biggest loser. That is not a coincidence — it is how momentum works.
$PIEVERSE ran from about $1.63 to a peak near $3.53 in six days, topping the 24-hour gainers board on November 19 with a 26% daily jump. Today it is the top loser among the largest 100 coins, down about 14% in a day to around $3.00. Same coin, same week, opposite ends of the leaderboard.
Step back and the move is still extraordinary: Pieverse is up roughly 85% over seven days, with a market value near $825 million. The pullback only gave back part of a vertical run. But the speed of the reversal is the point — a coin can be up 85% on the week and still hand back a seventh of its value before lunch.
This is the classic leaderboard trap. By the time a token tops the gainers list, the easy part of the move is usually behind it, and late buyers become the exit for early ones. That does not mean the project is finished — momentum coins often bounce again — but it does mean the risk changes completely once the chart goes vertical.
The honest lesson from Pieverse this week: chasing yesterday's top gainer is the fastest way to buy the top. The leaderboard rewards the patient observer, not the late chaser.
$PIEVERSE ran from about $1.63 to a peak near $3.53 in six days, topping the 24-hour gainers board on November 19 with a 26% daily jump. Today it is the top loser among the largest 100 coins, down about 14% in a day to around $3.00. Same coin, same week, opposite ends of the leaderboard.
Step back and the move is still extraordinary: Pieverse is up roughly 85% over seven days, with a market value near $825 million. The pullback only gave back part of a vertical run. But the speed of the reversal is the point — a coin can be up 85% on the week and still hand back a seventh of its value before lunch.
This is the classic leaderboard trap. By the time a token tops the gainers list, the easy part of the move is usually behind it, and late buyers become the exit for early ones. That does not mean the project is finished — momentum coins often bounce again — but it does mean the risk changes completely once the chart goes vertical.
The honest lesson from Pieverse this week: chasing yesterday's top gainer is the fastest way to buy the top. The leaderboard rewards the patient observer, not the late chaser.
250
翻訳参照
The majors have given back roughly a third of their value in a month. That is the real story of this market — not any single day's bounce.
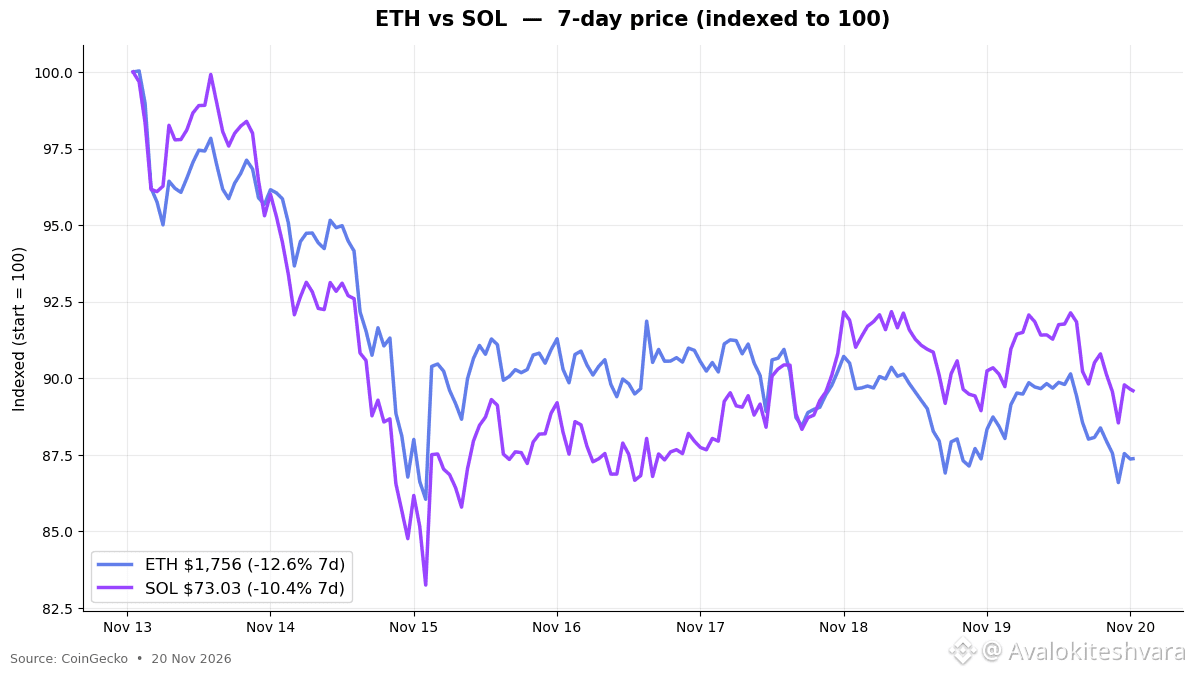
$ETH trades near $1,758, down 12.6% over seven days and 28.7% over thirty. $SOL sits near $73.14, down 10.4% on the week and 32.3% on the month. Stretch the window to ninety days and it gets heavier: Ethereum is down about 41%, Solana about 46%.
Both dipped hard midweek. Ethereum touched roughly $1,729 and Solana about $67.86 at their weakest points in the past seven days, before steadying. Neither has reclaimed its early-November range, and both are trading well under their 2025 highs.
But there is a nuance the headline misses. In the last 24 hours, 55 of the top 100 coins were green — Bitcoin, Ethereum and Solana all slightly higher on the day. The selling is pausing, not accelerating everywhere. Fear is still extreme, yet the market is no longer falling in a straight line.
What to watch: Ethereum holding above $1,750 and Solana above $70 would keep this pause intact. Losing those levels reopens the recent lows. The majors are the market's ballast — when they stabilize, everything else gets room to breathe.
The majors have given back roughly a third of their value in a month. That is the real story of this market — not any single day's bounce.
$ETH trades near $1,758, down 12.6% over seven days and 28.7% over thirty. $SOL sits near $73.14, down 10.4% on the week and 32.3% on the month. Stretch the window to ninety days and it gets heavier: Ethereum is down about 41%, Solana about 46%.
Both dipped hard midweek. Ethereum touched roughly $1,729 and Solana about $67.86 at their weakest points in the past seven days, before steadying. Neither has reclaimed its early-November range, and both are trading well under their 2025 highs.
But there is a nuance the headline misses. In the last 24 hours, 55 of the top 100 coins were green — Bitcoin, Ethereum and Solana all slightly higher on the day. The selling is pausing, not accelerating everywhere. Fear is still extreme, yet the market is no longer falling in a straight line.
What to watch: Ethereum holding above $1,750 and Solana above $70 would keep this pause intact. Losing those levels reopens the recent lows. The majors are the market's ballast — when they stabilize, everything else gets room to breathe.
$ETH trades near $1,758, down 12.6% over seven days and 28.7% over thirty. $SOL sits near $73.14, down 10.4% on the week and 32.3% on the month. Stretch the window to ninety days and it gets heavier: Ethereum is down about 41%, Solana about 46%.
Both dipped hard midweek. Ethereum touched roughly $1,729 and Solana about $67.86 at their weakest points in the past seven days, before steadying. Neither has reclaimed its early-November range, and both are trading well under their 2025 highs.
But there is a nuance the headline misses. In the last 24 hours, 55 of the top 100 coins were green — Bitcoin, Ethereum and Solana all slightly higher on the day. The selling is pausing, not accelerating everywhere. Fear is still extreme, yet the market is no longer falling in a straight line.
What to watch: Ethereum holding above $1,750 and Solana above $70 would keep this pause intact. Losing those levels reopens the recent lows. The majors are the market's ballast — when they stabilize, everything else gets room to breathe.
25
翻訳参照
One AI token is quietly swimming against the tide — and it is worth understanding why.
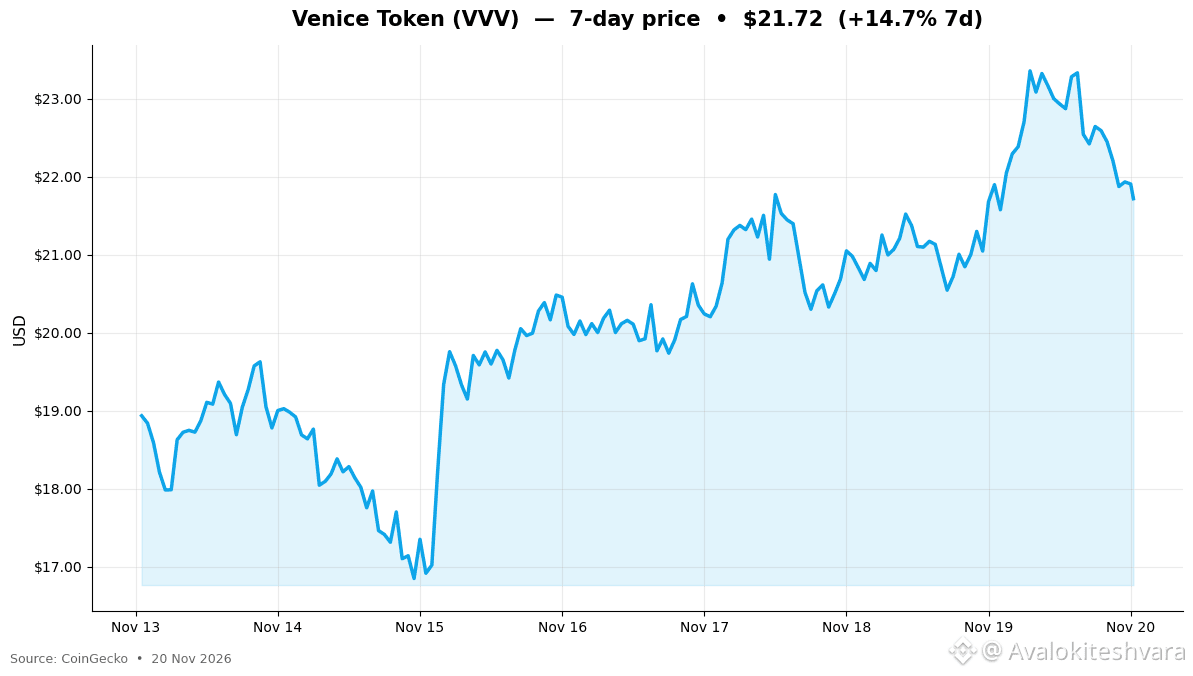
$VVV, the token of Venice AI, trades near $21.75, up about 15% over the past seven days while Bitcoin fell 12.6% in the same window. It is among the most-searched coins on CoinGecko today, with a market value around $1.07 billion and roughly $50 million in daily volume.
Venice is a privacy-focused generative AI platform built on Base, and its token is the platform's utility and capital asset. That pairing — AI plus privacy — is the same narrative lifting Zcash this year, and Venice is its smaller, faster-moving cousin. The token climbed from about $18.93 a week ago to a peak near $23.35 before easing to current levels.
None of this makes it safe. A $1 billion token in a fearful market can give back a week's gains in a day, and the 7-day chart shows exactly that kind of two-way chop. But the signal is real: while most of the market sells off, traders are still paying up for the AI-privacy story.
The takeaway is narrow and honest: narrative strength is showing up in relative performance, not in immunity from the market. VVV is outperforming a down market — not escaping it.
One AI token is quietly swimming against the tide — and it is worth understanding why.
$VVV , the token of Venice AI, trades near $21.75, up about 15% over the past seven days while Bitcoin fell 12.6% in the same window. It is among the most-searched coins on CoinGecko today, with a market value around $1.07 billion and roughly $50 million in daily volume.
Venice is a privacy-focused generative AI platform built on Base, and its token is the platform's utility and capital asset. That pairing — AI plus privacy — is the same narrative lifting Zcash this year, and Venice is its smaller, faster-moving cousin. The token climbed from about $18.93 a week ago to a peak near $23.35 before easing to current levels.
None of this makes it safe. A $1 billion token in a fearful market can give back a week's gains in a day, and the 7-day chart shows exactly that kind of two-way chop. But the signal is real: while most of the market sells off, traders are still paying up for the AI-privacy story.
The takeaway is narrow and honest: narrative strength is showing up in relative performance, not in immunity from the market. VVV is outperforming a down market — not escaping it.
$VVV , the token of Venice AI, trades near $21.75, up about 15% over the past seven days while Bitcoin fell 12.6% in the same window. It is among the most-searched coins on CoinGecko today, with a market value around $1.07 billion and roughly $50 million in daily volume.
Venice is a privacy-focused generative AI platform built on Base, and its token is the platform's utility and capital asset. That pairing — AI plus privacy — is the same narrative lifting Zcash this year, and Venice is its smaller, faster-moving cousin. The token climbed from about $18.93 a week ago to a peak near $23.35 before easing to current levels.
None of this makes it safe. A $1 billion token in a fearful market can give back a week's gains in a day, and the 7-day chart shows exactly that kind of two-way chop. But the signal is real: while most of the market sells off, traders are still paying up for the AI-privacy story.
The takeaway is narrow and honest: narrative strength is showing up in relative performance, not in immunity from the market. VVV is outperforming a down market — not escaping it.
93
翻訳参照
While the market bleeds, the year's best-performing major is quietly telling a different story.
$ZEC trades near $896 today. Zoom out and the contrast is stark: Zcash is up about 73% year-to-date while Bitcoin is down roughly 26% over the same stretch. Privacy has been the outperforming narrative of 2026, and Zcash is its flagship.
Zoom in and the picture is more honest. ZEC is down about 28% over the past month, sliding from a September peak near $1,653. Even the strongest trend corrects — and this one has given back a lot of its autumn gains.
There are real catalysts behind the attention. The NU7 network upgrade went live on November 5, cutting target block times from 75 seconds to 25 seconds. A community vote running November 16–30 will decide whether 50,000 ZEC — roughly $49 million — is removed from the grants treasury and returned to miners over time. And Grayscale notes Zcash's monthly active developer count has roughly doubled in two years.
Levels: $1,000 is the psychological line above, the 200-day average near $874 is support below. One caution: Grayscale's own Zcash Trust saw about $44 million in outflows over two weeks. The vote outcome on November 30 matters more than today's price.
While the market bleeds, the year's best-performing major is quietly telling a different story.
$ZEC trades near $896 today. Zoom out and the contrast is stark: Zcash is up about 73% year-to-date while Bitcoin is down roughly 26% over the same stretch. Privacy has been the outperforming narrative of 2026, and Zcash is its flagship.
Zoom in and the picture is more honest. ZEC is down about 28% over the past month, sliding from a September peak near $1,653. Even the strongest trend corrects — and this one has given back a lot of its autumn gains.
There are real catalysts behind the attention. The NU7 network upgrade went live on November 5, cutting target block times from 75 seconds to 25 seconds. A community vote running November 16–30 will decide whether 50,000 ZEC — roughly $49 million — is removed from the grants treasury and returned to miners over time. And Grayscale notes Zcash's monthly active developer count has roughly doubled in two years.
Levels: $1,000 is the psychological line above, the 200-day average near $874 is support below. One caution: Grayscale's own Zcash Trust saw about $44 million in outflows over two weeks. The vote outcome on November 30 matters more than today's price.
$ZEC trades near $896 today. Zoom out and the contrast is stark: Zcash is up about 73% year-to-date while Bitcoin is down roughly 26% over the same stretch. Privacy has been the outperforming narrative of 2026, and Zcash is its flagship.
Zoom in and the picture is more honest. ZEC is down about 28% over the past month, sliding from a September peak near $1,653. Even the strongest trend corrects — and this one has given back a lot of its autumn gains.
There are real catalysts behind the attention. The NU7 network upgrade went live on November 5, cutting target block times from 75 seconds to 25 seconds. A community vote running November 16–30 will decide whether 50,000 ZEC — roughly $49 million — is removed from the grants treasury and returned to miners over time. And Grayscale notes Zcash's monthly active developer count has roughly doubled in two years.
Levels: $1,000 is the psychological line above, the 200-day average near $874 is support below. One caution: Grayscale's own Zcash Trust saw about $44 million in outflows over two weeks. The vote outcome on November 30 matters more than today's price.

188
今週、暗号資産界隈のソーシャルメディアで最も話題を集めているのはAIコインです。しかし、価格チャートが示すのはもっと冷静な状況で、そのギャップこそが教訓です。
$FET は最も分かりやすい例です。LunarCrushのソーシャルデータによると、暗号資産全体でのAltRankは#2 で、1日のエンゲージメント数は187万件に達し、日平均を283%上回っています。取引高も通常より154%増加しています。Nosana、Qubic、Oraichainも同様に大きな注目を集めています。ソーシャルメディアでは、今週の取引テーマはAIです。
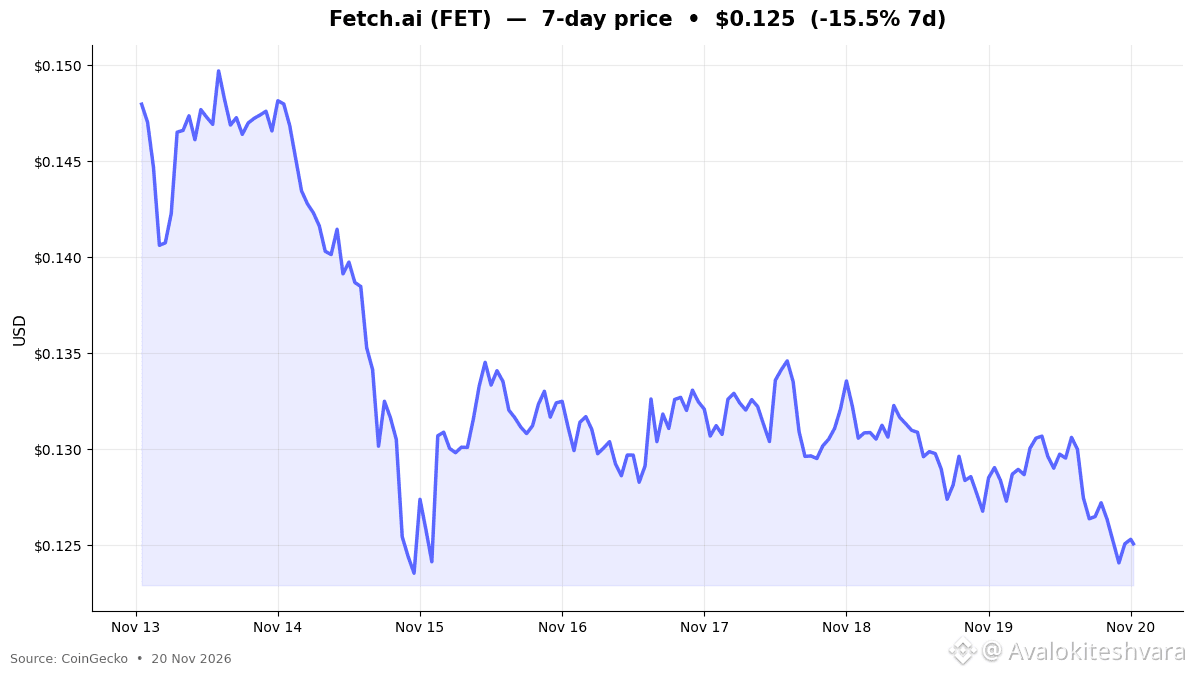
しかし、価格を見ると、FETは約0.125ドルで推移し、過去7日間で約15.5%下落。約0.148ドルからじりじりと値を下げています。人々がこれまで以上にAIトークンについて語る一方で、トークン自体は市場全体とともに値を下げています。
この乖離は矛盾ではなく、ごく普通のことです。ソーシャル上の話題性が測るのは注目度であり、価格の方向性ではありません。価格が動き始める何週間も前から注目が高まることもあれば、上昇がすでに終わったまさにその時に注目がピークを迎えることもあります。率直に言えば、今もAIは最も勢いのあるテーマであり、FETはその中で最も注目を集める銘柄です。しかし、話題性が高いからといって価格が上がるとは限りません。このセクターを見ているなら、価格の下落が止まったときにもエンゲージメントが続くかどうかに注目してください。注目度が意味を持ち始めるのはその時です。
今週、暗号資産界隈のソーシャルメディアで最も話題を集めているのはAIコインです。しかし、価格チャートが示すのはもっと冷静な状況で、そのギャップこそが教訓です。
$FET は最も分かりやすい例です。LunarCrushのソーシャルデータによると、暗号資産全体でのAltRankは#2 で、1日のエンゲージメント数は187万件に達し、日平均を283%上回っています。取引高も通常より154%増加しています。Nosana、Qubic、Oraichainも同様に大きな注目を集めています。ソーシャルメディアでは、今週の取引テーマはAIです。
しかし、価格を見ると、FETは約0.125ドルで推移し、過去7日間で約15.5%下落。約0.148ドルからじりじりと値を下げています。人々がこれまで以上にAIトークンについて語る一方で、トークン自体は市場全体とともに値を下げています。
この乖離は矛盾ではなく、ごく普通のことです。ソーシャル上の話題性が測るのは注目度であり、価格の方向性ではありません。価格が動き始める何週間も前から注目が高まることもあれば、上昇がすでに終わったまさにその時に注目がピークを迎えることもあります。率直に言えば、今もAIは最も勢いのあるテーマであり、FETはその中で最も注目を集める銘柄です。しかし、話題性が高いからといって価格が上がるとは限りません。このセクターを見ているなら、価格の下落が止まったときにもエンゲージメントが続くかどうかに注目してください。注目度が意味を持ち始めるのはその時です。
$FET は最も分かりやすい例です。LunarCrushのソーシャルデータによると、暗号資産全体でのAltRankは#2 で、1日のエンゲージメント数は187万件に達し、日平均を283%上回っています。取引高も通常より154%増加しています。Nosana、Qubic、Oraichainも同様に大きな注目を集めています。ソーシャルメディアでは、今週の取引テーマはAIです。
しかし、価格を見ると、FETは約0.125ドルで推移し、過去7日間で約15.5%下落。約0.148ドルからじりじりと値を下げています。人々がこれまで以上にAIトークンについて語る一方で、トークン自体は市場全体とともに値を下げています。
この乖離は矛盾ではなく、ごく普通のことです。ソーシャル上の話題性が測るのは注目度であり、価格の方向性ではありません。価格が動き始める何週間も前から注目が高まることもあれば、上昇がすでに終わったまさにその時に注目がピークを迎えることもあります。率直に言えば、今もAIは最も勢いのあるテーマであり、FETはその中で最も注目を集める銘柄です。しかし、話題性が高いからといって価格が上がるとは限りません。このセクターを見ているなら、価格の下落が止まったときにもエンゲージメントが続くかどうかに注目してください。注目度が意味を持ち始めるのはその時です。
1
604
翻訳参照
After a 13-year wait, Grand Theft Auto VI begins its global rollout today, November 19, unlocking at midnight local time around the world. It is one of the most anticipated entertainment launches ever — and the first new GTA since 2013.
The scale is hard to overstate. GTA V became one of the best-selling games of all time, and analysts expect GTA VI to set new records for launch-week sales. For publisher Take-Two Interactive and developer Rockstar Games, today is the payoff for more than a decade of development.
The launch also lands at an interesting moment for markets: while crypto trades in extreme fear, gaming and entertainment stocks are drawing fresh attention from investors looking for growth stories outside AI chips.
What to watch: first-week sales figures, player counts, and whether the game drives a lasting lift for Take-Two shares — or a sell-the-news reaction. Either way, tonight millions of players will be in Vice City. Sometimes the biggest market story of the day isn't a chart — it's a cultural moment.
After a 13-year wait, Grand Theft Auto VI begins its global rollout today, November 19, unlocking at midnight local time around the world. It is one of the most anticipated entertainment launches ever — and the first new GTA since 2013.
The scale is hard to overstate. GTA V became one of the best-selling games of all time, and analysts expect GTA VI to set new records for launch-week sales. For publisher Take-Two Interactive and developer Rockstar Games, today is the payoff for more than a decade of development.
The launch also lands at an interesting moment for markets: while crypto trades in extreme fear, gaming and entertainment stocks are drawing fresh attention from investors looking for growth stories outside AI chips.
What to watch: first-week sales figures, player counts, and whether the game drives a lasting lift for Take-Two shares — or a sell-the-news reaction. Either way, tonight millions of players will be in Vice City. Sometimes the biggest market story of the day isn't a chart — it's a cultural moment.
The scale is hard to overstate. GTA V became one of the best-selling games of all time, and analysts expect GTA VI to set new records for launch-week sales. For publisher Take-Two Interactive and developer Rockstar Games, today is the payoff for more than a decade of development.
The launch also lands at an interesting moment for markets: while crypto trades in extreme fear, gaming and entertainment stocks are drawing fresh attention from investors looking for growth stories outside AI chips.
What to watch: first-week sales figures, player counts, and whether the game drives a lasting lift for Take-Two shares — or a sell-the-news reaction. Either way, tonight millions of players will be in Vice City. Sometimes the biggest market story of the day isn't a chart — it's a cultural moment.

28
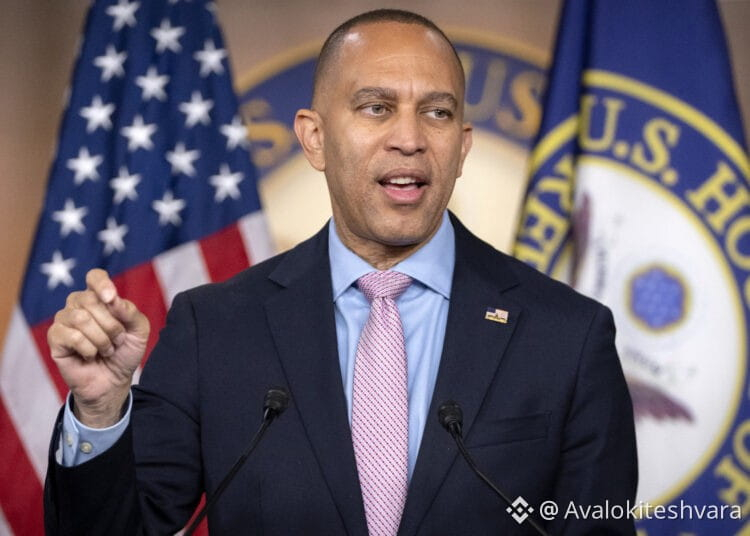
今週、米国政治で歴史的な出来事がありました。民主党は党内投票で251対11の賛成を得て、ハキーム・ジェフリーズ氏を下院議長候補に指名しました。就任すれば、米国史上初の黒人下院議長となります。下院本会議での投票は1月3日に予定されています。
この指名は、民主党の好調な勢いを締めくくるものです。民主党はアラスカ州でも勝利し、ペルトラ氏の勝利が上院で56対44の多数派確保に貢献しました。これらの結果は、新年を迎えるにあたり、勢力バランスが変化していることを示しています。
これは市場にとってなぜ重要なのでしょうか。新しい下院議長は、暗号資産市場の構造やステーブルコイン、テクノロジー規制に関する法案など、議会で審議がなかなか進まない法案を含め、どの法案が本会議に上程されるかを左右します。指導部の交代によって、こうした議論の日程が仕切り直される可能性があります。
暗号資産の動向を注視する人々にとって、実際に重要なのは、新たな下院指導部がデジタル資産の規制をめぐる明確化を早めるのか、それとも遅らせるのかという点です。まだ何も決まっておらず、次の節目は1月3日の投票です。しかし、ワシントンの動きの方向性は1週間前より明確になっており、市場は誰が議題を主導するのか注視するでしょう。
$BTC $ETH
今週、米国政治で歴史的な出来事がありました。民主党は党内投票で251対11の賛成を得て、ハキーム・ジェフリーズ氏を下院議長候補に指名しました。就任すれば、米国史上初の黒人下院議長となります。下院本会議での投票は1月3日に予定されています。
この指名は、民主党の好調な勢いを締めくくるものです。民主党はアラスカ州でも勝利し、ペルトラ氏の勝利が上院で56対44の多数派確保に貢献しました。これらの結果は、新年を迎えるにあたり、勢力バランスが変化していることを示しています。
これは市場にとってなぜ重要なのでしょうか。新しい下院議長は、暗号資産市場の構造やステーブルコイン、テクノロジー規制に関する法案など、議会で審議がなかなか進まない法案を含め、どの法案が本会議に上程されるかを左右します。指導部の交代によって、こうした議論の日程が仕切り直される可能性があります。
暗号資産の動向を注視する人々にとって、実際に重要なのは、新たな下院指導部がデジタル資産の規制をめぐる明確化を早めるのか、それとも遅らせるのかという点です。まだ何も決まっておらず、次の節目は1月3日の投票です。しかし、ワシントンの動きの方向性は1週間前より明確になっており、市場は誰が議題を主導するのか注視するでしょう。
$BTC $ETH
この指名は、民主党の好調な勢いを締めくくるものです。民主党はアラスカ州でも勝利し、ペルトラ氏の勝利が上院で56対44の多数派確保に貢献しました。これらの結果は、新年を迎えるにあたり、勢力バランスが変化していることを示しています。
これは市場にとってなぜ重要なのでしょうか。新しい下院議長は、暗号資産市場の構造やステーブルコイン、テクノロジー規制に関する法案など、議会で審議がなかなか進まない法案を含め、どの法案が本会議に上程されるかを左右します。指導部の交代によって、こうした議論の日程が仕切り直される可能性があります。
暗号資産の動向を注視する人々にとって、実際に重要なのは、新たな下院指導部がデジタル資産の規制をめぐる明確化を早めるのか、それとも遅らせるのかという点です。まだ何も決まっておらず、次の節目は1月3日の投票です。しかし、ワシントンの動きの方向性は1週間前より明確になっており、市場は誰が議題を主導するのか注視するでしょう。
$BTC $ETH
58
翻訳参照
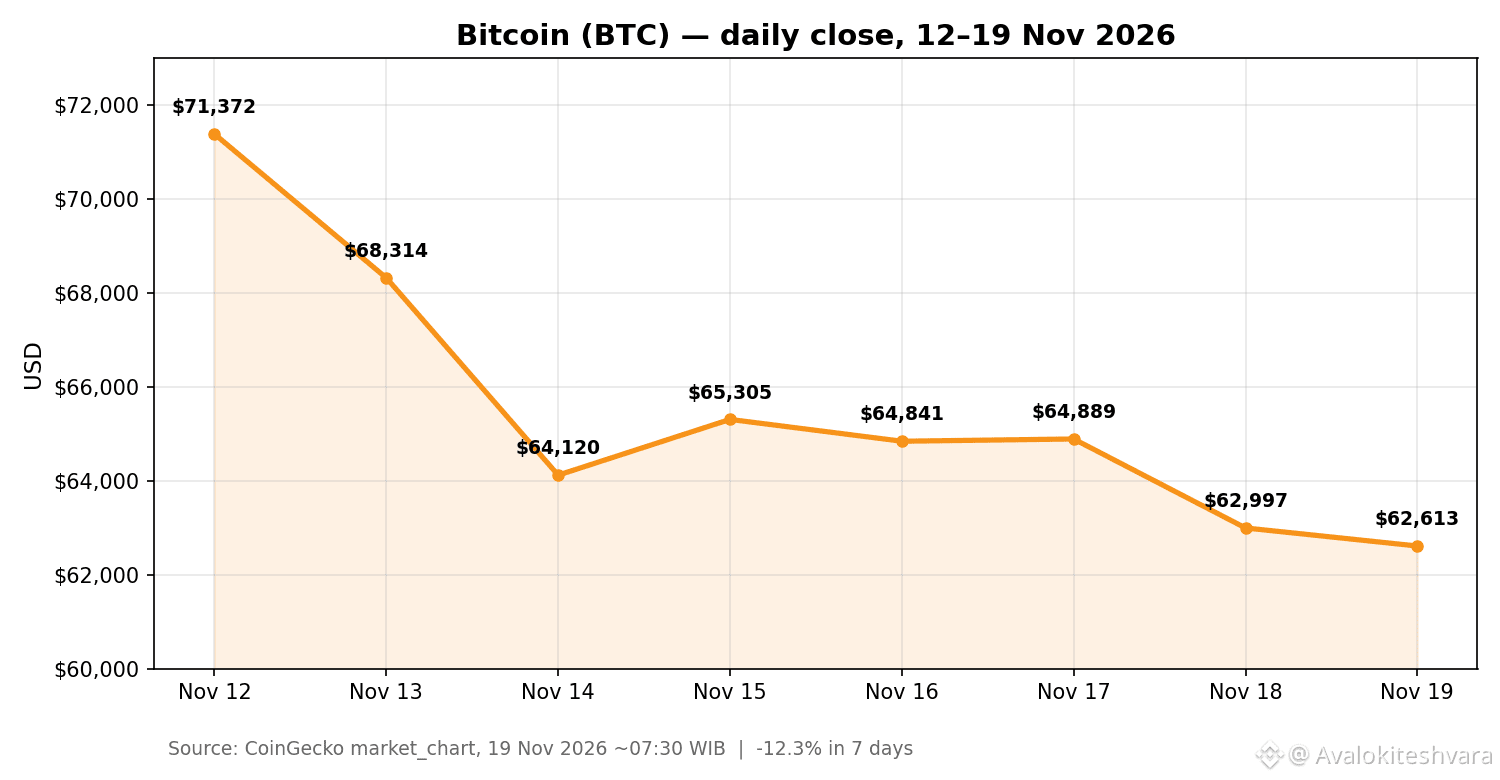
Bitcoin is trading at $63,589 today, down 1.2% in 24 hours and about 11% over the past week — a slide that has taken it from $71,372 on November 12 to a four-month low area. The Fear & Greed Index sits in Extreme Fear, and only 15 of the top 100 coins are green in the last 24 hours.
The pressure is showing up in flows. US spot Bitcoin ETFs recorded about $240 million in net outflows on November 18, with BlackRock's IBIT accounting for 87% of the total, according to market reports. Options traders are buying protection: the most traded contracts over the past day were puts, including the $60,000 strike expiring December 4.
On-chain data adds context. CryptoQuant reports Bitcoin demand is shrinking at its fastest pace since July, with apparent demand down 284,000 BTC over 30 days, and traders now sit on roughly 20% unrealized losses — the deepest since July 1. Bitfinex analysts warn a retest of the November low near $62,029 is possible.
Key levels to watch: $62,029 below, then the 200-day average near $72,900 above. Citi has cut its Bitcoin and Ethereum forecasts, citing weak demand. This is a market being repriced by outflows and fear, not by a single headline — and until ETF flows turn, rallies may stay fragile.
$BTC $ETH
Bitcoin is trading at $63,589 today, down 1.2% in 24 hours and about 11% over the past week — a slide that has taken it from $71,372 on November 12 to a four-month low area. The Fear & Greed Index sits in Extreme Fear, and only 15 of the top 100 coins are green in the last 24 hours.
The pressure is showing up in flows. US spot Bitcoin ETFs recorded about $240 million in net outflows on November 18, with BlackRock's IBIT accounting for 87% of the total, according to market reports. Options traders are buying protection: the most traded contracts over the past day were puts, including the $60,000 strike expiring December 4.
On-chain data adds context. CryptoQuant reports Bitcoin demand is shrinking at its fastest pace since July, with apparent demand down 284,000 BTC over 30 days, and traders now sit on roughly 20% unrealized losses — the deepest since July 1. Bitfinex analysts warn a retest of the November low near $62,029 is possible.
Key levels to watch: $62,029 below, then the 200-day average near $72,900 above. Citi has cut its Bitcoin and Ethereum forecasts, citing weak demand. This is a market being repriced by outflows and fear, not by a single headline — and until ETF flows turn, rallies may stay fragile.
$BTC $ETH
The pressure is showing up in flows. US spot Bitcoin ETFs recorded about $240 million in net outflows on November 18, with BlackRock's IBIT accounting for 87% of the total, according to market reports. Options traders are buying protection: the most traded contracts over the past day were puts, including the $60,000 strike expiring December 4.
On-chain data adds context. CryptoQuant reports Bitcoin demand is shrinking at its fastest pace since July, with apparent demand down 284,000 BTC over 30 days, and traders now sit on roughly 20% unrealized losses — the deepest since July 1. Bitfinex analysts warn a retest of the November low near $62,029 is possible.
Key levels to watch: $62,029 below, then the 200-day average near $72,900 above. Citi has cut its Bitcoin and Ethereum forecasts, citing weak demand. This is a market being repriced by outflows and fear, not by a single headline — and until ETF flows turn, rallies may stay fragile.
$BTC $ETH
75
翻訳参照
While ETF investors have been selling, corporate treasuries have been buying — and the contrast is worth noting. Strategy purchased 485 $BTC between 9 and 15 November, taking its total holdings to 850,849 BTC, according to its latest SEC filing. Over in Ethereum, BitMine's holdings reached 6.07 million $ETH. These are not small, opportunistic buys; they are steady accumulation programs running through a market that has fallen about 20% in a month. The other side of the trade is real too: spot Bitcoin ETFs have now seen seven straight outflow sessions, averaging about 2,555 BTC a day, and Glassnode data shows roughly half of circulating $BTC is now trading below its last transfer price. So the tape is split — institutions selling through ETFs, treasuries buying on the other side. Neither side has won yet. What it tells us is that conviction exists at these levels, just not from the same crowd. Market commentary only, not investment advice.
While ETF investors have been selling, corporate treasuries have been buying — and the contrast is worth noting. Strategy purchased 485 $BTC between 9 and 15 November, taking its total holdings to 850,849 BTC, according to its latest SEC filing. Over in Ethereum, BitMine's holdings reached 6.07 million $ETH . These are not small, opportunistic buys; they are steady accumulation programs running through a market that has fallen about 20% in a month. The other side of the trade is real too: spot Bitcoin ETFs have now seen seven straight outflow sessions, averaging about 2,555 BTC a day, and Glassnode data shows roughly half of circulating $BTC is now trading below its last transfer price. So the tape is split — institutions selling through ETFs, treasuries buying on the other side. Neither side has won yet. What it tells us is that conviction exists at these levels, just not from the same crowd. Market commentary only, not investment advice.
39
翻訳参照
Two heavyweight macro events land within 24 hours, and crypto is watching both. First, Nvidia just reported: Q3 revenue of $115.8 billion, up 103% year over year and well above the roughly $109 billion expected, with EPS of $2.68 against a $2.47 forecast. The company guided Q4 revenue to about $130 billion, and shares rose roughly 6% after hours — a strong print in its first report since Jensen Huang stepped down as CEO. Risk appetite got a lift. Second, the October FOMC minutes arrive today at 14:00 ET. Rates were held at 3.75%–4% in October on a 10–2 vote, with two officials favoring another hike, and the market now prices a December hike at close to 100%. The minutes will show how the committee debated that split — and that debate sets the tone for $BTC, $ETH and the whole board into December. Add in Russia opening $BTC, $ETH and USDT to retail investors this week, and the macro tape is unusually busy. Today is a day to watch the calendar, not the chart alone. Market commentary only, not investment advice.
Two heavyweight macro events land within 24 hours, and crypto is watching both. First, Nvidia just reported: Q3 revenue of $115.8 billion, up 103% year over year and well above the roughly $109 billion expected, with EPS of $2.68 against a $2.47 forecast. The company guided Q4 revenue to about $130 billion, and shares rose roughly 6% after hours — a strong print in its first report since Jensen Huang stepped down as CEO. Risk appetite got a lift. Second, the October FOMC minutes arrive today at 14:00 ET. Rates were held at 3.75%–4% in October on a 10–2 vote, with two officials favoring another hike, and the market now prices a December hike at close to 100%. The minutes will show how the committee debated that split — and that debate sets the tone for $BTC , $ETH and the whole board into December. Add in Russia opening $BTC , $ETH and USDT to retail investors this week, and the macro tape is unusually busy. Today is a day to watch the calendar, not the chart alone. Market commentary only, not investment advice.
114
今朝、主要銘柄の中で最も強いのはソラナです。$SOL は75.10ドル付近(11月18日、Binance現物)で取引されており、24時間で約5%上昇。71.07ドルの安値から反発し、上位銘柄の中で最も大きな日次上昇率となっています。ただし、直近5セッションでは約9.7%安、年初来では約42%安のままです。つまり、これははるかに大きな下降トレンドの中での反発であり、それだけでトレンド転換を意味するものではありません。注目すべきは、その反発を支える出来高です。24時間の出来高は約33億ドルで、時価総額に対する比率は主要銘柄の中で最も高く、薄商いの中での急騰ではなく、実際の買い需要があることを示唆しています。節目は明確です。夜間の高値は75.78ドルで、これを上抜ければ78~80ドルが視野に入ります。サポートは73.78ドル、その次が71.50ドルです。今日後半のFOMC議事要旨の公表まで$SOL が75ドルを上回って推移できれば、この反発への信頼感が高まります。73ドルを再び下回れば、今日は単なる自律反発に終わったということです。いずれにせよ、今日は$SOL に注目です。これは市場に関するコメントであり、投資助言ではありません。
今朝、主要銘柄の中で最も強いのはソラナです。$SOL は75.10ドル付近(11月18日、Binance現物)で取引されており、24時間で約5%上昇。71.07ドルの安値から反発し、上位銘柄の中で最も大きな日次上昇率となっています。ただし、直近5セッションでは約9.7%安、年初来では約42%安のままです。つまり、これははるかに大きな下降トレンドの中での反発であり、それだけでトレンド転換を意味するものではありません。注目すべきは、その反発を支える出来高です。24時間の出来高は約33億ドルで、時価総額に対する比率は主要銘柄の中で最も高く、薄商いの中での急騰ではなく、実際の買い需要があることを示唆しています。節目は明確です。夜間の高値は75.78ドルで、これを上抜ければ78~80ドルが視野に入ります。サポートは73.78ドル、その次が71.50ドルです。今日後半のFOMC議事要旨の公表まで$SOL が75ドルを上回って推移できれば、この反発への信頼感が高まります。73ドルを再び下回れば、今日は単なる自律反発に終わったということです。いずれにせよ、今日は$SOL に注目です。これは市場に関するコメントであり、投資助言ではありません。
126
翻訳参照
Ethereum is trading near $1,822 this morning (18 Nov, Binance spot), up about 0.3% in 24 hours, in a tight $1,751–$1,843 range. $ETH is down about 9.8% over five sessions and roughly 24% over the past month — one of the deeper drawdowns among the majors, and about 39% lower year to date. The range tells the story: sellers capped every push toward $1,845, while buyers stepped in near $1,750. Meanwhile, corporate buying has not stopped — BitMine's Ethereum holdings reached 6.07 million $ETH, according to its latest filing, a reminder that some large holders are accumulating through the weakness even as spot ETF flows stay soft. The key levels are simple: $1,843 on the upside, then $1,867; below, $1,785 and $1,750. A break either way likely sets the next leg. Until then, $ETH is coiling — and coiling markets tend to resolve with a move, not a drift. This is market commentary, not investment advice.
Ethereum is trading near $1,822 this morning (18 Nov, Binance spot), up about 0.3% in 24 hours, in a tight $1,751–$1,843 range. $ETH is down about 9.8% over five sessions and roughly 24% over the past month — one of the deeper drawdowns among the majors, and about 39% lower year to date. The range tells the story: sellers capped every push toward $1,845, while buyers stepped in near $1,750. Meanwhile, corporate buying has not stopped — BitMine's Ethereum holdings reached 6.07 million $ETH , according to its latest filing, a reminder that some large holders are accumulating through the weakness even as spot ETF flows stay soft. The key levels are simple: $1,843 on the upside, then $1,867; below, $1,785 and $1,750. A break either way likely sets the next leg. Until then, $ETH is coiling — and coiling markets tend to resolve with a move, not a drift. This is market commentary, not investment advice.
55
翻訳参照
$BNB is trading near $597 this morning (18 Nov, Binance spot), up about 1.2% in 24 hours — one of the steadier prints among the majors. The token bounced from a $580.78 low and is holding above the $590 area, with $599 as the immediate ceiling from the overnight high. Zoom out and the picture is still heavy: $BNB is down about 9.7% over five sessions and roughly 18% over the past month, with a market cap near $78 billion. What stands out is relative strength — while $BTC and $ETH drift sideways, $BNB is quietly outperforming on the day. There is no single headline driving it; this looks like a technical hold after last week's washout, with buyers defending the $580–$590 zone. The levels to watch: a daily close above $600 would open room toward $620, while losing $580 puts the mid-$560s back in play. For now $BNB is doing what it often does in choppy markets — holding its ground while the rest of the board decides. Market commentary only, not investment advice.
$BNB is trading near $597 this morning (18 Nov, Binance spot), up about 1.2% in 24 hours — one of the steadier prints among the majors. The token bounced from a $580.78 low and is holding above the $590 area, with $599 as the immediate ceiling from the overnight high. Zoom out and the picture is still heavy: $BNB is down about 9.7% over five sessions and roughly 18% over the past month, with a market cap near $78 billion. What stands out is relative strength — while $BTC and $ETH drift sideways, $BNB is quietly outperforming on the day. There is no single headline driving it; this looks like a technical hold after last week's washout, with buyers defending the $580–$590 zone. The levels to watch: a daily close above $600 would open room toward $620, while losing $580 puts the mid-$560s back in play. For now $BNB is doing what it often does in choppy markets — holding its ground while the rest of the board decides. Market commentary only, not investment advice.
64
翻訳参照
Bitcoin is trading near $64,900 this morning (18 Nov, Binance spot), up about 0.4% in 24 hours — a small green print after six straight weekly losses. $BTC is down roughly 20% over the past month and about 27% year to date, and it is still sitting below its 200-week moving average near $67,750, a level it lost on 14 November. The near-term map is clear: support sits at $64,120, the 30-day low, then the $62,000 weekend liquidation wick. Resistance is $65,200, then $70,000. Today brings the October FOMC minutes at 14:00 ET — the market is watching for how the committee talked about a December move, with a hike almost fully priced. ETF flows are not helping: seven straight outflow sessions, averaging about 2,555 BTC a day. With the 10-year yield at 5.10% and the dollar index at 103.56, macro is still setting the tone. Until $BTC reclaims $67,750, every bounce is a bounce inside a downtrend — worth watching, not chasing. This is market commentary, not investment advice.
Bitcoin is trading near $64,900 this morning (18 Nov, Binance spot), up about 0.4% in 24 hours — a small green print after six straight weekly losses. $BTC is down roughly 20% over the past month and about 27% year to date, and it is still sitting below its 200-week moving average near $67,750, a level it lost on 14 November. The near-term map is clear: support sits at $64,120, the 30-day low, then the $62,000 weekend liquidation wick. Resistance is $65,200, then $70,000. Today brings the October FOMC minutes at 14:00 ET — the market is watching for how the committee talked about a December move, with a hike almost fully priced. ETF flows are not helping: seven straight outflow sessions, averaging about 2,555 BTC a day. With the 10-year yield at 5.10% and the dollar index at 103.56, macro is still setting the tone. Until $BTC reclaims $67,750, every bounce is a bounce inside a downtrend — worth watching, not chasing. This is market commentary, not investment advice.
75
翻訳参照
Follow the flows, not the noise. US spot Bitcoin ETFs have recorded about $2.35 billion in net outflows across the first ten completed November sessions through 13 November — the tenth straight session of selling, and part of a run that has now pushed total 2026 outflows past $1.5 billion. Apparent $BTC demand has turned negative by roughly 284,000 BTC over the past 30 days.
That is the backdrop behind last week's 13.7% slide and Sunday's $61,970 low. ETF flows are not the whole market, but they have become the marginal buyer and seller: when they turn, price tends to follow within days, not weeks.
The calendar gives two near-term checkpoints — Nvidia's earnings today and the FOMC minutes on Wednesday — and both can shift the dollar and rate expectations that have been pressing on risk assets. The honest read: flows are still negative, so calling a bottom here is a guess, not analysis. The first thing to watch is not price but the flow data itself — a single day of inflows after ten days of selling would be the first real change in the story. Data as of 17 Nov 2026. Not financial advice.
Follow the flows, not the noise. US spot Bitcoin ETFs have recorded about $2.35 billion in net outflows across the first ten completed November sessions through 13 November — the tenth straight session of selling, and part of a run that has now pushed total 2026 outflows past $1.5 billion. Apparent $BTC demand has turned negative by roughly 284,000 BTC over the past 30 days.
That is the backdrop behind last week's 13.7% slide and Sunday's $61,970 low. ETF flows are not the whole market, but they have become the marginal buyer and seller: when they turn, price tends to follow within days, not weeks.
The calendar gives two near-term checkpoints — Nvidia's earnings today and the FOMC minutes on Wednesday — and both can shift the dollar and rate expectations that have been pressing on risk assets. The honest read: flows are still negative, so calling a bottom here is a guess, not analysis. The first thing to watch is not price but the flow data itself — a single day of inflows after ten days of selling would be the first real change in the story. Data as of 17 Nov 2026. Not financial advice.
That is the backdrop behind last week's 13.7% slide and Sunday's $61,970 low. ETF flows are not the whole market, but they have become the marginal buyer and seller: when they turn, price tends to follow within days, not weeks.
The calendar gives two near-term checkpoints — Nvidia's earnings today and the FOMC minutes on Wednesday — and both can shift the dollar and rate expectations that have been pressing on risk assets. The honest read: flows are still negative, so calling a bottom here is a guess, not analysis. The first thing to watch is not price but the flow data itself — a single day of inflows after ten days of selling would be the first real change in the story. Data as of 17 Nov 2026. Not financial advice.
5
翻訳参照
Today is the day Monero holders on MEXC have been watching. The exchange is scheduled to suspend $XMR spot trading at 09:00 UTC on 17 November, cancelling open orders; deposits are already closed, while withdrawals stay open for 30 days after delisting.
XMR was trading near $497 on 16 November, roughly flat over 24 hours but down about 17% over the past week — it had already fallen about 10% on 15 November to near $476 ahead of the deadline. MEXC has not given a reason for removing the pairs in its notices, and the delisting itself does not prove a network problem: mining snapshots around the event do not show a collapse.
What it does show is the access risk privacy coins now face on centralised venues — fewer on-ramps, wider spreads, and more reliance on peer-to-peer and decentralised routes. For anyone holding XMR on MEXC, the practical point is the 30-day withdrawal window. The broader lesson applies beyond one coin: in this market, where you hold an asset can matter as much as what you hold. Data as of 16–17 Nov 2026. Not financial advice.
Today is the day Monero holders on MEXC have been watching. The exchange is scheduled to suspend $XMR spot trading at 09:00 UTC on 17 November, cancelling open orders; deposits are already closed, while withdrawals stay open for 30 days after delisting.
XMR was trading near $497 on 16 November, roughly flat over 24 hours but down about 17% over the past week — it had already fallen about 10% on 15 November to near $476 ahead of the deadline. MEXC has not given a reason for removing the pairs in its notices, and the delisting itself does not prove a network problem: mining snapshots around the event do not show a collapse.
What it does show is the access risk privacy coins now face on centralised venues — fewer on-ramps, wider spreads, and more reliance on peer-to-peer and decentralised routes. For anyone holding XMR on MEXC, the practical point is the 30-day withdrawal window. The broader lesson applies beyond one coin: in this market, where you hold an asset can matter as much as what you hold. Data as of 16–17 Nov 2026. Not financial advice.
XMR was trading near $497 on 16 November, roughly flat over 24 hours but down about 17% over the past week — it had already fallen about 10% on 15 November to near $476 ahead of the deadline. MEXC has not given a reason for removing the pairs in its notices, and the delisting itself does not prove a network problem: mining snapshots around the event do not show a collapse.
What it does show is the access risk privacy coins now face on centralised venues — fewer on-ramps, wider spreads, and more reliance on peer-to-peer and decentralised routes. For anyone holding XMR on MEXC, the practical point is the 30-day withdrawal window. The broader lesson applies beyond one coin: in this market, where you hold an asset can matter as much as what you hold. Data as of 16–17 Nov 2026. Not financial advice.
33
ソラナは今朝(11月17日、Binance現物)71.60ドル近辺で取引されており、24時間で約1.6%、過去1週間で約19%下落しました。主要銘柄の中で、週間下落率は最も大きくなっています。$SOL は年初来で約42%下落し、現在は20日、50日、200日の各移動平均線を下回って取引されています。14日RSIは21近辺です。サポートは68.94ドル近辺、レジスタンスは74.81ドル近辺です。
しかし、水面下では実に興味深い動きがあります。米国の証券保管・決済機関であるDTCCは、証券トークン化インフラをソラナのブロックチェーンと統合する計画を発表しました。これは、トークン化された証券がパブリックチェーン上で決済されるという、長期的かつ機関投資家向けのシグナルです。そして、短期的な値動きとは鮮明な対照をなしています。
率直に言えば、DTCCのニュースは今週のテクニカル状況を変えるものではなく、トークン化のロードマップだけで下落トレンドが止まるわけでもありません。変わるのは、2027年に投資家が注目するストーリーです。今のところ、重要な水準は68.94ドルです。データは2026年11月17日00:00 UTC時点。投資助言ではありません。
ソラナは今朝(11月17日、Binance現物)71.60ドル近辺で取引されており、24時間で約1.6%、過去1週間で約19%下落しました。主要銘柄の中で、週間下落率は最も大きくなっています。$SOL は年初来で約42%下落し、現在は20日、50日、200日の各移動平均線を下回って取引されています。14日RSIは21近辺です。サポートは68.94ドル近辺、レジスタンスは74.81ドル近辺です。
しかし、水面下では実に興味深い動きがあります。米国の証券保管・決済機関であるDTCCは、証券トークン化インフラをソラナのブロックチェーンと統合する計画を発表しました。これは、トークン化された証券がパブリックチェーン上で決済されるという、長期的かつ機関投資家向けのシグナルです。そして、短期的な値動きとは鮮明な対照をなしています。
率直に言えば、DTCCのニュースは今週のテクニカル状況を変えるものではなく、トークン化のロードマップだけで下落トレンドが止まるわけでもありません。変わるのは、2027年に投資家が注目するストーリーです。今のところ、重要な水準は68.94ドルです。データは2026年11月17日00:00 UTC時点。投資助言ではありません。
しかし、水面下では実に興味深い動きがあります。米国の証券保管・決済機関であるDTCCは、証券トークン化インフラをソラナのブロックチェーンと統合する計画を発表しました。これは、トークン化された証券がパブリックチェーン上で決済されるという、長期的かつ機関投資家向けのシグナルです。そして、短期的な値動きとは鮮明な対照をなしています。
率直に言えば、DTCCのニュースは今週のテクニカル状況を変えるものではなく、トークン化のロードマップだけで下落トレンドが止まるわけでもありません。変わるのは、2027年に投資家が注目するストーリーです。今のところ、重要な水準は68.94ドルです。データは2026年11月17日00:00 UTC時点。投資助言ではありません。
128
翻訳参照
Ethereum is trading near $1,821 this morning (17 Nov, Binance spot), down about 0.8% in 24 hours. The numbers behind the price are stark: $ETH is down 12.6% over five sessions, 25% over the past month and about 40% year to date — the weakest of the majors in 2026. The 14-day RSI is near 26, in oversold territory, and the daily pivot sits around $1,796 with support near $1,749 and resistance near $1,881.
The fundamental pressure is twofold: ETH's price fall has come alongside a decline in capital locked in DeFi, and spot Ether funds have shared in the week's heavy outflows. Unlike Bitcoin, which still has the ETF demand story to fall back on, Ethereum's flows have been quieter, and the token now trades below its 20, 50 and 200-day moving averages.
Oversold readings describe stretched momentum, not a confirmed bottom — a bounce needs a real change in flows first. Watch whether $1,749 holds on a daily close, and whether the $1,980–$2,030 zone, broken last Friday, gets reclaimed. Data as of 17 Nov 2026, 00:00 UTC. Not financial advice.
Ethereum is trading near $1,821 this morning (17 Nov, Binance spot), down about 0.8% in 24 hours. The numbers behind the price are stark: $ETH is down 12.6% over five sessions, 25% over the past month and about 40% year to date — the weakest of the majors in 2026. The 14-day RSI is near 26, in oversold territory, and the daily pivot sits around $1,796 with support near $1,749 and resistance near $1,881.
The fundamental pressure is twofold: ETH's price fall has come alongside a decline in capital locked in DeFi, and spot Ether funds have shared in the week's heavy outflows. Unlike Bitcoin, which still has the ETF demand story to fall back on, Ethereum's flows have been quieter, and the token now trades below its 20, 50 and 200-day moving averages.
Oversold readings describe stretched momentum, not a confirmed bottom — a bounce needs a real change in flows first. Watch whether $1,749 holds on a daily close, and whether the $1,980–$2,030 zone, broken last Friday, gets reclaimed. Data as of 17 Nov 2026, 00:00 UTC. Not financial advice.
The fundamental pressure is twofold: ETH's price fall has come alongside a decline in capital locked in DeFi, and spot Ether funds have shared in the week's heavy outflows. Unlike Bitcoin, which still has the ETF demand story to fall back on, Ethereum's flows have been quieter, and the token now trades below its 20, 50 and 200-day moving averages.
Oversold readings describe stretched momentum, not a confirmed bottom — a bounce needs a real change in flows first. Watch whether $1,749 holds on a daily close, and whether the $1,980–$2,030 zone, broken last Friday, gets reclaimed. Data as of 17 Nov 2026, 00:00 UTC. Not financial advice.
21
翻訳参照
$BNB is trading near $591 this morning (17 Nov, Binance spot), down about 0.9% in 24 hours and roughly 14% over the past week. The token bounced from a $584.77 low on Monday and is holding above the $583–$585 zone for now, with the 24-hour range sitting between $583.81 and $597.91. On a five-session view BNB is down 13.8%, and it is about 57% below its all-time high near $1,370 from October.
The wider backdrop is not helping: total crypto market cap is around $2.18 trillion, Bitcoin dominance is near 59%, and sentiment is deep in Extreme Fear. One structural point in BNB's favour: the 37th quarterly BNB burn was completed on 19 October, continuing the long-running supply reduction.
Burns do not set the price on their own — in a week like this, macro and ETF flows dominate — but they remain part of the token's design. The levels that matter now are the $584 area below and the $598–$603 zone above. A clean hold above the recent low would be the first sign of stabilisation; losing it opens the door to a deeper test. Data as of 17 Nov 2026, 00:00 UTC. Not financial advice.
$BNB is trading near $591 this morning (17 Nov, Binance spot), down about 0.9% in 24 hours and roughly 14% over the past week. The token bounced from a $584.77 low on Monday and is holding above the $583–$585 zone for now, with the 24-hour range sitting between $583.81 and $597.91. On a five-session view BNB is down 13.8%, and it is about 57% below its all-time high near $1,370 from October.
The wider backdrop is not helping: total crypto market cap is around $2.18 trillion, Bitcoin dominance is near 59%, and sentiment is deep in Extreme Fear. One structural point in BNB's favour: the 37th quarterly BNB burn was completed on 19 October, continuing the long-running supply reduction.
Burns do not set the price on their own — in a week like this, macro and ETF flows dominate — but they remain part of the token's design. The levels that matter now are the $584 area below and the $598–$603 zone above. A clean hold above the recent low would be the first sign of stabilisation; losing it opens the door to a deeper test. Data as of 17 Nov 2026, 00:00 UTC. Not financial advice.
The wider backdrop is not helping: total crypto market cap is around $2.18 trillion, Bitcoin dominance is near 59%, and sentiment is deep in Extreme Fear. One structural point in BNB's favour: the 37th quarterly BNB burn was completed on 19 October, continuing the long-running supply reduction.
Burns do not set the price on their own — in a week like this, macro and ETF flows dominate — but they remain part of the token's design. The levels that matter now are the $584 area below and the $598–$603 zone above. A clean hold above the recent low would be the first sign of stabilisation; losing it opens the door to a deeper test. Data as of 17 Nov 2026, 00:00 UTC. Not financial advice.
20
翻訳参照
The week ahead could set the tone for the rest of November — here is what is on the calendar.
First, the ETF picture. Spot $BTC ETFs lost about $1.065 billion over Nov 9-13, with all five days negative. That extends the outflow streak to ten straight sessions. Monday, Nov 16 is the first chance for an inflow day to break that run — and traders will be watching the print closely.
Second, the macro calendar. Strategy files its weekly 8-K on Monday, and the FOMC minutes arrive Wednesday, Nov 18. December rate-hike odds were last seen near 90% on FedWatch, so any hint in the minutes about the Fed's thinking matters for risk assets across the board.
Third, the mining side. Hashprice sits at about $30.65 per PH per day — back near breakeven for large miners — even after a 9.13% difficulty cut on Nov 14. $BTC's price fall absorbed most of the relief from that cut.
The setup is simple to read: a market in Extreme Fear, ten straight ETF outflow days, and a week full of catalysts. Either the outflow streak breaks and the bounce builds, or the $61,946 weekend low gets tested again. The data will decide — the calendar just tells us when to look.
Data as of Nov 16, 2026 morning. Not financial advice.
The week ahead could set the tone for the rest of November — here is what is on the calendar.
First, the ETF picture. Spot $BTC ETFs lost about $1.065 billion over Nov 9-13, with all five days negative. That extends the outflow streak to ten straight sessions. Monday, Nov 16 is the first chance for an inflow day to break that run — and traders will be watching the print closely.
Second, the macro calendar. Strategy files its weekly 8-K on Monday, and the FOMC minutes arrive Wednesday, Nov 18. December rate-hike odds were last seen near 90% on FedWatch, so any hint in the minutes about the Fed's thinking matters for risk assets across the board.
Third, the mining side. Hashprice sits at about $30.65 per PH per day — back near breakeven for large miners — even after a 9.13% difficulty cut on Nov 14. $BTC 's price fall absorbed most of the relief from that cut.
The setup is simple to read: a market in Extreme Fear, ten straight ETF outflow days, and a week full of catalysts. Either the outflow streak breaks and the bounce builds, or the $61,946 weekend low gets tested again. The data will decide — the calendar just tells us when to look.
Data as of Nov 16, 2026 morning. Not financial advice.
First, the ETF picture. Spot $BTC ETFs lost about $1.065 billion over Nov 9-13, with all five days negative. That extends the outflow streak to ten straight sessions. Monday, Nov 16 is the first chance for an inflow day to break that run — and traders will be watching the print closely.
Second, the macro calendar. Strategy files its weekly 8-K on Monday, and the FOMC minutes arrive Wednesday, Nov 18. December rate-hike odds were last seen near 90% on FedWatch, so any hint in the minutes about the Fed's thinking matters for risk assets across the board.
Third, the mining side. Hashprice sits at about $30.65 per PH per day — back near breakeven for large miners — even after a 9.13% difficulty cut on Nov 14. $BTC 's price fall absorbed most of the relief from that cut.
The setup is simple to read: a market in Extreme Fear, ten straight ETF outflow days, and a week full of catalysts. Either the outflow streak breaks and the bounce builds, or the $61,946 weekend low gets tested again. The data will decide — the calendar just tells us when to look.
Data as of Nov 16, 2026 morning. Not financial advice.
26
ログインして、さらにコンテンツを読む
厳選トピックで世界の暗号資産トレーダーの仲間入り
⚡️ 暗号資産に関する最新かつ有益な情報が見つかります。
💬 世界最大の暗号資産取引所から信頼されています。
👍 認証を受けたクリエイターから、有益なインサイトを得られます。
メール / 電話番号