
RiseFinance
596 投稿

RiseFinance
報告
ユーザーをブロック
1 フォロー
15 フォロワー
38 いいね
投稿
·
--
翻訳参照
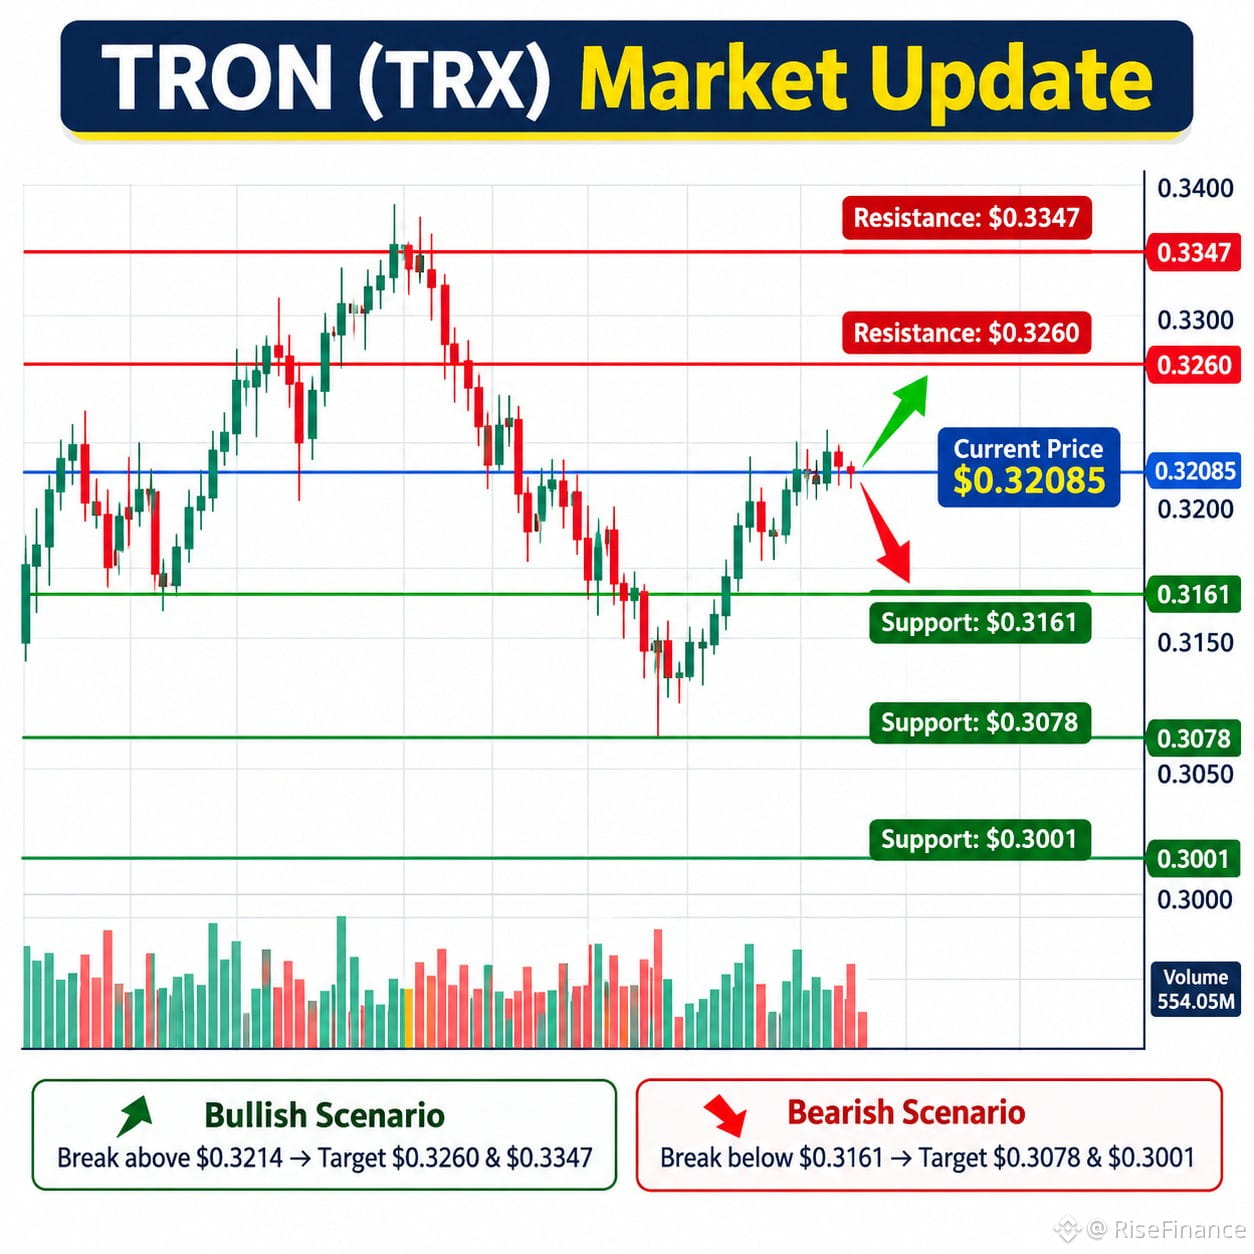
$TRX | TRON Market Analysis: Can Buyers Break the Resistance?
Market Overview
TRON (TRX) is showing short-term strength despite weakness across the broader cryptocurrency market.
- Current Price: $0.32085
- 24H Change: +1.80%
- 24H Trading Volume: $554.05 Million
- Market Capitalization: $30.48 Billion
Market Trend: Bearish Bias (Short-Term Recovery)
TRX is attempting to recover, but its broader daily technical structure remains bearish. Buyers need to overcome nearby resistance before a stronger trend reversal can be considered.
Key Support Levels
- $0.3161
- $0.3078
- $0.3001
Key Resistance Levels
- $0.3214
- $0.3260
- $0.3347
Bullish Scenario
If TRX breaks above $0.3214 and maintains buying pressure, the next potential resistance levels are $0.3260 and $0.3347. Strong trading volume would help confirm the breakout.
Bearish Scenario
If buyers fail to defend $0.3161, selling pressure could push the price towards $0.3078 and potentially $0.3001.
Risk Management
Watch for confirmed candle closes rather than reacting to temporary price movements. Consider trading volume, stop-loss placement and position sizing. Avoid chasing sudden price increases.
Educational Disclaimer: This analysis is for educational purposes only, not financial advice. Cryptocurrency markets are volatile, and all trading involves risk.
#BinanceReopensWithdrawalsForMoreAssets #AppleReportsMixedResults #BinanceHourlyDepositsExceedWithdrawals #USMidtermElections #USOctoberNFP-AreRateCutsStillPossible
{future}(TRXUSDT)
$TRX | TRON Market Analysis: Can Buyers Break the Resistance?
Market Overview
TRON (TRX) is showing short-term strength despite weakness across the broader cryptocurrency market.
- Current Price: $0.32085
- 24H Change: +1.80%
- 24H Trading Volume: $554.05 Million
- Market Capitalization: $30.48 Billion
Market Trend: Bearish Bias (Short-Term Recovery)
TRX is attempting to recover, but its broader daily technical structure remains bearish. Buyers need to overcome nearby resistance before a stronger trend reversal can be considered.
Key Support Levels
- $0.3161
- $0.3078
- $0.3001
Key Resistance Levels
- $0.3214
- $0.3260
- $0.3347
Bullish Scenario
If TRX breaks above $0.3214 and maintains buying pressure, the next potential resistance levels are $0.3260 and $0.3347. Strong trading volume would help confirm the breakout.
Bearish Scenario
If buyers fail to defend $0.3161, selling pressure could push the price towards $0.3078 and potentially $0.3001.
Risk Management
Watch for confirmed candle closes rather than reacting to temporary price movements. Consider trading volume, stop-loss placement and position sizing. Avoid chasing sudden price increases.
Educational Disclaimer: This analysis is for educational purposes only, not financial advice. Cryptocurrency markets are volatile, and all trading involves risk.
#BinanceReopensWithdrawalsForMoreAssets #AppleReportsMixedResults #BinanceHourlyDepositsExceedWithdrawals #USMidtermElections #USOctoberNFP-AreRateCutsStillPossible
Market Overview
TRON (TRX) is showing short-term strength despite weakness across the broader cryptocurrency market.
- Current Price: $0.32085
- 24H Change: +1.80%
- 24H Trading Volume: $554.05 Million
- Market Capitalization: $30.48 Billion
Market Trend: Bearish Bias (Short-Term Recovery)
TRX is attempting to recover, but its broader daily technical structure remains bearish. Buyers need to overcome nearby resistance before a stronger trend reversal can be considered.
Key Support Levels
- $0.3161
- $0.3078
- $0.3001
Key Resistance Levels
- $0.3214
- $0.3260
- $0.3347
Bullish Scenario
If TRX breaks above $0.3214 and maintains buying pressure, the next potential resistance levels are $0.3260 and $0.3347. Strong trading volume would help confirm the breakout.
Bearish Scenario
If buyers fail to defend $0.3161, selling pressure could push the price towards $0.3078 and potentially $0.3001.
Risk Management
Watch for confirmed candle closes rather than reacting to temporary price movements. Consider trading volume, stop-loss placement and position sizing. Avoid chasing sudden price increases.
Educational Disclaimer: This analysis is for educational purposes only, not financial advice. Cryptocurrency markets are volatile, and all trading involves risk.
#BinanceReopensWithdrawalsForMoreAssets #AppleReportsMixedResults #BinanceHourlyDepositsExceedWithdrawals #USMidtermElections #USOctoberNFP-AreRateCutsStillPossible
24
·
--
翻訳参照
$PIEVERSE | Pieverse Market Analysis
Current Market Overview
Pieverse (PIEVERSE) is attracting attention with a positive short-term price movement and increased trading activity.
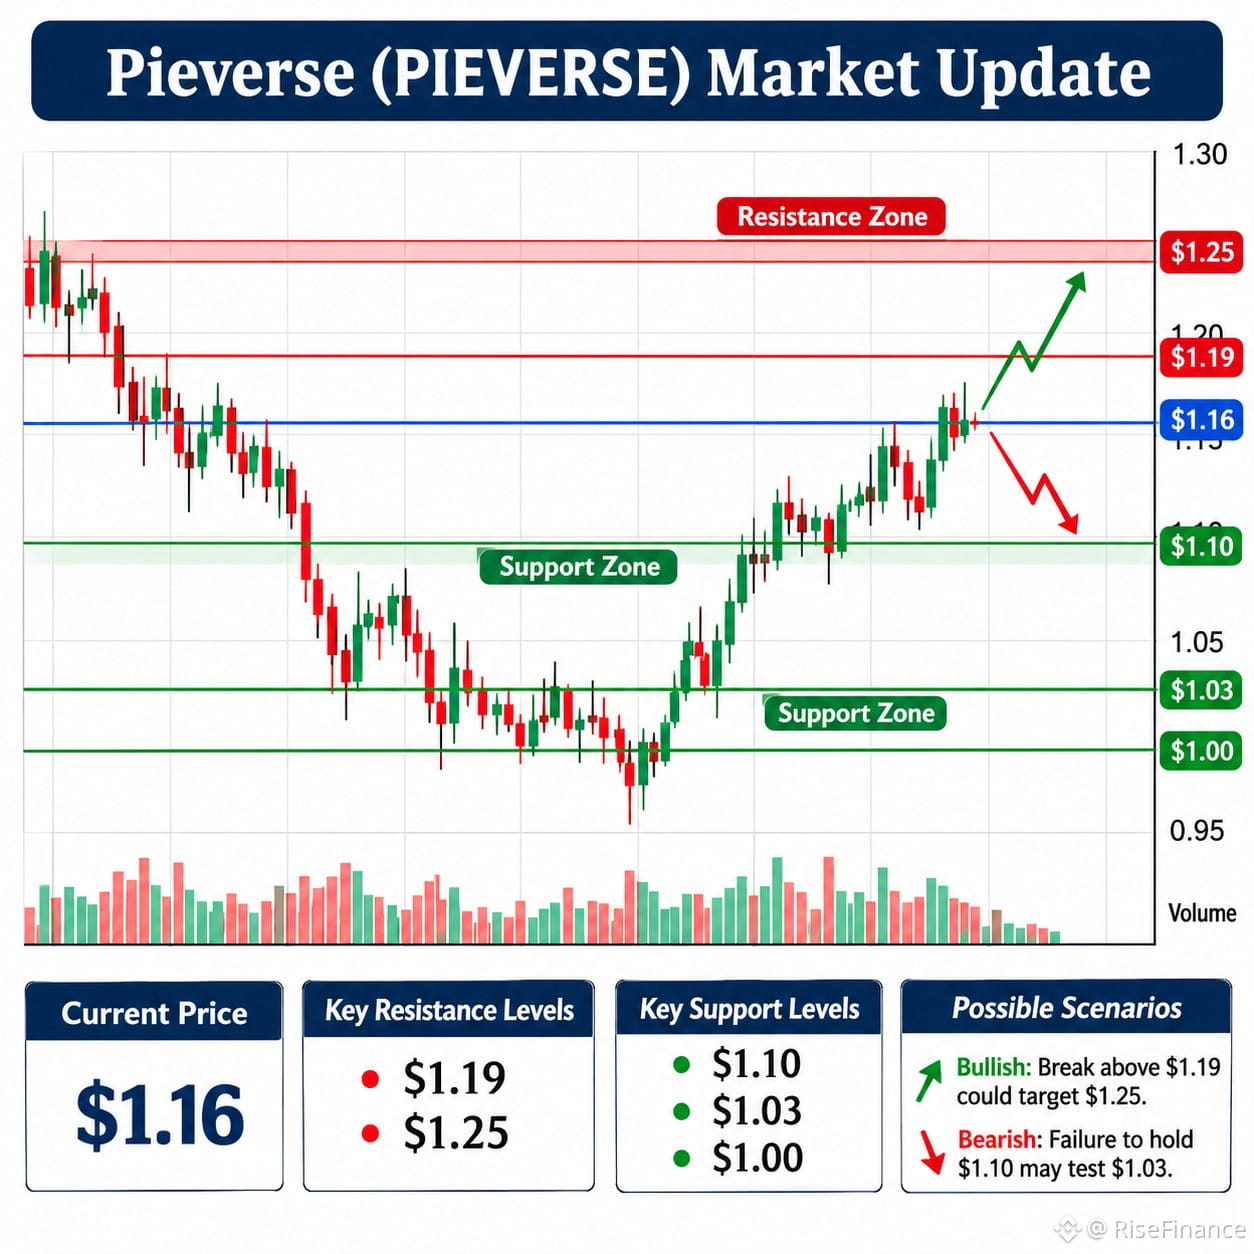
- Current Price: Approximately $1.16
- 24H Change: +9.2%
- 24H Trading Volume: Approximately $29.34 million
- Market Capitalization: Approximately $350.3 million
- 24H Price Range: $1.03–$1.19
Market figures are based on CoinMarketCap's latest available snapshot and may change.
Market Trend: Short-Term Bullish, Broader Trend Cautious
PIEVERSE is showing recovery momentum after recent weakness. However, the broader monthly trend remains under pressure, so confirmation is important before considering this a sustained reversal.
Key Support Levels
- $1.10 – Near-term support area
- $1.03 – Recent 24-hour low and important support
- $1.00 – Psychological support level
Key Resistance Levels
- $1.19 – Immediate resistance
- $1.25 – Potential next resistance if momentum continues
Technical levels are approximate areas based on recent price action, not guaranteed turning points.
Bullish Scenario
If buyers maintain momentum and price breaks above $1.19 with strong trading volume, PIEVERSE could attempt a move toward $1.25. A sustained breakout would strengthen the short-term bullish outlook.
Bearish Scenario
If the price fails to overcome resistance, sellers could push it back toward $1.10 and $1.03. A breakdown below $1.03 could expose the psychological $1.00 level.
Risk Management
Avoid chasing sudden price increases. Watch volume and candle-closing confirmation around key levels. Use appropriate position sizing, define invalidation levels and avoid excessive leverage.
Educational Disclaimer: This analysis is for educational purposes only and is not financial advice. Cryptocurrency markets are volatile, and all trading decisions involve risk.
#BinanceReopensWithdrawalsForMoreAssets #AppleReportsMixedResults #BinanceHourlyDepositsExceedWithdrawals #USMidtermElections #USOctoberNFP-AreRateCutsStillPossible
{alpha}(560x0e63b9c287e32a05e6b9ab8ee8df88a2760225a9)
$PIEVERSE | Pieverse Market Analysis
Current Market Overview
Pieverse (PIEVERSE) is attracting attention with a positive short-term price movement and increased trading activity.
- Current Price: Approximately $1.16
- 24H Change: +9.2%
- 24H Trading Volume: Approximately $29.34 million
- Market Capitalization: Approximately $350.3 million
- 24H Price Range: $1.03–$1.19
Market figures are based on CoinMarketCap's latest available snapshot and may change.
Market Trend: Short-Term Bullish, Broader Trend Cautious
PIEVERSE is showing recovery momentum after recent weakness. However, the broader monthly trend remains under pressure, so confirmation is important before considering this a sustained reversal.
Key Support Levels
- $1.10 – Near-term support area
- $1.03 – Recent 24-hour low and important support
- $1.00 – Psychological support level
Key Resistance Levels
- $1.19 – Immediate resistance
- $1.25 – Potential next resistance if momentum continues
Technical levels are approximate areas based on recent price action, not guaranteed turning points.
Bullish Scenario
If buyers maintain momentum and price breaks above $1.19 with strong trading volume, PIEVERSE could attempt a move toward $1.25. A sustained breakout would strengthen the short-term bullish outlook.
Bearish Scenario
If the price fails to overcome resistance, sellers could push it back toward $1.10 and $1.03. A breakdown below $1.03 could expose the psychological $1.00 level.
Risk Management
Avoid chasing sudden price increases. Watch volume and candle-closing confirmation around key levels. Use appropriate position sizing, define invalidation levels and avoid excessive leverage.
Educational Disclaimer: This analysis is for educational purposes only and is not financial advice. Cryptocurrency markets are volatile, and all trading decisions involve risk.
#BinanceReopensWithdrawalsForMoreAssets #AppleReportsMixedResults #BinanceHourlyDepositsExceedWithdrawals #USMidtermElections #USOctoberNFP-AreRateCutsStillPossible
Current Market Overview
Pieverse (PIEVERSE) is attracting attention with a positive short-term price movement and increased trading activity.
- Current Price: Approximately $1.16
- 24H Change: +9.2%
- 24H Trading Volume: Approximately $29.34 million
- Market Capitalization: Approximately $350.3 million
- 24H Price Range: $1.03–$1.19
Market figures are based on CoinMarketCap's latest available snapshot and may change.
Market Trend: Short-Term Bullish, Broader Trend Cautious
PIEVERSE is showing recovery momentum after recent weakness. However, the broader monthly trend remains under pressure, so confirmation is important before considering this a sustained reversal.
Key Support Levels
- $1.10 – Near-term support area
- $1.03 – Recent 24-hour low and important support
- $1.00 – Psychological support level
Key Resistance Levels
- $1.19 – Immediate resistance
- $1.25 – Potential next resistance if momentum continues
Technical levels are approximate areas based on recent price action, not guaranteed turning points.
Bullish Scenario
If buyers maintain momentum and price breaks above $1.19 with strong trading volume, PIEVERSE could attempt a move toward $1.25. A sustained breakout would strengthen the short-term bullish outlook.
Bearish Scenario
If the price fails to overcome resistance, sellers could push it back toward $1.10 and $1.03. A breakdown below $1.03 could expose the psychological $1.00 level.
Risk Management
Avoid chasing sudden price increases. Watch volume and candle-closing confirmation around key levels. Use appropriate position sizing, define invalidation levels and avoid excessive leverage.
Educational Disclaimer: This analysis is for educational purposes only and is not financial advice. Cryptocurrency markets are volatile, and all trading decisions involve risk.
#BinanceReopensWithdrawalsForMoreAssets #AppleReportsMixedResults #BinanceHourlyDepositsExceedWithdrawals #USMidtermElections #USOctoberNFP-AreRateCutsStillPossible
184
·
--
翻訳参照
$BTC Bitcoin (BTC) Market Analysis | November 3, 2026
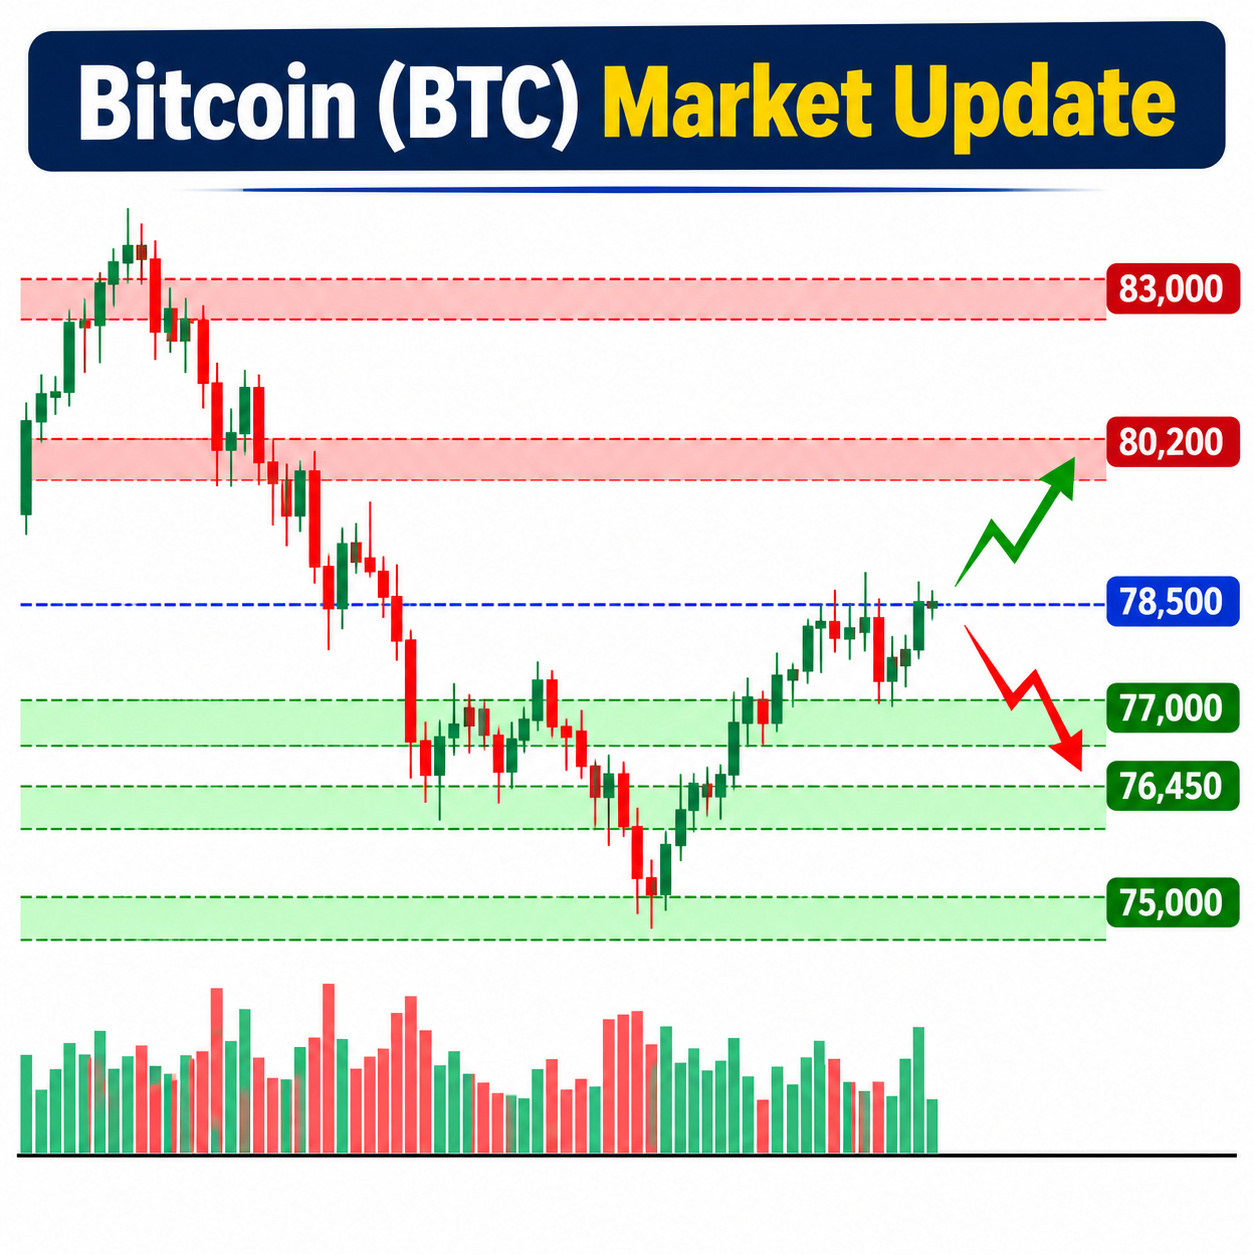
Current Price: Around $77,750
Market Trend: Bitcoin is showing a short-term recovery, but the overall market structure remains cautious and slightly bearish. BTC is trading below the important $80,000–$80,200 resistance zone, indicating that buyers still need stronger momentum to confirm a trend reversal.
Key Support Levels:
- $77,000 – Immediate support
- $76,450 – Major support
- $75,000 – Next downside level
Key Resistance Levels:
- $78,500 – Immediate resistance
- $80,200 – Major resistance
- $83,000 – Higher resistance
Bullish Scenario: If BTC holds above $77,000 and breaks through $78,500, buyers could push the price toward $80,200. A strong breakout above $80,200 may open the way toward $83,000.
Bearish Scenario: If Bitcoin fails to maintain support around $77,000, selling pressure could increase. A breakdown below $76,450 may expose the $75,000 level.
Risk Management: Watch daily candle closes, trading volume, and market momentum before confirming a breakout. Avoid excessive leverage and always use proper stop-loss levels.
Educational Disclaimer: This analysis is for educational purposes only and should not be considered financial advice. Always do your own research before making trading decisions.
#BinanceWithdrawalScamWarning #USMidtermElections #USOctoberNFP-AreRateCutsStillPossible #AppleEarningsAhead-CanStockHitNewHigh #Verify1to1BinanceReserves
{spot}(BTCUSDT)
$BTC Bitcoin (BTC) Market Analysis | November 3, 2026
Current Price: Around $77,750
Market Trend: Bitcoin is showing a short-term recovery, but the overall market structure remains cautious and slightly bearish. BTC is trading below the important $80,000–$80,200 resistance zone, indicating that buyers still need stronger momentum to confirm a trend reversal.
Key Support Levels:
- $77,000 – Immediate support
- $76,450 – Major support
- $75,000 – Next downside level
Key Resistance Levels:
- $78,500 – Immediate resistance
- $80,200 – Major resistance
- $83,000 – Higher resistance
Bullish Scenario: If BTC holds above $77,000 and breaks through $78,500, buyers could push the price toward $80,200. A strong breakout above $80,200 may open the way toward $83,000.
Bearish Scenario: If Bitcoin fails to maintain support around $77,000, selling pressure could increase. A breakdown below $76,450 may expose the $75,000 level.
Risk Management: Watch daily candle closes, trading volume, and market momentum before confirming a breakout. Avoid excessive leverage and always use proper stop-loss levels.
Educational Disclaimer: This analysis is for educational purposes only and should not be considered financial advice. Always do your own research before making trading decisions.
#BinanceWithdrawalScamWarning #USMidtermElections #USOctoberNFP-AreRateCutsStillPossible #AppleEarningsAhead-CanStockHitNewHigh #Verify1to1BinanceReserves
Current Price: Around $77,750
Market Trend: Bitcoin is showing a short-term recovery, but the overall market structure remains cautious and slightly bearish. BTC is trading below the important $80,000–$80,200 resistance zone, indicating that buyers still need stronger momentum to confirm a trend reversal.
Key Support Levels:
- $77,000 – Immediate support
- $76,450 – Major support
- $75,000 – Next downside level
Key Resistance Levels:
- $78,500 – Immediate resistance
- $80,200 – Major resistance
- $83,000 – Higher resistance
Bullish Scenario: If BTC holds above $77,000 and breaks through $78,500, buyers could push the price toward $80,200. A strong breakout above $80,200 may open the way toward $83,000.
Bearish Scenario: If Bitcoin fails to maintain support around $77,000, selling pressure could increase. A breakdown below $76,450 may expose the $75,000 level.
Risk Management: Watch daily candle closes, trading volume, and market momentum before confirming a breakout. Avoid excessive leverage and always use proper stop-loss levels.
Educational Disclaimer: This analysis is for educational purposes only and should not be considered financial advice. Always do your own research before making trading decisions.
#BinanceWithdrawalScamWarning #USMidtermElections #USOctoberNFP-AreRateCutsStillPossible #AppleEarningsAhead-CanStockHitNewHigh #Verify1to1BinanceReserves
3
52
·
--
翻訳参照
$BTC Bitcoin (BTC) Market Analysis – November 2, 2026
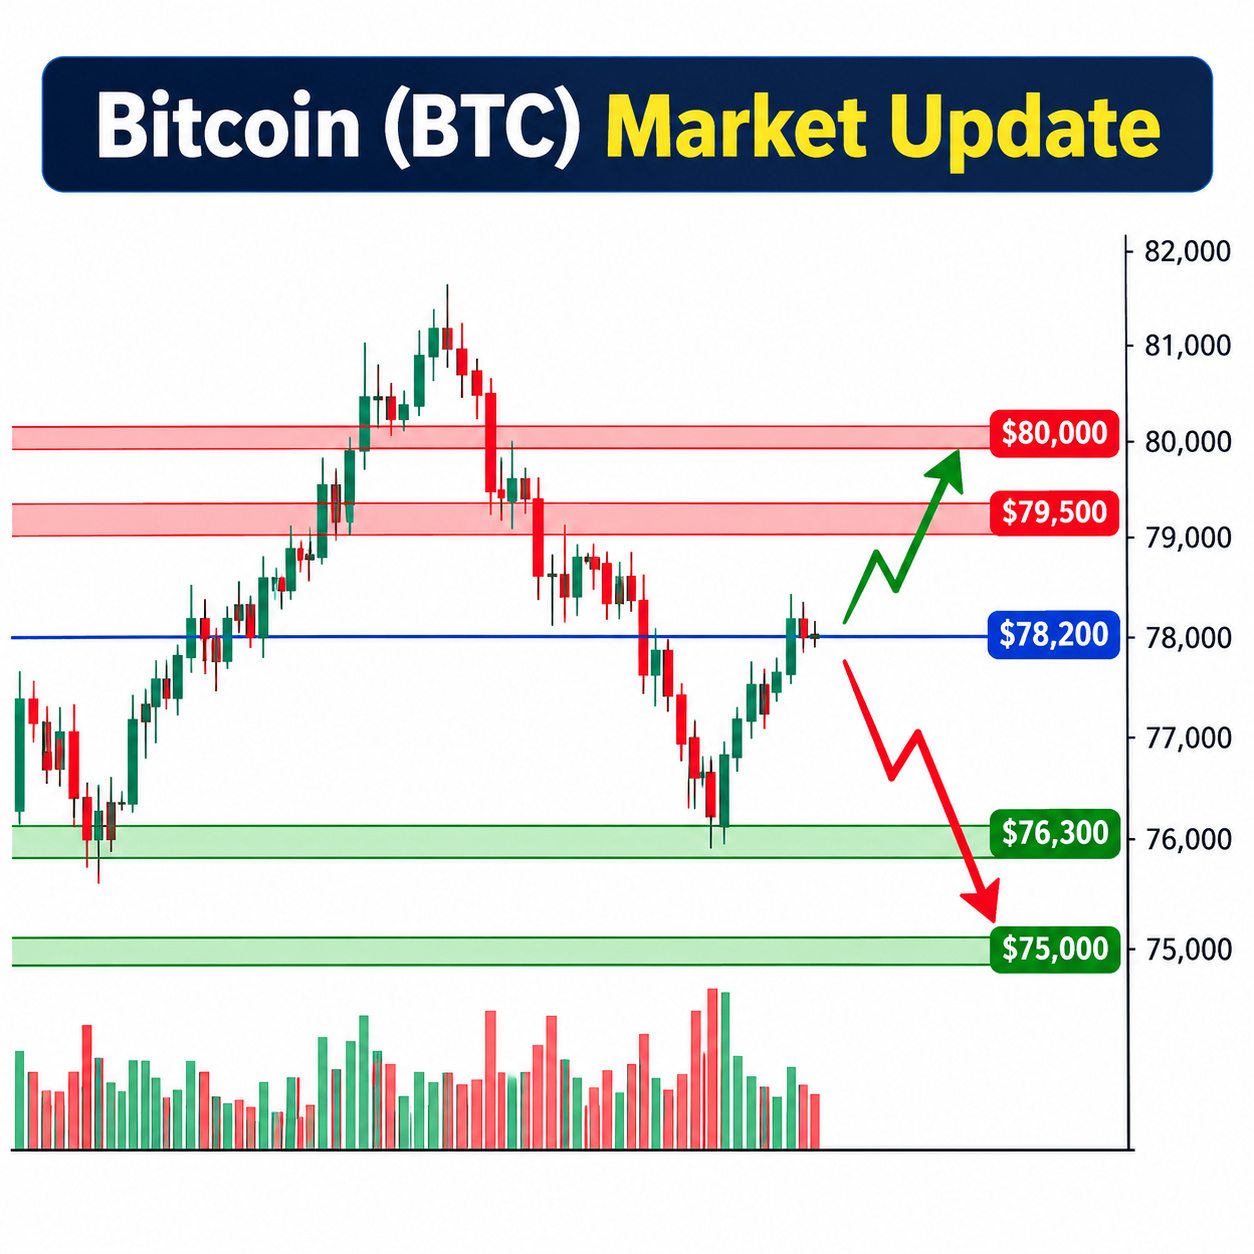
Current Price: Around $78,200
Market Trend: Bitcoin is showing a short-term recovery after falling to a six-week low near $76,200. However, the broader short-term structure remains cautious and bearish. Buyers are attempting to regain momentum, but strong resistance remains overhead.
Key Support Levels:
- $77,000 – Immediate support
- $76,300 – Major support
- $75,000 – Next downside target
Key Resistance Levels:
- $78,600 – Immediate resistance
- $79,500 – Important resistance
- $80,000 – Major breakout level
Bullish Scenario: If BTC holds above $77,000 and breaks through $79,500–$80,000 with strong buying volume, bullish momentum could strengthen, potentially opening the way toward $81,450.
Bearish Scenario: If Bitcoin fails to break resistance and drops below $76,300, selling pressure could increase, bringing the $75,000 support zone into focus.
Risk Management: Watch trading volume and daily candle closes before interpreting a breakout. Avoid emotional decisions, manage exposure carefully, and remember that false breakouts can occur in volatile markets.
Key Takeaway: Bitcoin is attempting to recover, but confirmation above $80,000 is important for a stronger bullish outlook. Until then, cautious trading and close monitoring of support levels remain essential.
Disclaimer: This analysis is for educational and informational purposes only. It is not financial advice. Always do your own research and understand the risks before making any trading decisions.
#BinanceWithdrawalScamWarning #USMidtermElections #USOctoberNFP-AreRateCutsStillPossible #AppleEarningsAhead-CanStockHitNewHigh #Verify1to1BinanceReserves
{spot}(BTCUSDT)
$BTC Bitcoin (BTC) Market Analysis – November 2, 2026
Current Price: Around $78,200
Market Trend: Bitcoin is showing a short-term recovery after falling to a six-week low near $76,200. However, the broader short-term structure remains cautious and bearish. Buyers are attempting to regain momentum, but strong resistance remains overhead.
Key Support Levels:
- $77,000 – Immediate support
- $76,300 – Major support
- $75,000 – Next downside target
Key Resistance Levels:
- $78,600 – Immediate resistance
- $79,500 – Important resistance
- $80,000 – Major breakout level
Bullish Scenario: If BTC holds above $77,000 and breaks through $79,500–$80,000 with strong buying volume, bullish momentum could strengthen, potentially opening the way toward $81,450.
Bearish Scenario: If Bitcoin fails to break resistance and drops below $76,300, selling pressure could increase, bringing the $75,000 support zone into focus.
Risk Management: Watch trading volume and daily candle closes before interpreting a breakout. Avoid emotional decisions, manage exposure carefully, and remember that false breakouts can occur in volatile markets.
Key Takeaway: Bitcoin is attempting to recover, but confirmation above $80,000 is important for a stronger bullish outlook. Until then, cautious trading and close monitoring of support levels remain essential.
Disclaimer: This analysis is for educational and informational purposes only. It is not financial advice. Always do your own research and understand the risks before making any trading decisions.
#BinanceWithdrawalScamWarning #USMidtermElections #USOctoberNFP-AreRateCutsStillPossible #AppleEarningsAhead-CanStockHitNewHigh #Verify1to1BinanceReserves
Current Price: Around $78,200
Market Trend: Bitcoin is showing a short-term recovery after falling to a six-week low near $76,200. However, the broader short-term structure remains cautious and bearish. Buyers are attempting to regain momentum, but strong resistance remains overhead.
Key Support Levels:
- $77,000 – Immediate support
- $76,300 – Major support
- $75,000 – Next downside target
Key Resistance Levels:
- $78,600 – Immediate resistance
- $79,500 – Important resistance
- $80,000 – Major breakout level
Bullish Scenario: If BTC holds above $77,000 and breaks through $79,500–$80,000 with strong buying volume, bullish momentum could strengthen, potentially opening the way toward $81,450.
Bearish Scenario: If Bitcoin fails to break resistance and drops below $76,300, selling pressure could increase, bringing the $75,000 support zone into focus.
Risk Management: Watch trading volume and daily candle closes before interpreting a breakout. Avoid emotional decisions, manage exposure carefully, and remember that false breakouts can occur in volatile markets.
Key Takeaway: Bitcoin is attempting to recover, but confirmation above $80,000 is important for a stronger bullish outlook. Until then, cautious trading and close monitoring of support levels remain essential.
Disclaimer: This analysis is for educational and informational purposes only. It is not financial advice. Always do your own research and understand the risks before making any trading decisions.
#BinanceWithdrawalScamWarning #USMidtermElections #USOctoberNFP-AreRateCutsStillPossible #AppleEarningsAhead-CanStockHitNewHigh #Verify1to1BinanceReserves
35
·
--
翻訳参照
$BTC Bitcoin (BTC) Market Analysis – November 2, 2026
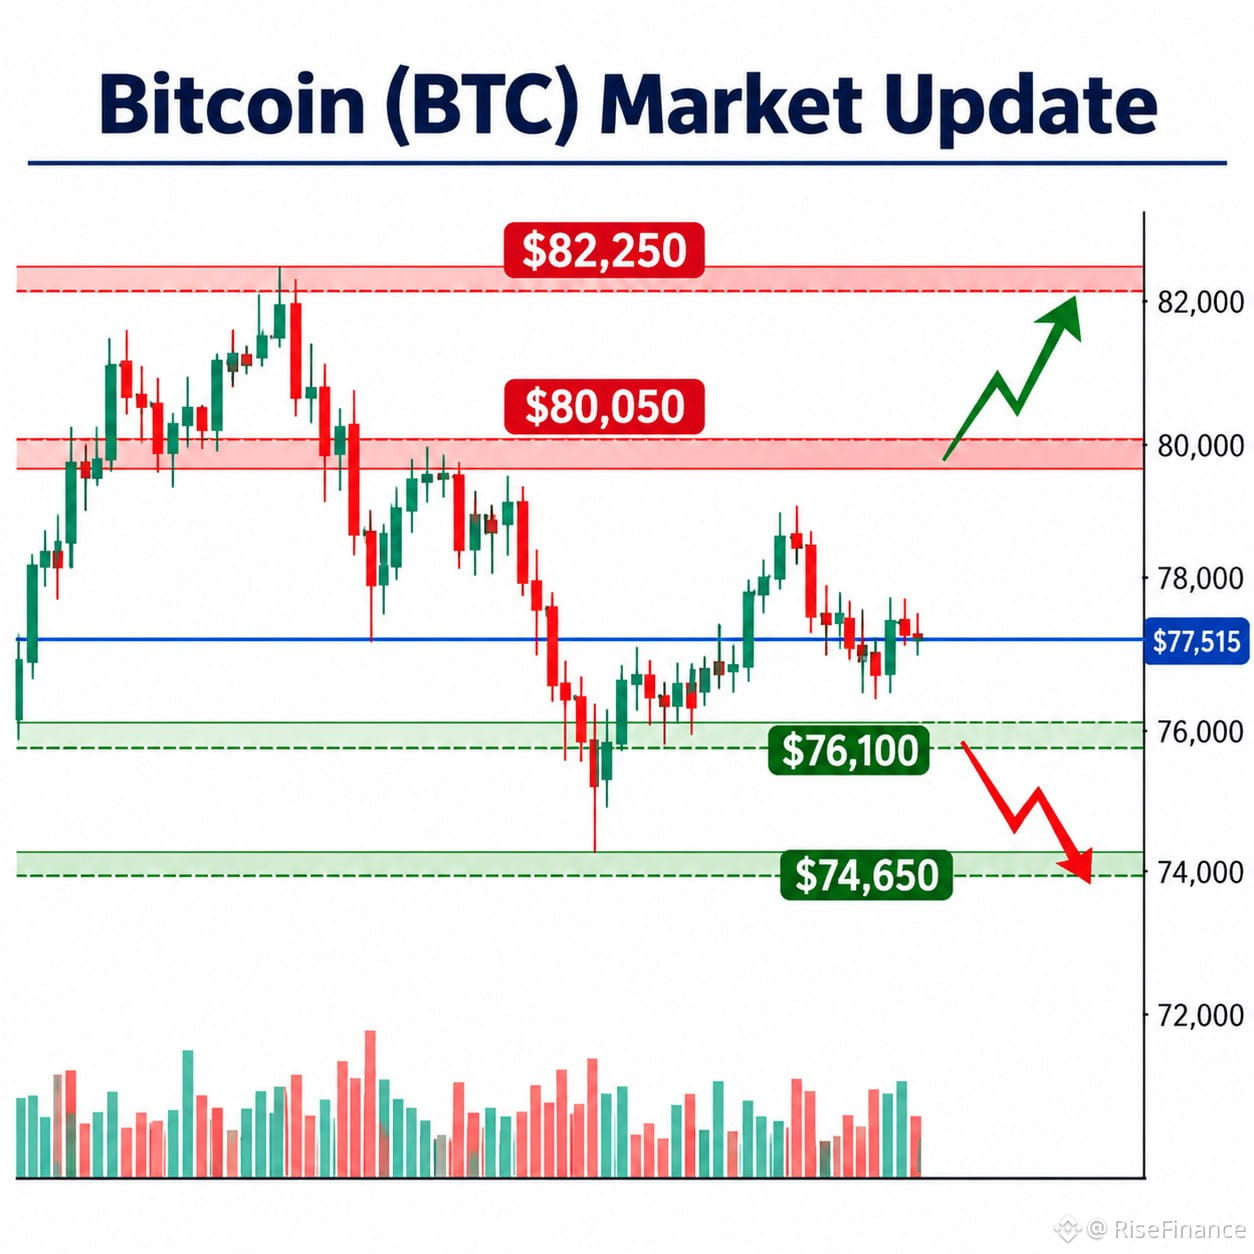
Current BTC Price: Around $77,515
Market Trend: Bitcoin is showing short-term bearish pressure while trading below its 50-day moving average. The market remains cautious, with buyers and sellers competing around important price levels.
Key Support Levels:
- $76,100 – Immediate support
- $74,650 – Next major support
Key Resistance Levels:
- $80,050 – Immediate resistance
- $82,250 – Stronger resistance
Bullish Scenario: If BTC holds above $76,100 and buyers regain momentum, a recovery toward $80,050 could develop. A confirmed breakout above this level may open the way toward $82,250.
Bearish Scenario: If Bitcoin loses the $76,100 support, selling pressure could increase, potentially pushing the price toward $74,650.
Market Outlook: BTC remains under short-term pressure, but the broader market structure still needs confirmation. Traders should watch trading volume and daily candle closes before assuming a trend reversal.
Risk Management: Avoid emotional decisions, use appropriate stop-loss levels, manage position sizes carefully, and wait for confirmation before reacting to breakouts.
Educational Disclaimer: This analysis is for educational purposes only and is not financial advice. Cryptocurrency markets are volatile, so always do your own research.
#BinanceWithdrawalScamWarning #USMidtermElections #USOctoberNFP-AreRateCutsStillPossible #AppleEarningsAhead-CanStockHitNewHigh #Verify1to1BinanceReserves
{spot}(BTCUSDT)
$BTC Bitcoin (BTC) Market Analysis – November 2, 2026
Current BTC Price: Around $77,515
Market Trend: Bitcoin is showing short-term bearish pressure while trading below its 50-day moving average. The market remains cautious, with buyers and sellers competing around important price levels.
Key Support Levels:
- $76,100 – Immediate support
- $74,650 – Next major support
Key Resistance Levels:
- $80,050 – Immediate resistance
- $82,250 – Stronger resistance
Bullish Scenario: If BTC holds above $76,100 and buyers regain momentum, a recovery toward $80,050 could develop. A confirmed breakout above this level may open the way toward $82,250.
Bearish Scenario: If Bitcoin loses the $76,100 support, selling pressure could increase, potentially pushing the price toward $74,650.
Market Outlook: BTC remains under short-term pressure, but the broader market structure still needs confirmation. Traders should watch trading volume and daily candle closes before assuming a trend reversal.
Risk Management: Avoid emotional decisions, use appropriate stop-loss levels, manage position sizes carefully, and wait for confirmation before reacting to breakouts.
Educational Disclaimer: This analysis is for educational purposes only and is not financial advice. Cryptocurrency markets are volatile, so always do your own research.
#BinanceWithdrawalScamWarning #USMidtermElections #USOctoberNFP-AreRateCutsStillPossible #AppleEarningsAhead-CanStockHitNewHigh #Verify1to1BinanceReserves
Current BTC Price: Around $77,515
Market Trend: Bitcoin is showing short-term bearish pressure while trading below its 50-day moving average. The market remains cautious, with buyers and sellers competing around important price levels.
Key Support Levels:
- $76,100 – Immediate support
- $74,650 – Next major support
Key Resistance Levels:
- $80,050 – Immediate resistance
- $82,250 – Stronger resistance
Bullish Scenario: If BTC holds above $76,100 and buyers regain momentum, a recovery toward $80,050 could develop. A confirmed breakout above this level may open the way toward $82,250.
Bearish Scenario: If Bitcoin loses the $76,100 support, selling pressure could increase, potentially pushing the price toward $74,650.
Market Outlook: BTC remains under short-term pressure, but the broader market structure still needs confirmation. Traders should watch trading volume and daily candle closes before assuming a trend reversal.
Risk Management: Avoid emotional decisions, use appropriate stop-loss levels, manage position sizes carefully, and wait for confirmation before reacting to breakouts.
Educational Disclaimer: This analysis is for educational purposes only and is not financial advice. Cryptocurrency markets are volatile, so always do your own research.
#BinanceWithdrawalScamWarning #USMidtermElections #USOctoberNFP-AreRateCutsStillPossible #AppleEarningsAhead-CanStockHitNewHigh #Verify1to1BinanceReserves
50
·
--
翻訳参照
$BTC Bitcoin (BTC) Market Update – November 2, 2026
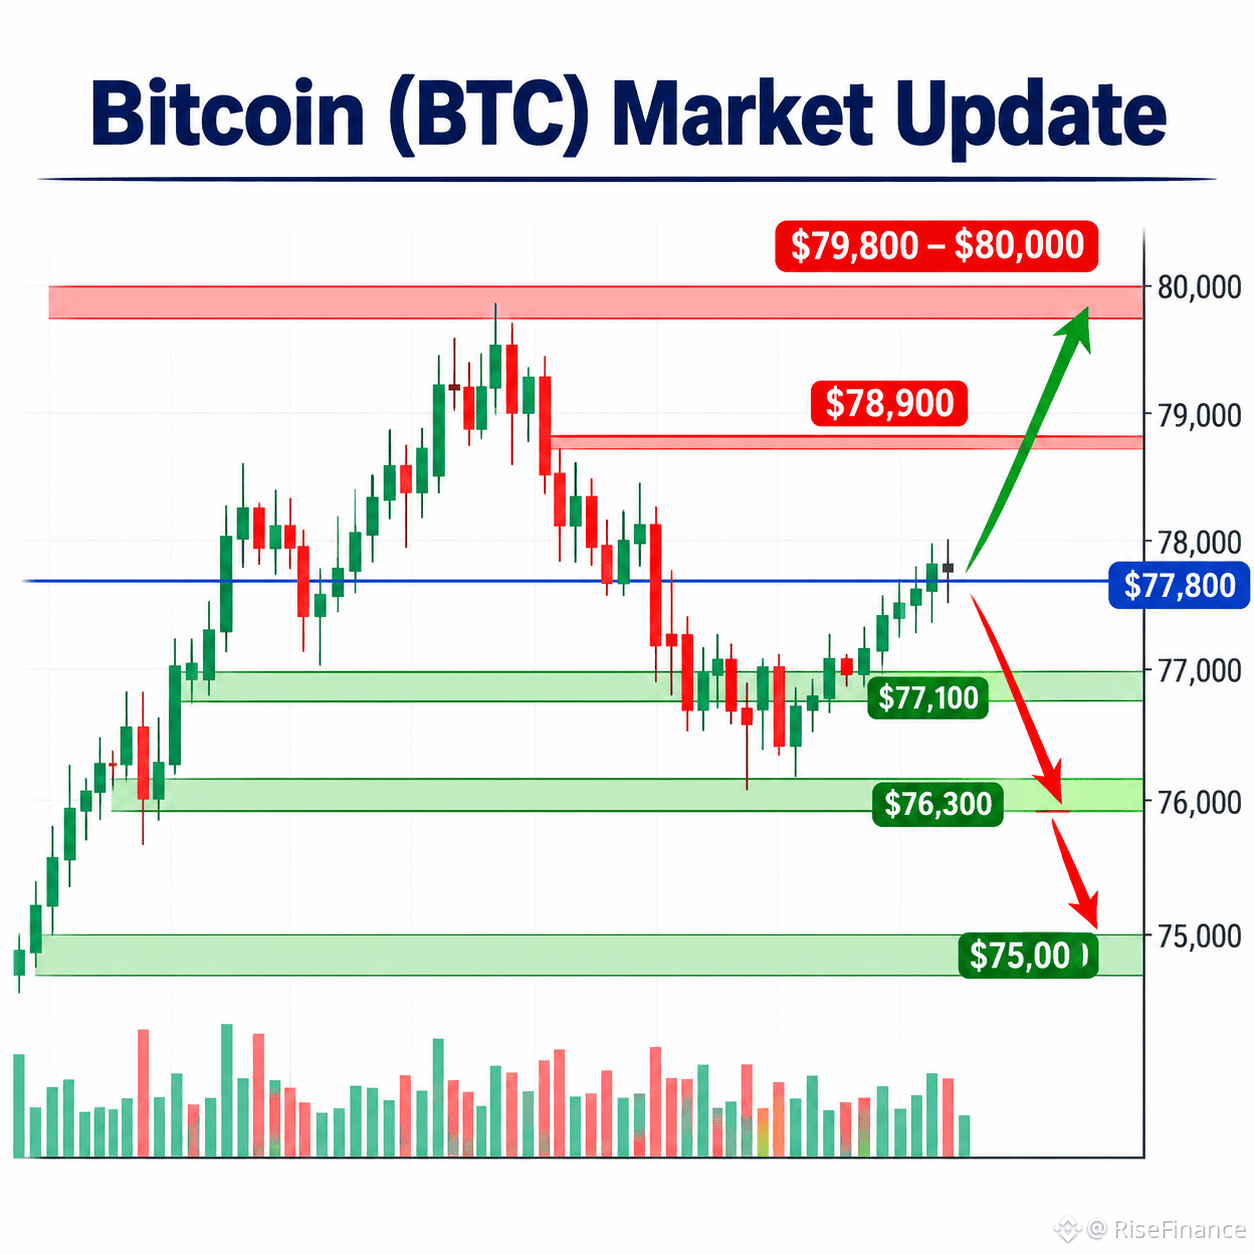
Current Price: $77,800 (approx.)
1. Market Trend: Bitcoin is showing a short-term recovery after recent selling pressure. However, the broader market remains cautious, with BTC still facing resistance around the $79,000–$80,000 zone. The next move depends on whether buyers can maintain momentum.
2. Key Support Levels:
- $77,100 – Immediate support
- $76,300 – Stronger support
- $75,000 – Major downside level
3. Key Resistance Levels:
- $78,900 – Immediate resistance
- $79,800 – Next resistance
- $80,000 – Important psychological level
4. Bullish Scenario: If BTC breaks above $78,900 and maintains momentum, buyers could push the price toward $79,800–$80,000. A sustained breakout above $80,000 may strengthen the bullish outlook.
5. Bearish Scenario: If BTC fails to break resistance and loses the $77,100 support, selling pressure could increase. A breakdown below $76,300 may open the door toward $75,000.
6. Risk Management: Watch trading volume and candle-closing confirmations before considering either direction. Avoid emotional decisions, use appropriate stop-loss levels, and never risk more than you can afford to lose.
Conclusion: Bitcoin is currently at an important decision zone. A confirmed breakout could support recovery, while a loss of key support may bring another downward move. Patience and careful market observation remain important.
Disclaimer: This content is for educational purposes only and is not financial advice. Always do your own research.
#USMidtermsAhead-WhereWillMarketGo #AppleEarningsAhead-CanStockHitNewHigh #Verify1to1BinanceReserves #BinanceRestores28FiatWithdrawals #HKMALaunchesSAGEAgenticFinanceProject
{spot}(BTCUSDT)
$BTC Bitcoin (BTC) Market Update – November 2, 2026
Current Price: $77,800 (approx.)
1. Market Trend: Bitcoin is showing a short-term recovery after recent selling pressure. However, the broader market remains cautious, with BTC still facing resistance around the $79,000–$80,000 zone. The next move depends on whether buyers can maintain momentum.
2. Key Support Levels:
- $77,100 – Immediate support
- $76,300 – Stronger support
- $75,000 – Major downside level
3. Key Resistance Levels:
- $78,900 – Immediate resistance
- $79,800 – Next resistance
- $80,000 – Important psychological level
4. Bullish Scenario: If BTC breaks above $78,900 and maintains momentum, buyers could push the price toward $79,800–$80,000. A sustained breakout above $80,000 may strengthen the bullish outlook.
5. Bearish Scenario: If BTC fails to break resistance and loses the $77,100 support, selling pressure could increase. A breakdown below $76,300 may open the door toward $75,000.
6. Risk Management: Watch trading volume and candle-closing confirmations before considering either direction. Avoid emotional decisions, use appropriate stop-loss levels, and never risk more than you can afford to lose.
Conclusion: Bitcoin is currently at an important decision zone. A confirmed breakout could support recovery, while a loss of key support may bring another downward move. Patience and careful market observation remain important.
Disclaimer: This content is for educational purposes only and is not financial advice. Always do your own research.
#USMidtermsAhead-WhereWillMarketGo #AppleEarningsAhead-CanStockHitNewHigh #Verify1to1BinanceReserves #BinanceRestores28FiatWithdrawals #HKMALaunchesSAGEAgenticFinanceProject
Current Price: $77,800 (approx.)
1. Market Trend: Bitcoin is showing a short-term recovery after recent selling pressure. However, the broader market remains cautious, with BTC still facing resistance around the $79,000–$80,000 zone. The next move depends on whether buyers can maintain momentum.
2. Key Support Levels:
- $77,100 – Immediate support
- $76,300 – Stronger support
- $75,000 – Major downside level
3. Key Resistance Levels:
- $78,900 – Immediate resistance
- $79,800 – Next resistance
- $80,000 – Important psychological level
4. Bullish Scenario: If BTC breaks above $78,900 and maintains momentum, buyers could push the price toward $79,800–$80,000. A sustained breakout above $80,000 may strengthen the bullish outlook.
5. Bearish Scenario: If BTC fails to break resistance and loses the $77,100 support, selling pressure could increase. A breakdown below $76,300 may open the door toward $75,000.
6. Risk Management: Watch trading volume and candle-closing confirmations before considering either direction. Avoid emotional decisions, use appropriate stop-loss levels, and never risk more than you can afford to lose.
Conclusion: Bitcoin is currently at an important decision zone. A confirmed breakout could support recovery, while a loss of key support may bring another downward move. Patience and careful market observation remain important.
Disclaimer: This content is for educational purposes only and is not financial advice. Always do your own research.
#USMidtermsAhead-WhereWillMarketGo #AppleEarningsAhead-CanStockHitNewHigh #Verify1to1BinanceReserves #BinanceRestores28FiatWithdrawals #HKMALaunchesSAGEAgenticFinanceProject
6
·
--
翻訳参照
$BTC Bitcoin (BTC) Market Analysis – November 2, 2026
Current Price: Around $78,200
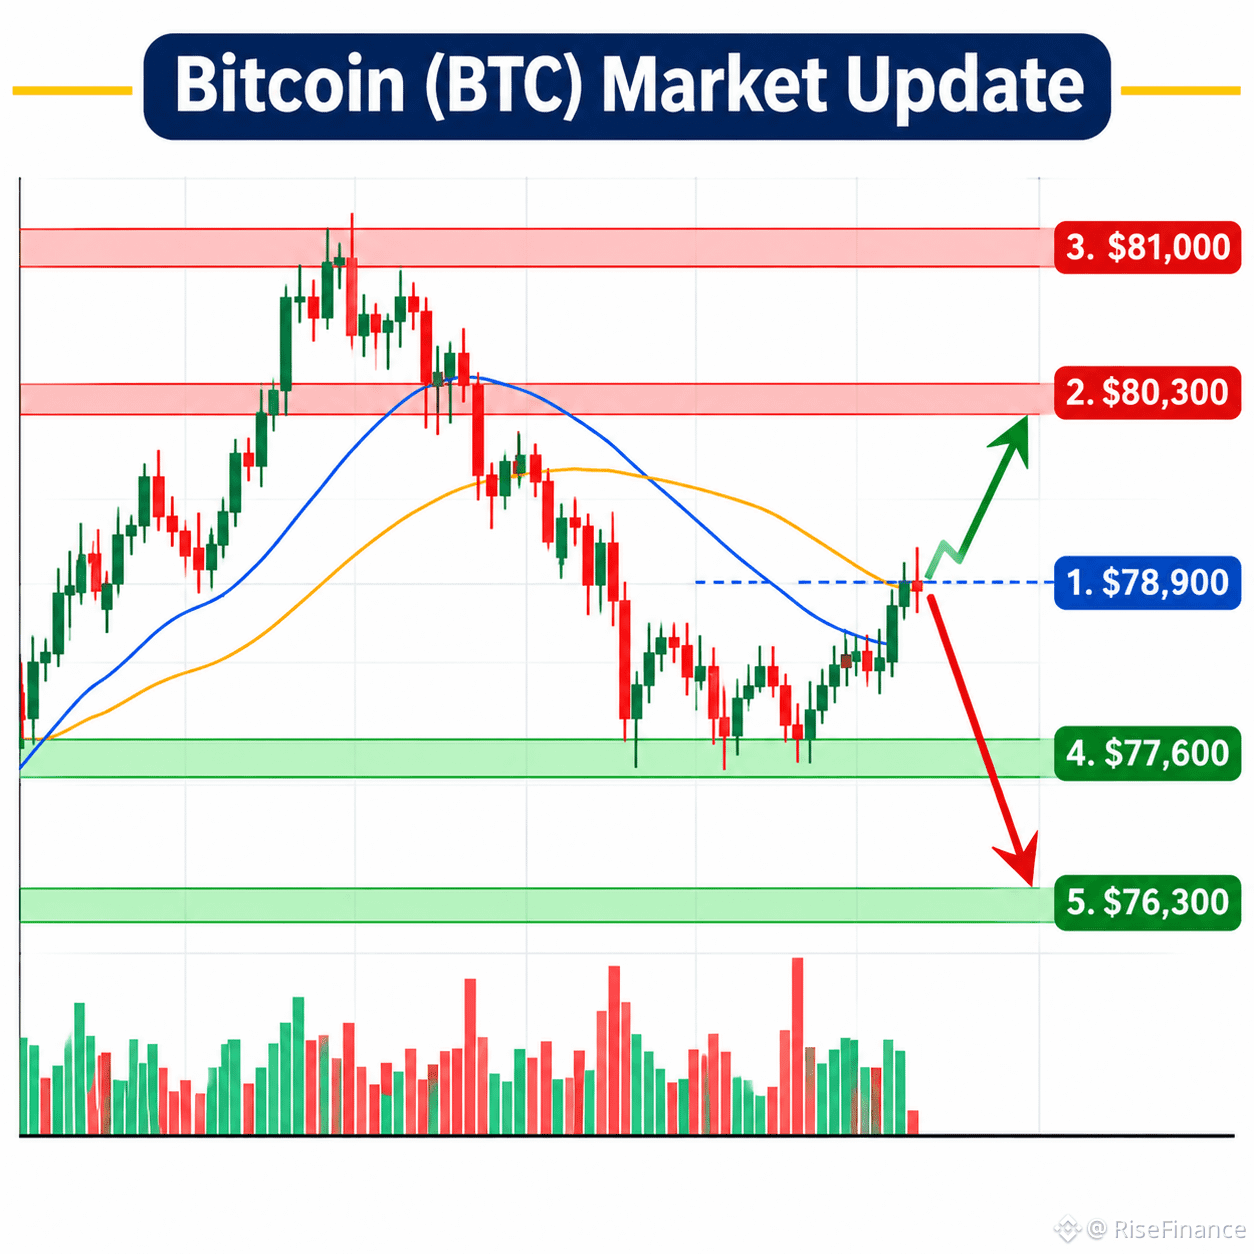
Market Trend: Bitcoin is showing a short-term sideways recovery after recent selling pressure. Buyers are attempting to stabilize the price, but the broader short-term trend remains cautious. BTC is still trading below its important 20-day and 50-day moving averages near $80,300.
Key Support Levels:
- $77,600 – Immediate support
- $76,300 – Major support
- $75,600 – Stronger downside support
Key Resistance Levels:
- $78,900 – Immediate resistance
- $80,300 – Major resistance zone
- $81,000 – Next upside barrier
Bullish Scenario: If BTC holds above $77,600 and breaks through $78,900, buyers could push the price toward $80,300. A strong daily close above this zone may improve bullish momentum.
Bearish Scenario: If Bitcoin loses the $77,600 support, selling pressure could increase toward $76,300 and potentially $75,600.
Risk Management: Watch for confirmed candle closes rather than reacting to sudden price movements. Avoid excessive leverage, manage position sizes carefully, and always consider volatility before making decisions.
Educational Disclaimer: This analysis is for educational purposes only and is not financial advice. Always do your own research (DYOR).
#BinanceRestores28FiatWithdrawals #HKMALaunchesSAGEAgenticFinanceProject #ETHFalls16.1%InOctober #SouthKoreaPlans11%TaxOnUSStockPerpetualFutures #BitcoinClosesAbove50WeekMAFor7thStraightWeek
{spot}(BTCUSDT)
$BTC Bitcoin (BTC) Market Analysis – November 2, 2026
Current Price: Around $78,200
Market Trend: Bitcoin is showing a short-term sideways recovery after recent selling pressure. Buyers are attempting to stabilize the price, but the broader short-term trend remains cautious. BTC is still trading below its important 20-day and 50-day moving averages near $80,300.
Key Support Levels:
- $77,600 – Immediate support
- $76,300 – Major support
- $75,600 – Stronger downside support
Key Resistance Levels:
- $78,900 – Immediate resistance
- $80,300 – Major resistance zone
- $81,000 – Next upside barrier
Bullish Scenario: If BTC holds above $77,600 and breaks through $78,900, buyers could push the price toward $80,300. A strong daily close above this zone may improve bullish momentum.
Bearish Scenario: If Bitcoin loses the $77,600 support, selling pressure could increase toward $76,300 and potentially $75,600.
Risk Management: Watch for confirmed candle closes rather than reacting to sudden price movements. Avoid excessive leverage, manage position sizes carefully, and always consider volatility before making decisions.
Educational Disclaimer: This analysis is for educational purposes only and is not financial advice. Always do your own research (DYOR).
#BinanceRestores28FiatWithdrawals #HKMALaunchesSAGEAgenticFinanceProject #ETHFalls16.1%InOctober #SouthKoreaPlans11%TaxOnUSStockPerpetualFutures #BitcoinClosesAbove50WeekMAFor7thStraightWeek
Current Price: Around $78,200
Market Trend: Bitcoin is showing a short-term sideways recovery after recent selling pressure. Buyers are attempting to stabilize the price, but the broader short-term trend remains cautious. BTC is still trading below its important 20-day and 50-day moving averages near $80,300.
Key Support Levels:
- $77,600 – Immediate support
- $76,300 – Major support
- $75,600 – Stronger downside support
Key Resistance Levels:
- $78,900 – Immediate resistance
- $80,300 – Major resistance zone
- $81,000 – Next upside barrier
Bullish Scenario: If BTC holds above $77,600 and breaks through $78,900, buyers could push the price toward $80,300. A strong daily close above this zone may improve bullish momentum.
Bearish Scenario: If Bitcoin loses the $77,600 support, selling pressure could increase toward $76,300 and potentially $75,600.
Risk Management: Watch for confirmed candle closes rather than reacting to sudden price movements. Avoid excessive leverage, manage position sizes carefully, and always consider volatility before making decisions.
Educational Disclaimer: This analysis is for educational purposes only and is not financial advice. Always do your own research (DYOR).
#BinanceRestores28FiatWithdrawals #HKMALaunchesSAGEAgenticFinanceProject #ETHFalls16.1%InOctober #SouthKoreaPlans11%TaxOnUSStockPerpetualFutures #BitcoinClosesAbove50WeekMAFor7thStraightWeek
9
·
--
$BTC ビットコイン(BTC)市場アップデート | 2026年11月2日
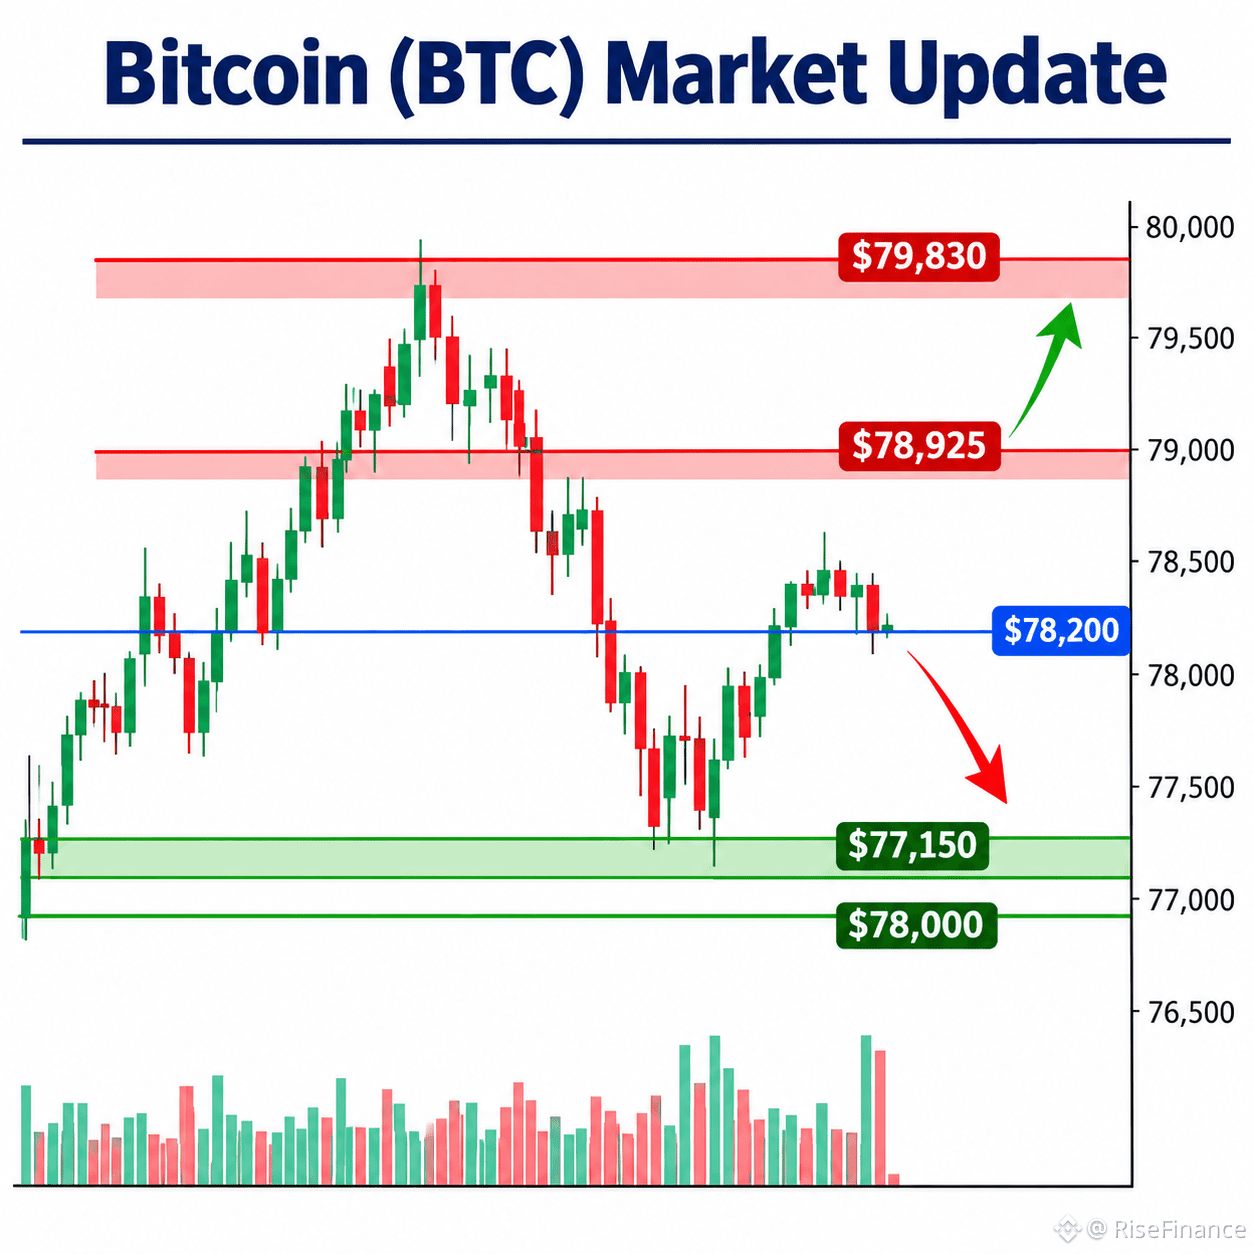
現在価格:約78,200ドル
市場動向:ビットコインは方向感の定まらない値動きを見せており、過去24時間では小幅に回復したものの、短期的な弱さは依然として見られます。買い手と売り手が明確な方向性を見いだせず、市場には引き続き慎重な姿勢が見られます。
主なサポート水準:78,000ドル~77,150ドル
主なレジスタンス水準:78,925ドル~79,830ドル
強気シナリオ:BTCが78,000ドルを上回って推移し、強い買いの出来高を伴って78,925ドルのレジスタンスを突破すれば、79,830ドルに向けて上昇し、さらに上の水準を試す可能性があります。
弱気シナリオ:ビットコインが78,000ドルのサポートを下回ると、売り圧力によって77,150ドルに向かう可能性があります。さらに下落すれば、市場心理が悪化するおそれがあります。
リスク管理:ブレイクアウトを判断する前に、ローソク足の終値と取引量を確認してください。感情的な判断を避け、ポジションサイズを慎重に管理し、潜在的な損失を常に考慮しましょう。
免責事項:この分析は教育目的のみであり、金融アドバイスではありません。暗号資産市場は価格変動が非常に大きいため、必ずご自身で調査してください。
#BinanceRestores28FiatWithdrawals #ETHFalls16.1%InOctober #BitcoinClosesAbove50WeekMAFor7thStraightWeek #IndiaRBIAndFIUReviewOverseasCryptoCards #SolanaMobileRemovesMaliciousSKRClaimApp
{spot}(BTCUSDT)
$BTC ビットコイン(BTC)市場アップデート | 2026年11月2日
現在価格:約78,200ドル
市場動向:ビットコインは方向感の定まらない値動きを見せており、過去24時間では小幅に回復したものの、短期的な弱さは依然として見られます。買い手と売り手が明確な方向性を見いだせず、市場には引き続き慎重な姿勢が見られます。
主なサポート水準:78,000ドル~77,150ドル
主なレジスタンス水準:78,925ドル~79,830ドル
強気シナリオ:BTCが78,000ドルを上回って推移し、強い買いの出来高を伴って78,925ドルのレジスタンスを突破すれば、79,830ドルに向けて上昇し、さらに上の水準を試す可能性があります。
弱気シナリオ:ビットコインが78,000ドルのサポートを下回ると、売り圧力によって77,150ドルに向かう可能性があります。さらに下落すれば、市場心理が悪化するおそれがあります。
リスク管理:ブレイクアウトを判断する前に、ローソク足の終値と取引量を確認してください。感情的な判断を避け、ポジションサイズを慎重に管理し、潜在的な損失を常に考慮しましょう。
免責事項:この分析は教育目的のみであり、金融アドバイスではありません。暗号資産市場は価格変動が非常に大きいため、必ずご自身で調査してください。
#BinanceRestores28FiatWithdrawals #ETHFalls16.1%InOctober #BitcoinClosesAbove50WeekMAFor7thStraightWeek #IndiaRBIAndFIUReviewOverseasCryptoCards #SolanaMobileRemovesMaliciousSKRClaimApp
現在価格:約78,200ドル
市場動向:ビットコインは方向感の定まらない値動きを見せており、過去24時間では小幅に回復したものの、短期的な弱さは依然として見られます。買い手と売り手が明確な方向性を見いだせず、市場には引き続き慎重な姿勢が見られます。
主なサポート水準:78,000ドル~77,150ドル
主なレジスタンス水準:78,925ドル~79,830ドル
強気シナリオ:BTCが78,000ドルを上回って推移し、強い買いの出来高を伴って78,925ドルのレジスタンスを突破すれば、79,830ドルに向けて上昇し、さらに上の水準を試す可能性があります。
弱気シナリオ:ビットコインが78,000ドルのサポートを下回ると、売り圧力によって77,150ドルに向かう可能性があります。さらに下落すれば、市場心理が悪化するおそれがあります。
リスク管理:ブレイクアウトを判断する前に、ローソク足の終値と取引量を確認してください。感情的な判断を避け、ポジションサイズを慎重に管理し、潜在的な損失を常に考慮しましょう。
免責事項:この分析は教育目的のみであり、金融アドバイスではありません。暗号資産市場は価格変動が非常に大きいため、必ずご自身で調査してください。
#BinanceRestores28FiatWithdrawals #ETHFalls16.1%InOctober #BitcoinClosesAbove50WeekMAFor7thStraightWeek #IndiaRBIAndFIUReviewOverseasCryptoCards #SolanaMobileRemovesMaliciousSKRClaimApp
94
·
--
翻訳参照
$BTC Bitcoin (BTC) Market Update – November 2, 2026
Current Market Trend: Short-Term Bearish, With an Intraday Recovery
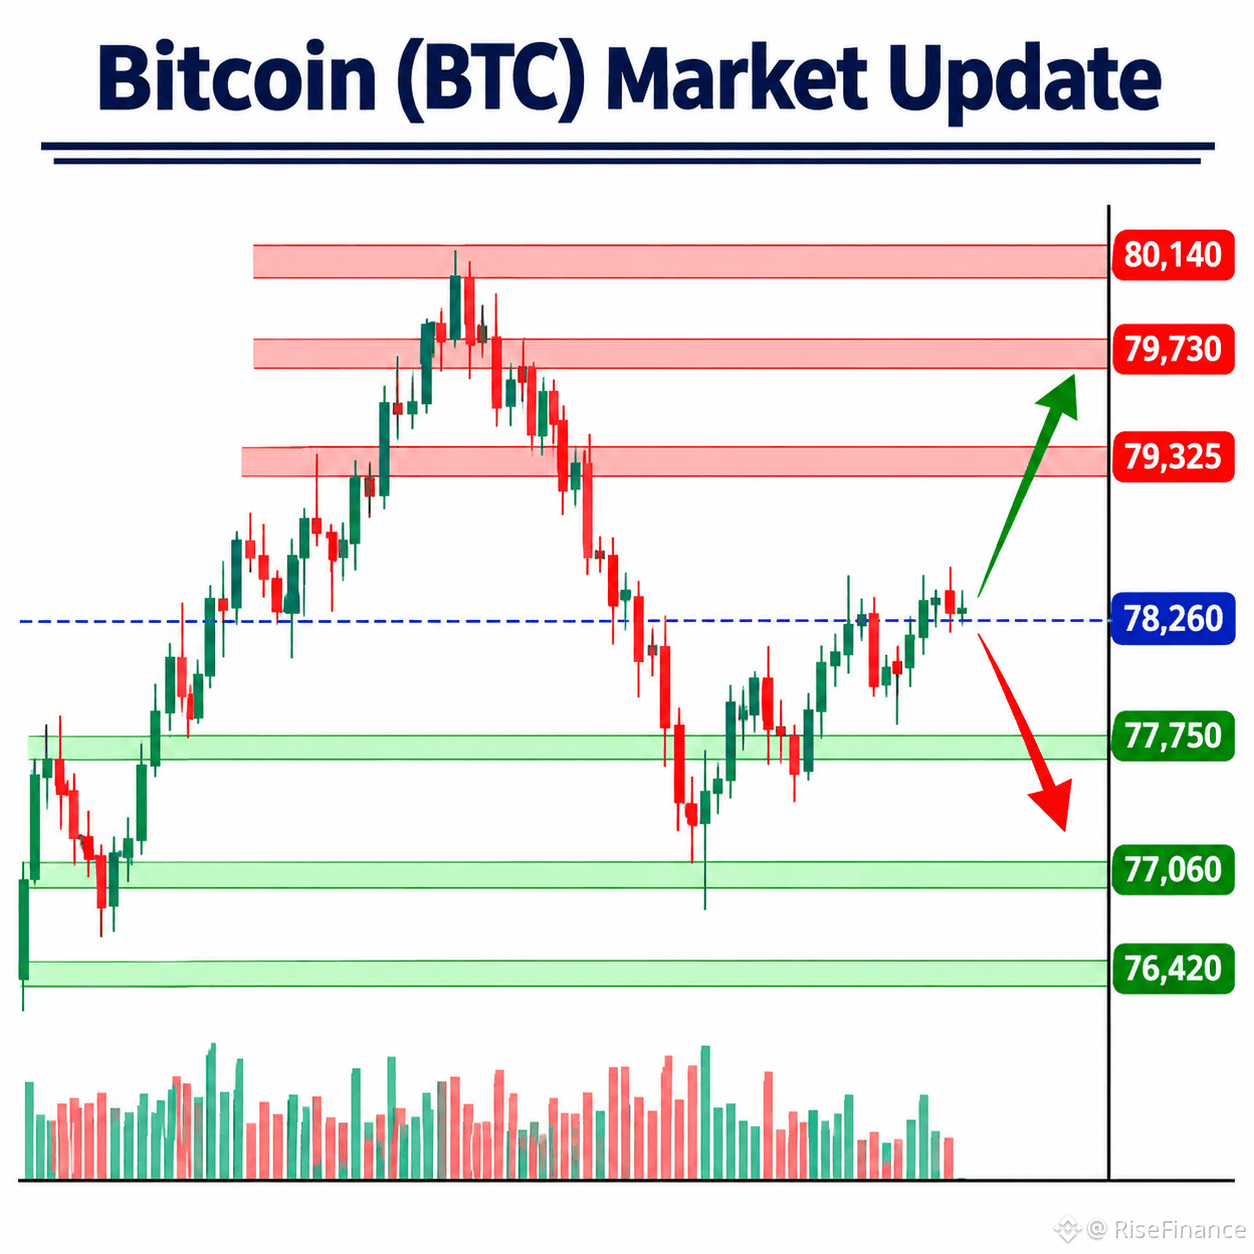
Bitcoin is trading around $78,260, showing a modest recovery after recent selling pressure. However, the broader short-term trend remains cautious, as BTC is still facing resistance above its current price.
Key Support Levels:
- $77,750 – Immediate support
- $77,060 – Secondary support
- $76,420 – Major support
Key Resistance Levels:
- $79,325 – First resistance
- $79,730 – Second resistance
- $80,140 – Major resistance
Bullish Scenario: If BTC holds above $77,750 and breaks through $79,325, buyers could push the price toward $79,730 and $80,140.
Bearish Scenario: If Bitcoin loses the $77,750 support, selling pressure could increase, potentially bringing $77,060 and $76,420 into focus.
Risk Management: Watch for confirmed candle closes before interpreting breakouts. Avoid emotional decisions, manage position sizes carefully, and always consider market volatility.
What comes next? Will Bitcoin recover above $80,000 or face another rejection?
Disclaimer: This analysis is for educational purposes only and should not be considered financial advice. Cryptocurrency markets involve significant risk.
#BrazilVirtualAssetLicenseDeadlineDrawsAbout40Firms #BTCPayServerUrgesOperatorsToShutDownInstances #BinanceUpdatesProofofReservesAddresses #StudyFindsCircleAIAgentWalletLimitsCanBeBypassed
{spot}(BTCUSDT)
$BTC Bitcoin (BTC) Market Update – November 2, 2026
Current Market Trend: Short-Term Bearish, With an Intraday Recovery
Bitcoin is trading around $78,260, showing a modest recovery after recent selling pressure. However, the broader short-term trend remains cautious, as BTC is still facing resistance above its current price.
Key Support Levels:
- $77,750 – Immediate support
- $77,060 – Secondary support
- $76,420 – Major support
Key Resistance Levels:
- $79,325 – First resistance
- $79,730 – Second resistance
- $80,140 – Major resistance
Bullish Scenario: If BTC holds above $77,750 and breaks through $79,325, buyers could push the price toward $79,730 and $80,140.
Bearish Scenario: If Bitcoin loses the $77,750 support, selling pressure could increase, potentially bringing $77,060 and $76,420 into focus.
Risk Management: Watch for confirmed candle closes before interpreting breakouts. Avoid emotional decisions, manage position sizes carefully, and always consider market volatility.
What comes next? Will Bitcoin recover above $80,000 or face another rejection?
Disclaimer: This analysis is for educational purposes only and should not be considered financial advice. Cryptocurrency markets involve significant risk.
#BrazilVirtualAssetLicenseDeadlineDrawsAbout40Firms #BTCPayServerUrgesOperatorsToShutDownInstances #BinanceUpdatesProofofReservesAddresses #StudyFindsCircleAIAgentWalletLimitsCanBeBypassed
Current Market Trend: Short-Term Bearish, With an Intraday Recovery
Bitcoin is trading around $78,260, showing a modest recovery after recent selling pressure. However, the broader short-term trend remains cautious, as BTC is still facing resistance above its current price.
Key Support Levels:
- $77,750 – Immediate support
- $77,060 – Secondary support
- $76,420 – Major support
Key Resistance Levels:
- $79,325 – First resistance
- $79,730 – Second resistance
- $80,140 – Major resistance
Bullish Scenario: If BTC holds above $77,750 and breaks through $79,325, buyers could push the price toward $79,730 and $80,140.
Bearish Scenario: If Bitcoin loses the $77,750 support, selling pressure could increase, potentially bringing $77,060 and $76,420 into focus.
Risk Management: Watch for confirmed candle closes before interpreting breakouts. Avoid emotional decisions, manage position sizes carefully, and always consider market volatility.
What comes next? Will Bitcoin recover above $80,000 or face another rejection?
Disclaimer: This analysis is for educational purposes only and should not be considered financial advice. Cryptocurrency markets involve significant risk.
#BrazilVirtualAssetLicenseDeadlineDrawsAbout40Firms #BTCPayServerUrgesOperatorsToShutDownInstances #BinanceUpdatesProofofReservesAddresses #StudyFindsCircleAIAgentWalletLimitsCanBeBypassed
15
·
--
翻訳参照
$BTC Bitcoin (BTC) Market Update – November 1, 2026
Current Market Trend: Cautiously Bearish
Bitcoin is trading around $77,567, showing a modest recovery of approximately 1% over the last 24 hours. However, BTC remains down around 3.7% over the past seven days, suggesting that broader short-term pressure is still present.
Key Support Levels:
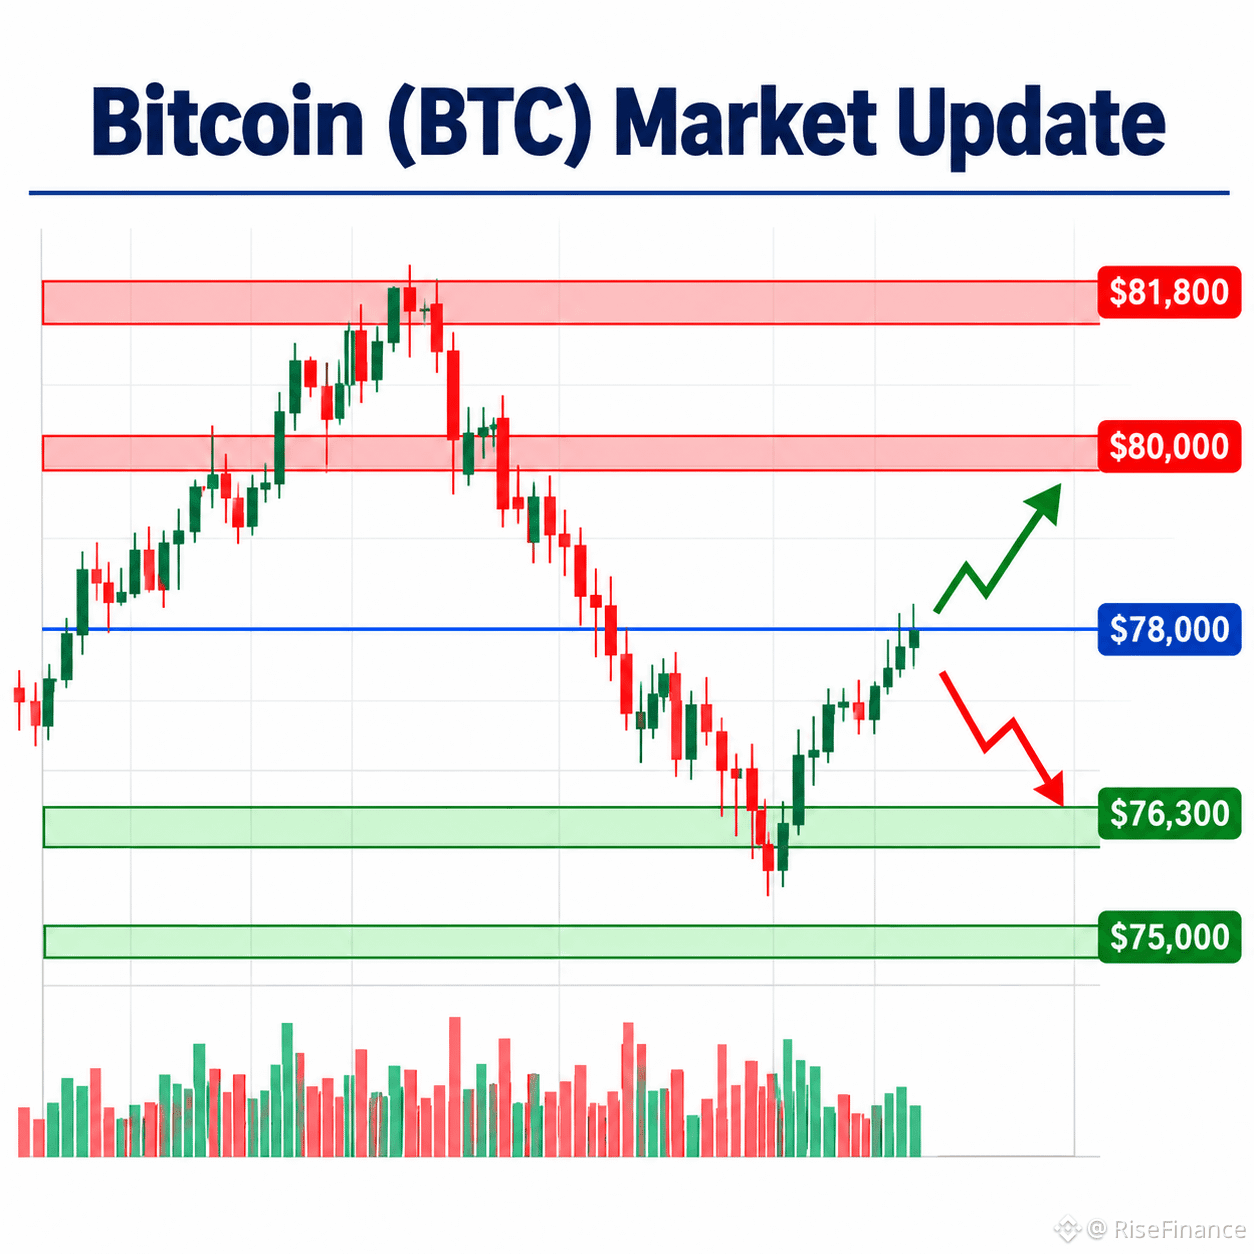
- $76,600 – Immediate support
- $76,300 – Stronger short-term support
- $75,000 – Psychological support
Key Resistance Levels:
- $78,000 – Immediate resistance
- $80,000 – Major resistance
- $81,800 – Higher resistance zone
Bullish Scenario:
If BTC breaks above $78,000 and maintains momentum, buyers could push the price toward $80,000 and potentially $81,800. Strong trading volume would support this recovery.
Bearish Scenario:
If Bitcoin fails to hold the $76,300 support zone, selling pressure could increase, potentially bringing $75,000 into focus.
Market Outlook:
BTC is showing signs of a short-term recovery, but the broader trend remains under pressure. Traders should watch the $78,000 resistance and $76,300 support for confirmation of the next move.
Risk Management:
Avoid emotional trading, manage position sizes carefully, and always consider stop-loss levels. Wait for clear confirmation rather than reacting to sudden price movements.
Disclaimer: This analysis is for educational and informational purposes only. It is not financial advice. Always conduct your own research before making any trading decisions.
#BinanceUpdatesProofofReservesAddresses #BinanceToResumePhaseOneOfWithdrawals #CZDismissesClaimsBinanceHackWasPredicted #B14gReportsUnauthorizedTransferOfAbout97MCORE #USSpotETHETFsPost23StraightDaysOfNetOutflows
{spot}(BTCUSDT)
$BTC Bitcoin (BTC) Market Update – November 1, 2026
Current Market Trend: Cautiously Bearish
Bitcoin is trading around $77,567, showing a modest recovery of approximately 1% over the last 24 hours. However, BTC remains down around 3.7% over the past seven days, suggesting that broader short-term pressure is still present.
Key Support Levels:
- $76,600 – Immediate support
- $76,300 – Stronger short-term support
- $75,000 – Psychological support
Key Resistance Levels:
- $78,000 – Immediate resistance
- $80,000 – Major resistance
- $81,800 – Higher resistance zone
Bullish Scenario:
If BTC breaks above $78,000 and maintains momentum, buyers could push the price toward $80,000 and potentially $81,800. Strong trading volume would support this recovery.
Bearish Scenario:
If Bitcoin fails to hold the $76,300 support zone, selling pressure could increase, potentially bringing $75,000 into focus.
Market Outlook:
BTC is showing signs of a short-term recovery, but the broader trend remains under pressure. Traders should watch the $78,000 resistance and $76,300 support for confirmation of the next move.
Risk Management:
Avoid emotional trading, manage position sizes carefully, and always consider stop-loss levels. Wait for clear confirmation rather than reacting to sudden price movements.
Disclaimer: This analysis is for educational and informational purposes only. It is not financial advice. Always conduct your own research before making any trading decisions.
#BinanceUpdatesProofofReservesAddresses #BinanceToResumePhaseOneOfWithdrawals #CZDismissesClaimsBinanceHackWasPredicted #B14gReportsUnauthorizedTransferOfAbout97MCORE #USSpotETHETFsPost23StraightDaysOfNetOutflows
Current Market Trend: Cautiously Bearish
Bitcoin is trading around $77,567, showing a modest recovery of approximately 1% over the last 24 hours. However, BTC remains down around 3.7% over the past seven days, suggesting that broader short-term pressure is still present.
Key Support Levels:
- $76,600 – Immediate support
- $76,300 – Stronger short-term support
- $75,000 – Psychological support
Key Resistance Levels:
- $78,000 – Immediate resistance
- $80,000 – Major resistance
- $81,800 – Higher resistance zone
Bullish Scenario:
If BTC breaks above $78,000 and maintains momentum, buyers could push the price toward $80,000 and potentially $81,800. Strong trading volume would support this recovery.
Bearish Scenario:
If Bitcoin fails to hold the $76,300 support zone, selling pressure could increase, potentially bringing $75,000 into focus.
Market Outlook:
BTC is showing signs of a short-term recovery, but the broader trend remains under pressure. Traders should watch the $78,000 resistance and $76,300 support for confirmation of the next move.
Risk Management:
Avoid emotional trading, manage position sizes carefully, and always consider stop-loss levels. Wait for clear confirmation rather than reacting to sudden price movements.
Disclaimer: This analysis is for educational and informational purposes only. It is not financial advice. Always conduct your own research before making any trading decisions.
#BinanceUpdatesProofofReservesAddresses #BinanceToResumePhaseOneOfWithdrawals #CZDismissesClaimsBinanceHackWasPredicted #B14gReportsUnauthorizedTransferOfAbout97MCORE #USSpotETHETFsPost23StraightDaysOfNetOutflows
21
·
--
翻訳参照
$BTC Bitcoin (BTC) Market Analysis | November 1, 2026
Current Price: Around $77,800
Market Trend: Bitcoin is showing a short-term recovery, gaining around 1% in the last 24 hours. However, the weekly trend remains under pressure, with BTC still down approximately 3.7% over seven days.
Key Support Levels:
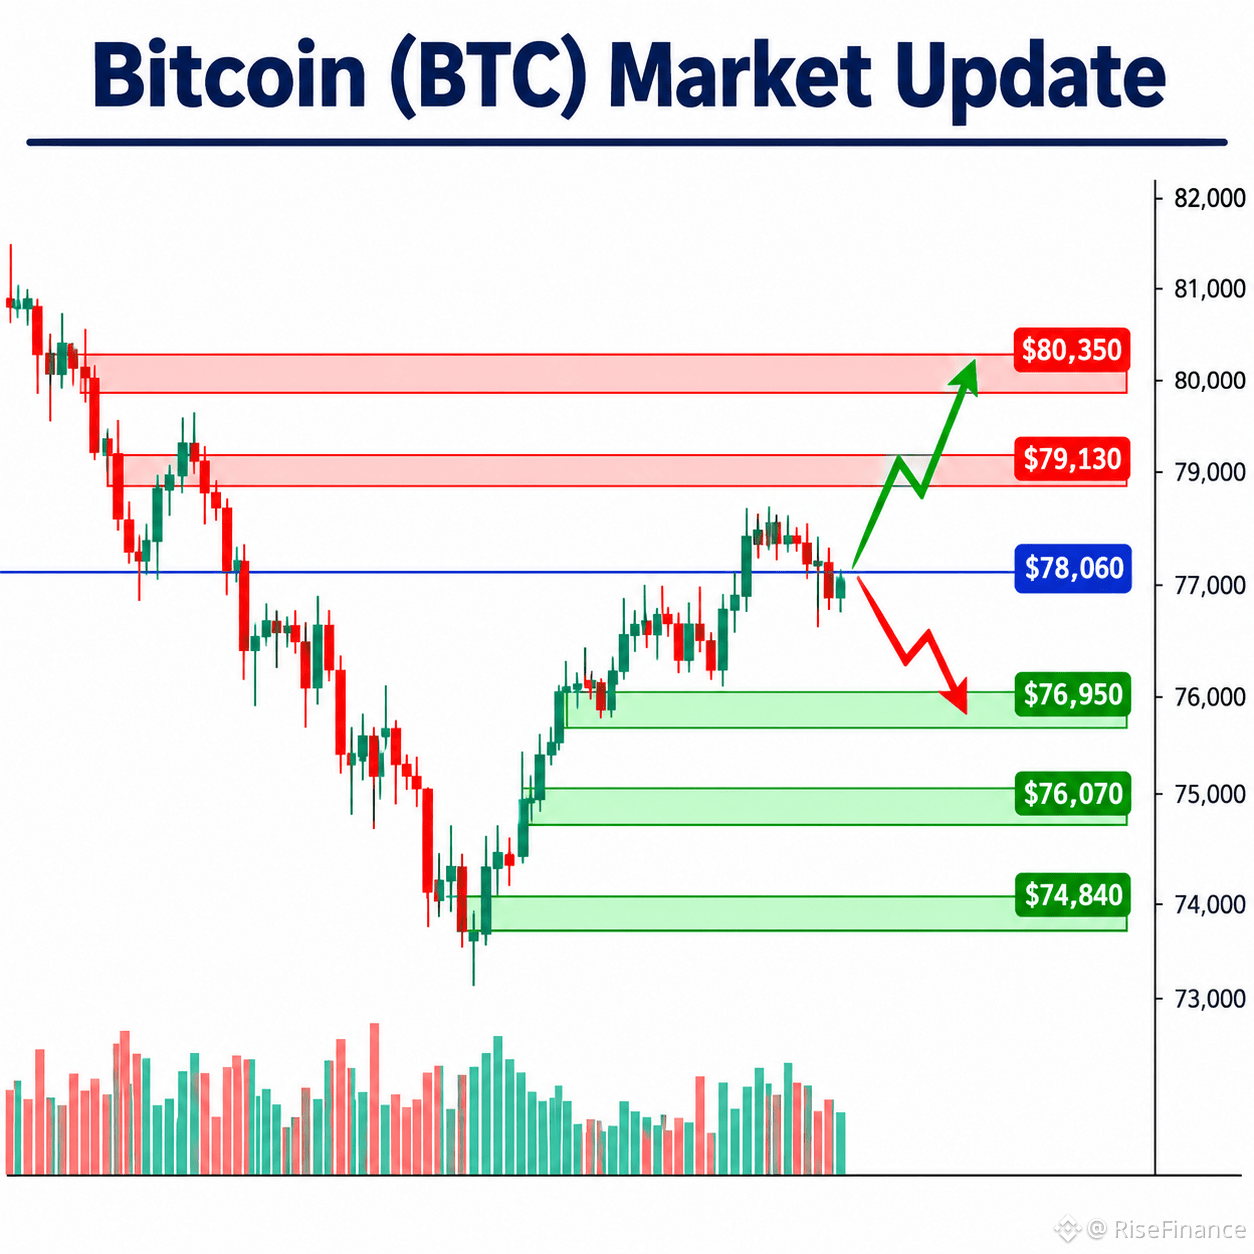
- $76,950 – Immediate support
- $76,070 – Next support
- $74,840 – Stronger downside support
Key Resistance Levels:
- $78,060 – Immediate resistance
- $79,130 – Next resistance
- $80,350 – Major resistance zone
Bullish Scenario: If BTC breaks above $78,060 and holds this level, buyers could push the price towards $79,130 and potentially $80,350.
Bearish Scenario: If Bitcoin fails to break resistance and drops below $76,950, selling pressure could increase, bringing $76,070 and $74,840 into focus.
Risk Management: Watch for confirmed candle closes before considering a breakout. Avoid emotional trading, manage position sizes carefully, and always consider market volatility.
Educational Disclaimer: This analysis is for educational purposes only and is not financial advice. Always do your own research before making trading decisions.
#BinanceUpdatesProofofReservesAddresses #BinanceToResumePhaseOneOfWithdrawals #BinanceSAFUFundTransferCompleted7499BTC #CZDismissesClaimsBinanceHackWasPredicted #B14gReportsUnauthorizedTransferOfAbout97MCORE
{spot}(BTCUSDT)
$BTC Bitcoin (BTC) Market Analysis | November 1, 2026
Current Price: Around $77,800
Market Trend: Bitcoin is showing a short-term recovery, gaining around 1% in the last 24 hours. However, the weekly trend remains under pressure, with BTC still down approximately 3.7% over seven days.
Key Support Levels:
- $76,950 – Immediate support
- $76,070 – Next support
- $74,840 – Stronger downside support
Key Resistance Levels:
- $78,060 – Immediate resistance
- $79,130 – Next resistance
- $80,350 – Major resistance zone
Bullish Scenario: If BTC breaks above $78,060 and holds this level, buyers could push the price towards $79,130 and potentially $80,350.
Bearish Scenario: If Bitcoin fails to break resistance and drops below $76,950, selling pressure could increase, bringing $76,070 and $74,840 into focus.
Risk Management: Watch for confirmed candle closes before considering a breakout. Avoid emotional trading, manage position sizes carefully, and always consider market volatility.
Educational Disclaimer: This analysis is for educational purposes only and is not financial advice. Always do your own research before making trading decisions.
#BinanceUpdatesProofofReservesAddresses #BinanceToResumePhaseOneOfWithdrawals #BinanceSAFUFundTransferCompleted7499BTC #CZDismissesClaimsBinanceHackWasPredicted #B14gReportsUnauthorizedTransferOfAbout97MCORE
Current Price: Around $77,800
Market Trend: Bitcoin is showing a short-term recovery, gaining around 1% in the last 24 hours. However, the weekly trend remains under pressure, with BTC still down approximately 3.7% over seven days.
Key Support Levels:
- $76,950 – Immediate support
- $76,070 – Next support
- $74,840 – Stronger downside support
Key Resistance Levels:
- $78,060 – Immediate resistance
- $79,130 – Next resistance
- $80,350 – Major resistance zone
Bullish Scenario: If BTC breaks above $78,060 and holds this level, buyers could push the price towards $79,130 and potentially $80,350.
Bearish Scenario: If Bitcoin fails to break resistance and drops below $76,950, selling pressure could increase, bringing $76,070 and $74,840 into focus.
Risk Management: Watch for confirmed candle closes before considering a breakout. Avoid emotional trading, manage position sizes carefully, and always consider market volatility.
Educational Disclaimer: This analysis is for educational purposes only and is not financial advice. Always do your own research before making trading decisions.
#BinanceUpdatesProofofReservesAddresses #BinanceToResumePhaseOneOfWithdrawals #BinanceSAFUFundTransferCompleted7499BTC #CZDismissesClaimsBinanceHackWasPredicted #B14gReportsUnauthorizedTransferOfAbout97MCORE
11
·
--
翻訳参照
$BTC Bitcoin (BTC) Market Analysis – November 1, 2026
Current Price: Around $78,000
Market Trend: Bitcoin is showing a short-term recovery, but the overall market structure remains cautious. Selling pressure is still visible on higher timeframes, while buyers are attempting to regain control. The market needs a confirmed breakout before a stronger bullish trend can develop.
Key Support Levels:
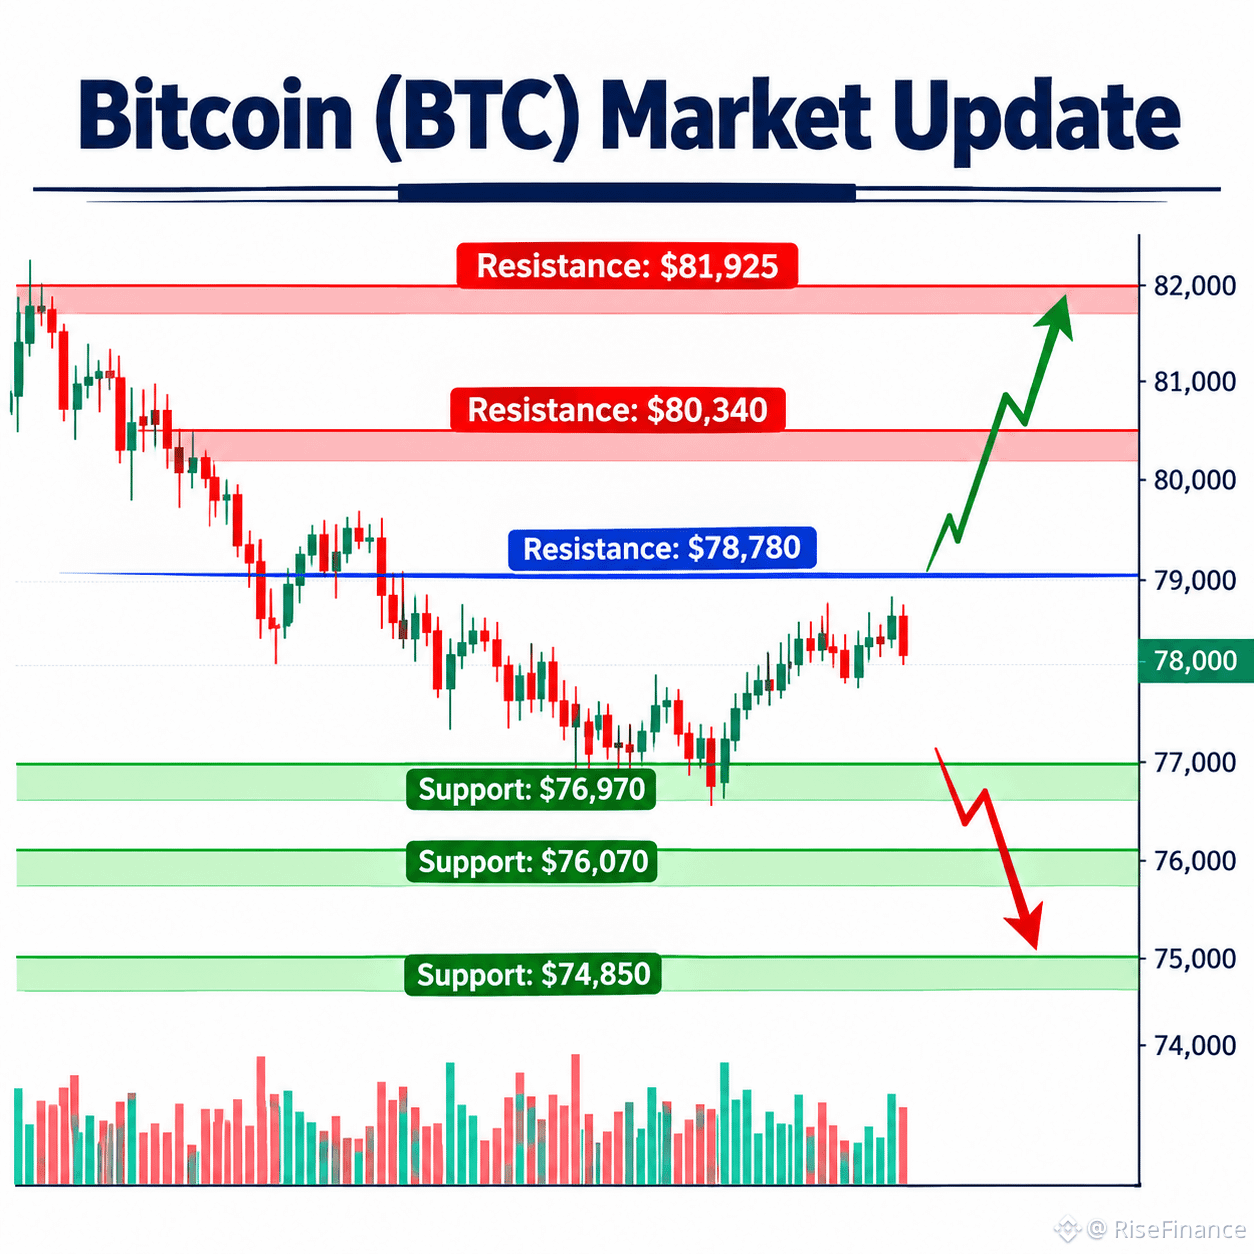
- $76,970 – Immediate support
- $76,070 – Major support
- $74,850 – Next downside support
Key Resistance Levels:
- $78,780 – Immediate resistance
- $80,340 – Strong resistance
- $81,925 – Major breakout level
Bullish Scenario 📈
If BTC holds above $76,970 and breaks through $78,780 with strong buying volume, the price could move towards $80,340 and potentially $81,925.
Bearish Scenario 📉
If Bitcoin loses the $76,970 support, selling pressure could increase. A further decline may bring $76,070 and $74,850 into focus.
Risk Management
Avoid emotional trading and chasing sudden price movements. Always use proper stop-loss levels, manage position size, and wait for confirmation before making trading decisions.
Market Outlook: Bitcoin remains in a cautious recovery phase. The next confirmed breakout or breakdown will help determine its short-term direction.
Disclaimer: This analysis is for educational purposes only and is not financial advice. Cryptocurrency markets are highly volatile. Always do your own research before making any trading decisions.
#BinanceUpdatesProofofReservesAddresses #BinanceToResumePhaseOneOfWithdrawals #BinanceSAFUFundTransferCompleted7499BTC #CZDismissesClaimsBinanceHackWasPredicted #YiHe:ProofOfReserves:10TokensAt100%Backing
{spot}(BTCUSDT)
$BTC Bitcoin (BTC) Market Analysis – November 1, 2026
Current Price: Around $78,000
Market Trend: Bitcoin is showing a short-term recovery, but the overall market structure remains cautious. Selling pressure is still visible on higher timeframes, while buyers are attempting to regain control. The market needs a confirmed breakout before a stronger bullish trend can develop.
Key Support Levels:
- $76,970 – Immediate support
- $76,070 – Major support
- $74,850 – Next downside support
Key Resistance Levels:
- $78,780 – Immediate resistance
- $80,340 – Strong resistance
- $81,925 – Major breakout level
Bullish Scenario 📈
If BTC holds above $76,970 and breaks through $78,780 with strong buying volume, the price could move towards $80,340 and potentially $81,925.
Bearish Scenario 📉
If Bitcoin loses the $76,970 support, selling pressure could increase. A further decline may bring $76,070 and $74,850 into focus.
Risk Management
Avoid emotional trading and chasing sudden price movements. Always use proper stop-loss levels, manage position size, and wait for confirmation before making trading decisions.
Market Outlook: Bitcoin remains in a cautious recovery phase. The next confirmed breakout or breakdown will help determine its short-term direction.
Disclaimer: This analysis is for educational purposes only and is not financial advice. Cryptocurrency markets are highly volatile. Always do your own research before making any trading decisions.
#BinanceUpdatesProofofReservesAddresses #BinanceToResumePhaseOneOfWithdrawals #BinanceSAFUFundTransferCompleted7499BTC #CZDismissesClaimsBinanceHackWasPredicted #YiHe:ProofOfReserves:10TokensAt100%Backing
Current Price: Around $78,000
Market Trend: Bitcoin is showing a short-term recovery, but the overall market structure remains cautious. Selling pressure is still visible on higher timeframes, while buyers are attempting to regain control. The market needs a confirmed breakout before a stronger bullish trend can develop.
Key Support Levels:
- $76,970 – Immediate support
- $76,070 – Major support
- $74,850 – Next downside support
Key Resistance Levels:
- $78,780 – Immediate resistance
- $80,340 – Strong resistance
- $81,925 – Major breakout level
Bullish Scenario 📈
If BTC holds above $76,970 and breaks through $78,780 with strong buying volume, the price could move towards $80,340 and potentially $81,925.
Bearish Scenario 📉
If Bitcoin loses the $76,970 support, selling pressure could increase. A further decline may bring $76,070 and $74,850 into focus.
Risk Management
Avoid emotional trading and chasing sudden price movements. Always use proper stop-loss levels, manage position size, and wait for confirmation before making trading decisions.
Market Outlook: Bitcoin remains in a cautious recovery phase. The next confirmed breakout or breakdown will help determine its short-term direction.
Disclaimer: This analysis is for educational purposes only and is not financial advice. Cryptocurrency markets are highly volatile. Always do your own research before making any trading decisions.
#BinanceUpdatesProofofReservesAddresses #BinanceToResumePhaseOneOfWithdrawals #BinanceSAFUFundTransferCompleted7499BTC #CZDismissesClaimsBinanceHackWasPredicted #YiHe:ProofOfReserves:10TokensAt100%Backing
43
·
--
翻訳参照
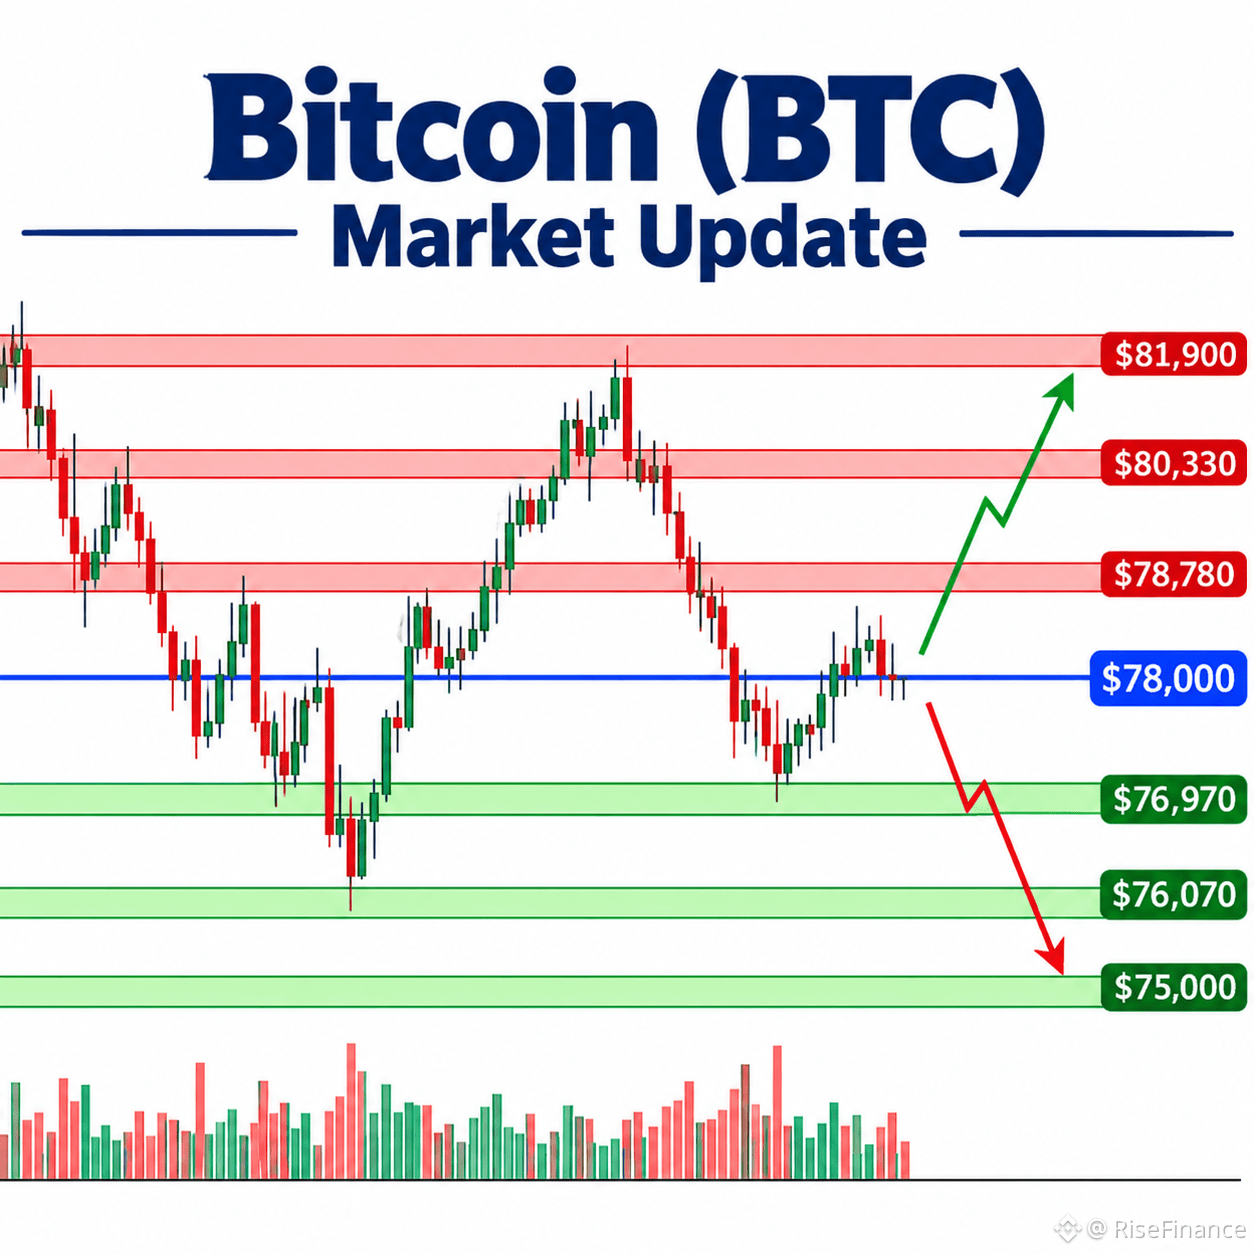
$BTC Bitcoin (BTC) Market Update 📊
Current Price: Around $78,000
Market Trend: Bitcoin is showing a mixed market structure. Short-term momentum remains weak, while the broader trend is still trying to recover. Buyers and sellers are fighting around the $78K zone.
Key Support Levels:
- $76,970
- $76,070
- $75,000
Key Resistance Levels:
- $78,780
- $80,330
- $81,900
Bullish Scenario 🟢
If BTC holds above $76,970 and breaks through $78,780 with strong trading volume, buyers could push the price toward $80,330 and potentially $81,900.
Bearish Scenario 🔴
If Bitcoin loses the $76,970 support, selling pressure could increase. A further decline may bring $76,070 and $75,000 into focus.
Risk Management ⚠️
Avoid entering trades based on emotions. Wait for confirmed breakouts, use proper stop-loss levels, and keep position sizes under control. Always consider market volatility.
Final Thoughts:
Bitcoin is at an important decision zone. A confirmed breakout above resistance could improve market sentiment, while a breakdown below support may increase bearish pressure. Watch price action and volume before making any decisions.
Disclaimer: This analysis is for educational purposes only and is not financial advice. Cryptocurrency trading involves significant risk.
#BinanceUpdatesProofofReservesAddresses #BinanceToResumePhaseOneOfWithdrawals #BinanceSAFUFundTransferCompleted7499BTC #CZDismissesClaimsBinanceHackWasPredicted #YiHe:ProofOfReserves:10TokensAt100%Backing
{spot}(BTCUSDT)
$BTC Bitcoin (BTC) Market Update 📊
Current Price: Around $78,000
Market Trend: Bitcoin is showing a mixed market structure. Short-term momentum remains weak, while the broader trend is still trying to recover. Buyers and sellers are fighting around the $78K zone.
Key Support Levels:
- $76,970
- $76,070
- $75,000
Key Resistance Levels:
- $78,780
- $80,330
- $81,900
Bullish Scenario 🟢
If BTC holds above $76,970 and breaks through $78,780 with strong trading volume, buyers could push the price toward $80,330 and potentially $81,900.
Bearish Scenario 🔴
If Bitcoin loses the $76,970 support, selling pressure could increase. A further decline may bring $76,070 and $75,000 into focus.
Risk Management ⚠️
Avoid entering trades based on emotions. Wait for confirmed breakouts, use proper stop-loss levels, and keep position sizes under control. Always consider market volatility.
Final Thoughts:
Bitcoin is at an important decision zone. A confirmed breakout above resistance could improve market sentiment, while a breakdown below support may increase bearish pressure. Watch price action and volume before making any decisions.
Disclaimer: This analysis is for educational purposes only and is not financial advice. Cryptocurrency trading involves significant risk.
#BinanceUpdatesProofofReservesAddresses #BinanceToResumePhaseOneOfWithdrawals #BinanceSAFUFundTransferCompleted7499BTC #CZDismissesClaimsBinanceHackWasPredicted #YiHe:ProofOfReserves:10TokensAt100%Backing
Current Price: Around $78,000
Market Trend: Bitcoin is showing a mixed market structure. Short-term momentum remains weak, while the broader trend is still trying to recover. Buyers and sellers are fighting around the $78K zone.
Key Support Levels:
- $76,970
- $76,070
- $75,000
Key Resistance Levels:
- $78,780
- $80,330
- $81,900
Bullish Scenario 🟢
If BTC holds above $76,970 and breaks through $78,780 with strong trading volume, buyers could push the price toward $80,330 and potentially $81,900.
Bearish Scenario 🔴
If Bitcoin loses the $76,970 support, selling pressure could increase. A further decline may bring $76,070 and $75,000 into focus.
Risk Management ⚠️
Avoid entering trades based on emotions. Wait for confirmed breakouts, use proper stop-loss levels, and keep position sizes under control. Always consider market volatility.
Final Thoughts:
Bitcoin is at an important decision zone. A confirmed breakout above resistance could improve market sentiment, while a breakdown below support may increase bearish pressure. Watch price action and volume before making any decisions.
Disclaimer: This analysis is for educational purposes only and is not financial advice. Cryptocurrency trading involves significant risk.
#BinanceUpdatesProofofReservesAddresses #BinanceToResumePhaseOneOfWithdrawals #BinanceSAFUFundTransferCompleted7499BTC #CZDismissesClaimsBinanceHackWasPredicted #YiHe:ProofOfReserves:10TokensAt100%Backing
45
·
--
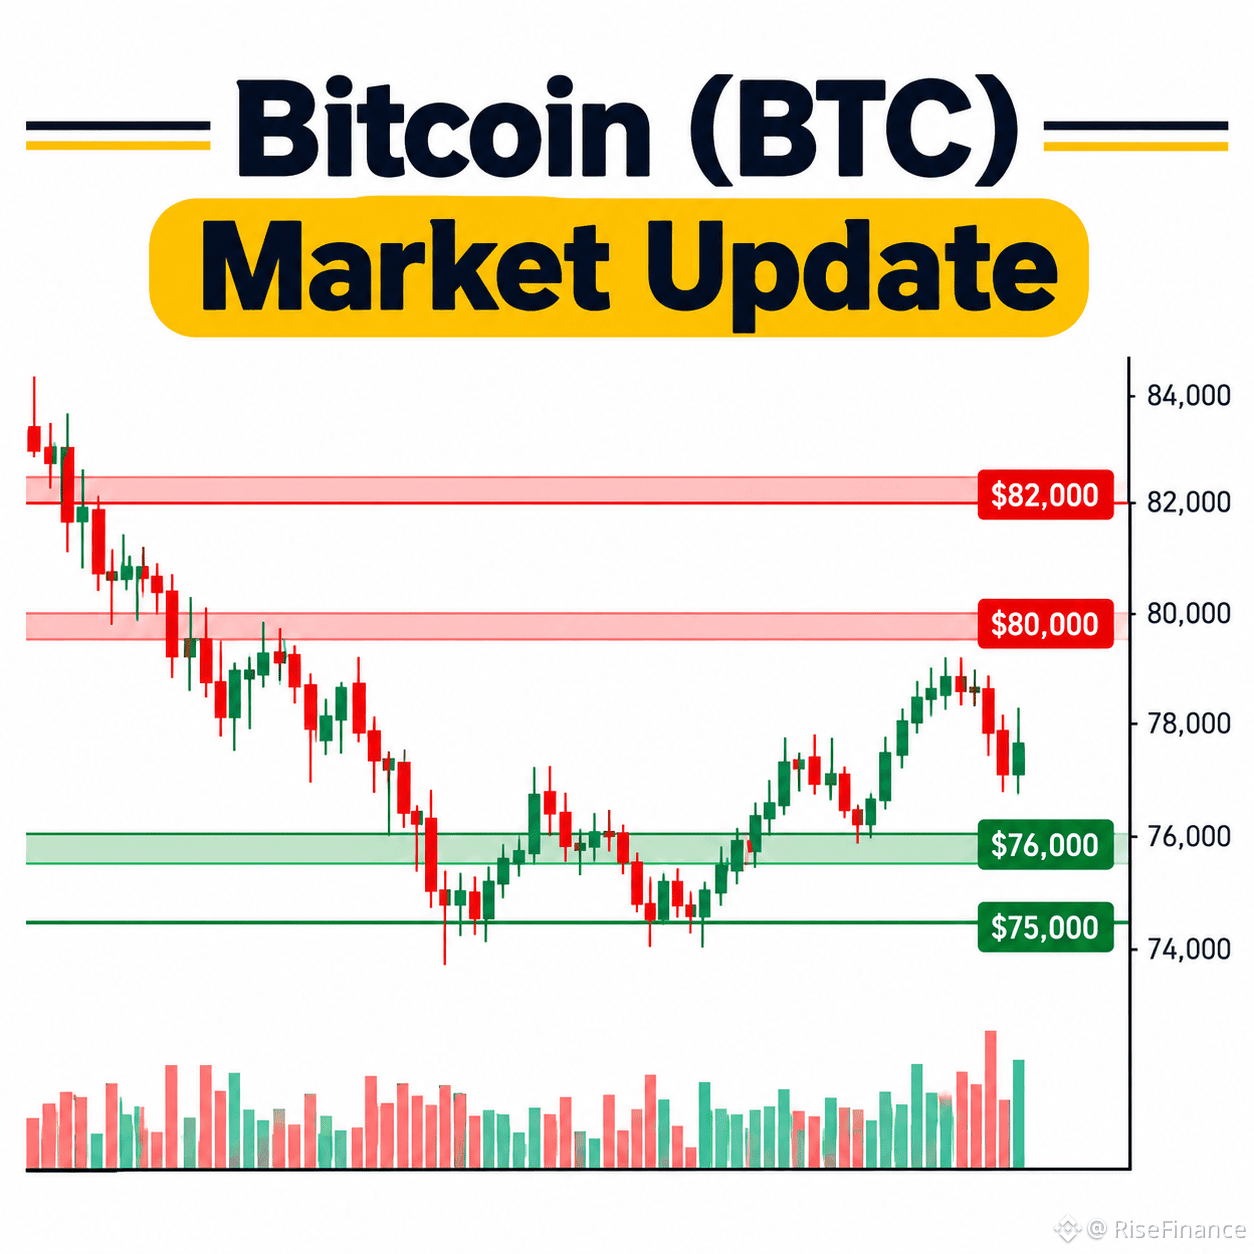
$BTC ビットコイン(BTC)市場アップデート | 2026年11月1日
市場動向:ビットコインは77,761ドル付近で取引されており、過去24時間で小幅に回復しています。しかし、BTCが最近80,000ドルを下回ったため、より広い短期的な相場構造は依然として弱気です。持続的な回復を確認するには、買い手がより強い勢いを示す必要があります。
**主なサポート水準:**
- 77,000~76,000ドル:目先のサポートゾーン
- 75,000ドル:注目すべき主要サポート
**主なレジスタンス水準:**
- 78,500~80,000ドル:目先のレジスタンスゾーン
- 82,000ドル:強気の勢いが強まった場合の回復目標となる可能性
**強気シナリオ:** BTCが76,000ドルを上回って維持し、強い取引高を伴って80,000ドルを突破すれば、価格は82,000ドルに向かう可能性があります。
**弱気シナリオ:** BTCが76,000ドルのサポートゾーンを割り込むと、売り圧力によって価格が75,000ドル、またはそれ以下まで下落する可能性があります。
**リスク管理:** ブレイクアウトを確認する前に、ローソク足の終値と取引高を確認しましょう。感情的な判断を避け、適切なポジションサイズを用い、ご自身のリスク許容度に応じて損切り水準を検討してください。
**結論:** ビットコインは、買い手が強さを示す必要のある重要な水準にあります。次にブレイクアウトまたは下落が確認されれば、方向性がより明確になる可能性があります。
*免責事項:このコンテンツは教育目的のみであり、金融上の助言ではありません。暗号資産市場は非常に変動が大きく、損失が発生する可能性があります。*
#BinanceUpdatesProofofReservesAddresses #BinanceToResumePhaseOneOfWithdrawals #BinanceSAFUFundTransferCompleted7499BTC #CZDismissesClaimsBinanceHackWasPredicted #YiHe:ProofOfReserves:10TokensAt100%Backing
{spot}(BTCUSDT)
$BTC ビットコイン(BTC)市場アップデート | 2026年11月1日
市場動向:ビットコインは77,761ドル付近で取引されており、過去24時間で小幅に回復しています。しかし、BTCが最近80,000ドルを下回ったため、より広い短期的な相場構造は依然として弱気です。持続的な回復を確認するには、買い手がより強い勢いを示す必要があります。
**主なサポート水準:**
- 77,000~76,000ドル:目先のサポートゾーン
- 75,000ドル:注目すべき主要サポート
**主なレジスタンス水準:**
- 78,500~80,000ドル:目先のレジスタンスゾーン
- 82,000ドル:強気の勢いが強まった場合の回復目標となる可能性
**強気シナリオ:** BTCが76,000ドルを上回って維持し、強い取引高を伴って80,000ドルを突破すれば、価格は82,000ドルに向かう可能性があります。
**弱気シナリオ:** BTCが76,000ドルのサポートゾーンを割り込むと、売り圧力によって価格が75,000ドル、またはそれ以下まで下落する可能性があります。
**リスク管理:** ブレイクアウトを確認する前に、ローソク足の終値と取引高を確認しましょう。感情的な判断を避け、適切なポジションサイズを用い、ご自身のリスク許容度に応じて損切り水準を検討してください。
**結論:** ビットコインは、買い手が強さを示す必要のある重要な水準にあります。次にブレイクアウトまたは下落が確認されれば、方向性がより明確になる可能性があります。
*免責事項:このコンテンツは教育目的のみであり、金融上の助言ではありません。暗号資産市場は非常に変動が大きく、損失が発生する可能性があります。*
#BinanceUpdatesProofofReservesAddresses #BinanceToResumePhaseOneOfWithdrawals #BinanceSAFUFundTransferCompleted7499BTC #CZDismissesClaimsBinanceHackWasPredicted #YiHe:ProofOfReserves:10TokensAt100%Backing
市場動向:ビットコインは77,761ドル付近で取引されており、過去24時間で小幅に回復しています。しかし、BTCが最近80,000ドルを下回ったため、より広い短期的な相場構造は依然として弱気です。持続的な回復を確認するには、買い手がより強い勢いを示す必要があります。
**主なサポート水準:**
- 77,000~76,000ドル:目先のサポートゾーン
- 75,000ドル:注目すべき主要サポート
**主なレジスタンス水準:**
- 78,500~80,000ドル:目先のレジスタンスゾーン
- 82,000ドル:強気の勢いが強まった場合の回復目標となる可能性
**強気シナリオ:** BTCが76,000ドルを上回って維持し、強い取引高を伴って80,000ドルを突破すれば、価格は82,000ドルに向かう可能性があります。
**弱気シナリオ:** BTCが76,000ドルのサポートゾーンを割り込むと、売り圧力によって価格が75,000ドル、またはそれ以下まで下落する可能性があります。
**リスク管理:** ブレイクアウトを確認する前に、ローソク足の終値と取引高を確認しましょう。感情的な判断を避け、適切なポジションサイズを用い、ご自身のリスク許容度に応じて損切り水準を検討してください。
**結論:** ビットコインは、買い手が強さを示す必要のある重要な水準にあります。次にブレイクアウトまたは下落が確認されれば、方向性がより明確になる可能性があります。
*免責事項:このコンテンツは教育目的のみであり、金融上の助言ではありません。暗号資産市場は非常に変動が大きく、損失が発生する可能性があります。*
#BinanceUpdatesProofofReservesAddresses #BinanceToResumePhaseOneOfWithdrawals #BinanceSAFUFundTransferCompleted7499BTC #CZDismissesClaimsBinanceHackWasPredicted #YiHe:ProofOfReserves:10TokensAt100%Backing
72
·
--
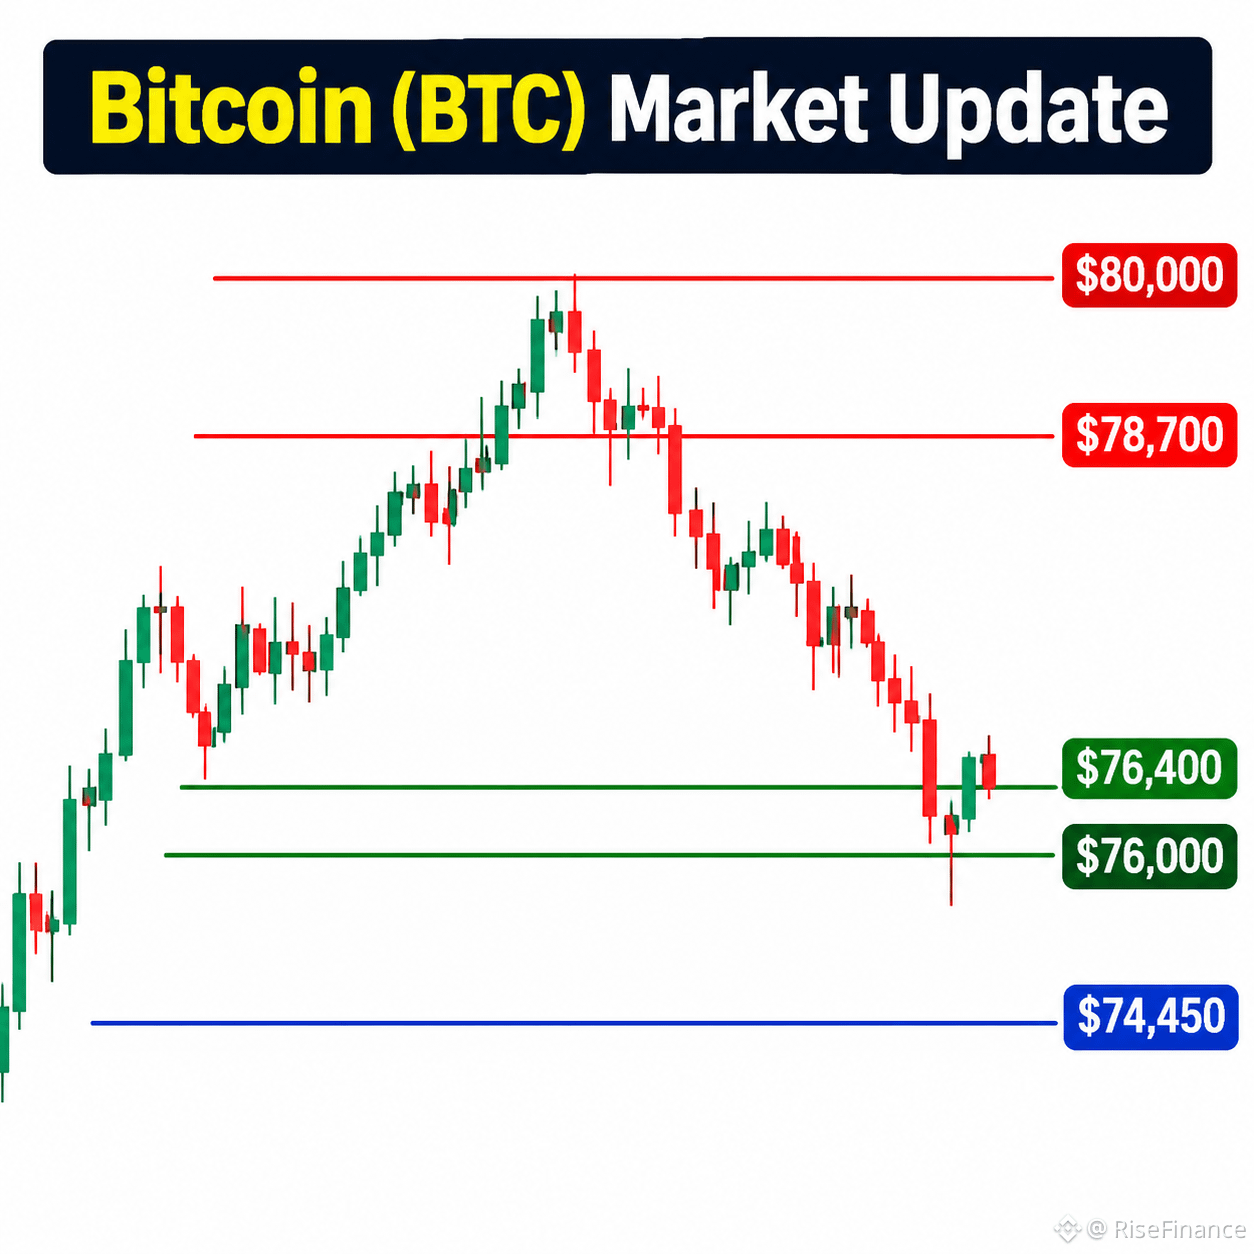
$BTC ビットコイン(BTC)市場アップデート 📊
BTCは現在77,300ドル付近で取引されており、売り圧力が続くなか、短期的な勢いは依然として弱気です。
サポート:76,400~76,000ドル。この水準を下抜けると、74,450ドルまで下落する可能性があります。
レジスタンス:78,700~79,000ドル。このゾーンを上抜ければ、80,000ドルを目指す展開となる可能性があります。
強気シナリオ:サポートを維持し、78,700ドルを回復すれば、反発のきっかけとなる可能性があります。
弱気シナリオ:76,000ドルを割り込むと、74,450ドルに向けて下落が続く可能性があります。
リスク管理:重要な価格水準を注視し、感情的な取引を避け、常に慎重にリスクを管理しましょう。
皆さんはどう思いますか?BTCは78,700ドルを上回って回復するでしょうか、それとも下落が続くでしょうか?
免責事項:これは独自の教育目的の市場分析であり、金融アドバイスではありません。必ずご自身で調査してください。
#HeYiSaysWithdrawalsExpectedtoResumeWithin42Hours #CZSaysCompensationIsinPlaceUsersAreProtected #IntelHasItsWorstDaySince1974 #USDCCirculationFallsAbout800MInSevenDays #ASICHasReceivedNoPredictionMarketApplications
{spot}(BTCUSDT)
$BTC ビットコイン(BTC)市場アップデート 📊
BTCは現在77,300ドル付近で取引されており、売り圧力が続くなか、短期的な勢いは依然として弱気です。
サポート:76,400~76,000ドル。この水準を下抜けると、74,450ドルまで下落する可能性があります。
レジスタンス:78,700~79,000ドル。このゾーンを上抜ければ、80,000ドルを目指す展開となる可能性があります。
強気シナリオ:サポートを維持し、78,700ドルを回復すれば、反発のきっかけとなる可能性があります。
弱気シナリオ:76,000ドルを割り込むと、74,450ドルに向けて下落が続く可能性があります。
リスク管理:重要な価格水準を注視し、感情的な取引を避け、常に慎重にリスクを管理しましょう。
皆さんはどう思いますか?BTCは78,700ドルを上回って回復するでしょうか、それとも下落が続くでしょうか?
免責事項:これは独自の教育目的の市場分析であり、金融アドバイスではありません。必ずご自身で調査してください。
#HeYiSaysWithdrawalsExpectedtoResumeWithin42Hours #CZSaysCompensationIsinPlaceUsersAreProtected #IntelHasItsWorstDaySince1974 #USDCCirculationFallsAbout800MInSevenDays #ASICHasReceivedNoPredictionMarketApplications
BTCは現在77,300ドル付近で取引されており、売り圧力が続くなか、短期的な勢いは依然として弱気です。
サポート:76,400~76,000ドル。この水準を下抜けると、74,450ドルまで下落する可能性があります。
レジスタンス:78,700~79,000ドル。このゾーンを上抜ければ、80,000ドルを目指す展開となる可能性があります。
強気シナリオ:サポートを維持し、78,700ドルを回復すれば、反発のきっかけとなる可能性があります。
弱気シナリオ:76,000ドルを割り込むと、74,450ドルに向けて下落が続く可能性があります。
リスク管理:重要な価格水準を注視し、感情的な取引を避け、常に慎重にリスクを管理しましょう。
皆さんはどう思いますか?BTCは78,700ドルを上回って回復するでしょうか、それとも下落が続くでしょうか?
免責事項:これは独自の教育目的の市場分析であり、金融アドバイスではありません。必ずご自身で調査してください。
#HeYiSaysWithdrawalsExpectedtoResumeWithin42Hours #CZSaysCompensationIsinPlaceUsersAreProtected #IntelHasItsWorstDaySince1974 #USDCCirculationFallsAbout800MInSevenDays #ASICHasReceivedNoPredictionMarketApplications
47
·
--
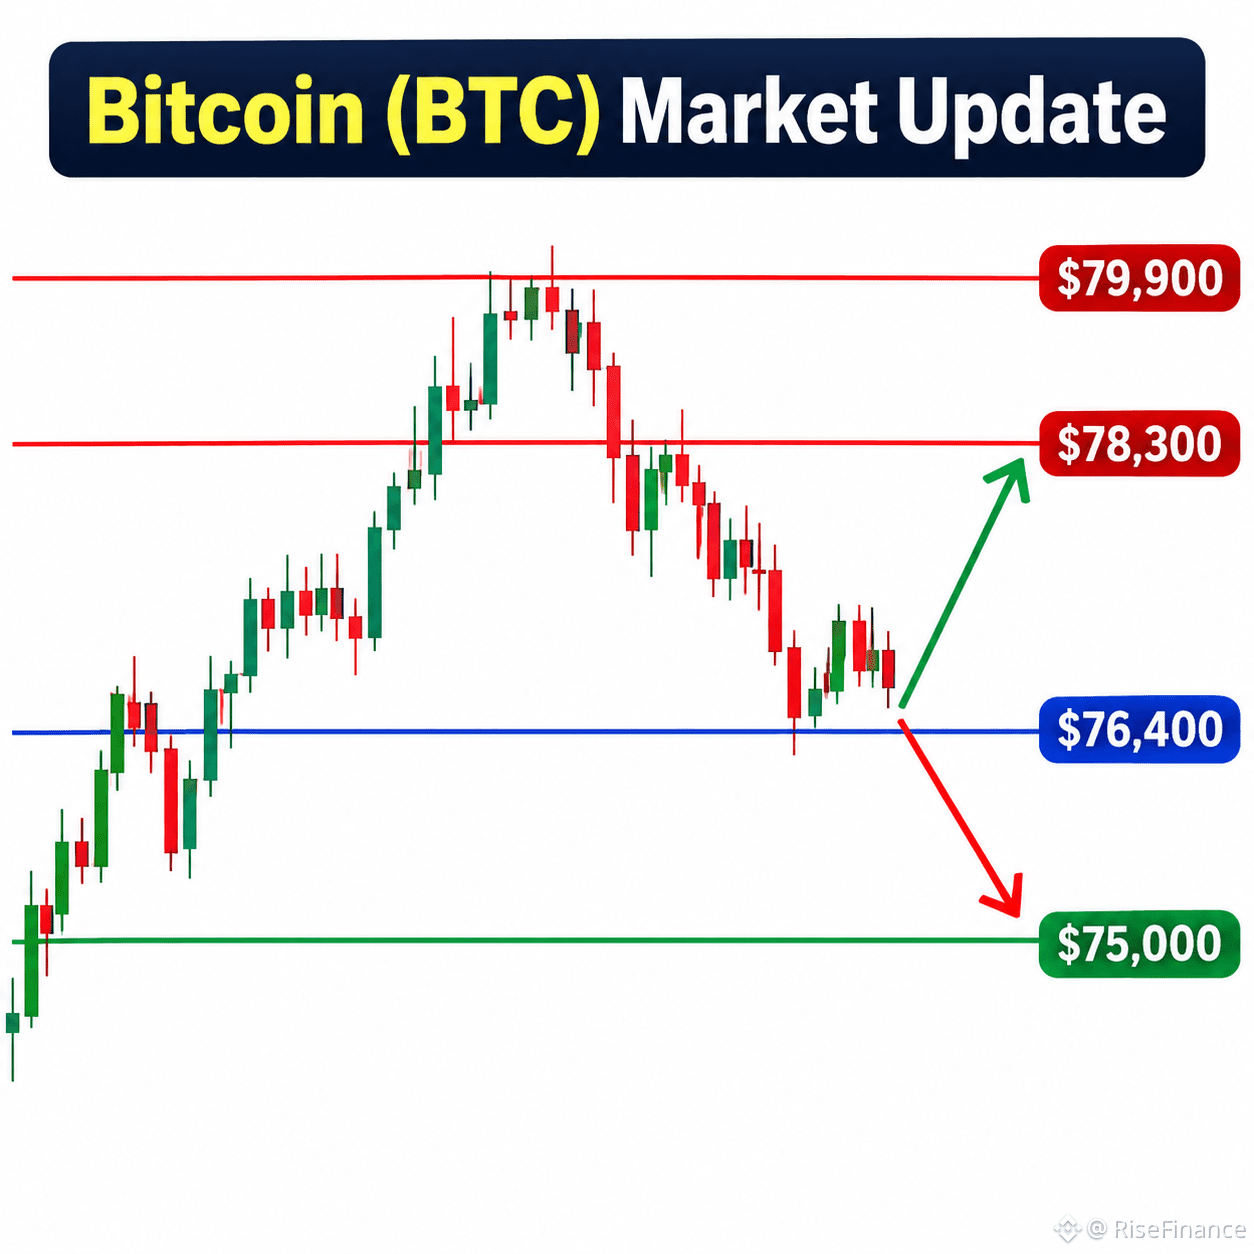
$BTC ビットコイン(BTC)市場アップデート | 2026年10月31日
ビットコインは77,300ドル付近で取引されており、短期的な弱さとまちまちな市場の勢いを示しています。目先のサポートは76,400ドル付近で、その次は75,000ドルです。レジスタンスは78,300~79,900ドル付近にあります。
強気シナリオ:78,300ドルを力強く上抜ければ、さらに上のレジスタンス水準を目指す展開となる可能性があります。
弱気シナリオ:76,400ドルを下回ると、売り圧力が強まり、BTCが75,000ドルに向かう可能性があります。
リスク管理:重要な価格水準を注視し、ブレイクアウトを確認し、感情的な取引を避け、常に慎重にリスクを管理しましょう。
どう思いますか?BTCは78,300ドルを上回る水準まで回復するでしょうか。それとも下落が続くでしょうか?
免責事項:この分析は教育目的のみであり、金融アドバイスではありません。
#HeYiSaysWithdrawalsExpectedtoResumeWithin42Hours #IolePlansToSellAll151.21Bitcoin #USDCCirculationFallsAbout800MInSevenDays #ASICHasReceivedNoPredictionMarketApplications
{spot}(BTCUSDT)
$BTC ビットコイン(BTC)市場アップデート | 2026年10月31日
ビットコインは77,300ドル付近で取引されており、短期的な弱さとまちまちな市場の勢いを示しています。目先のサポートは76,400ドル付近で、その次は75,000ドルです。レジスタンスは78,300~79,900ドル付近にあります。
強気シナリオ:78,300ドルを力強く上抜ければ、さらに上のレジスタンス水準を目指す展開となる可能性があります。
弱気シナリオ:76,400ドルを下回ると、売り圧力が強まり、BTCが75,000ドルに向かう可能性があります。
リスク管理:重要な価格水準を注視し、ブレイクアウトを確認し、感情的な取引を避け、常に慎重にリスクを管理しましょう。
どう思いますか?BTCは78,300ドルを上回る水準まで回復するでしょうか。それとも下落が続くでしょうか?
免責事項:この分析は教育目的のみであり、金融アドバイスではありません。
#HeYiSaysWithdrawalsExpectedtoResumeWithin42Hours #IolePlansToSellAll151.21Bitcoin #USDCCirculationFallsAbout800MInSevenDays #ASICHasReceivedNoPredictionMarketApplications
ビットコインは77,300ドル付近で取引されており、短期的な弱さとまちまちな市場の勢いを示しています。目先のサポートは76,400ドル付近で、その次は75,000ドルです。レジスタンスは78,300~79,900ドル付近にあります。
強気シナリオ:78,300ドルを力強く上抜ければ、さらに上のレジスタンス水準を目指す展開となる可能性があります。
弱気シナリオ:76,400ドルを下回ると、売り圧力が強まり、BTCが75,000ドルに向かう可能性があります。
リスク管理:重要な価格水準を注視し、ブレイクアウトを確認し、感情的な取引を避け、常に慎重にリスクを管理しましょう。
どう思いますか?BTCは78,300ドルを上回る水準まで回復するでしょうか。それとも下落が続くでしょうか?
免責事項:この分析は教育目的のみであり、金融アドバイスではありません。
#HeYiSaysWithdrawalsExpectedtoResumeWithin42Hours #IolePlansToSellAll151.21Bitcoin #USDCCirculationFallsAbout800MInSevenDays #ASICHasReceivedNoPredictionMarketApplications
65
·
--
$BTC ビットコイン(BTC)市場アップデート | 2026年10月31日
BTCは77,500ドル付近で取引されており、短期的な勢いはまちまちです。一方、より広範な市場は引き続き圧力を受けています。
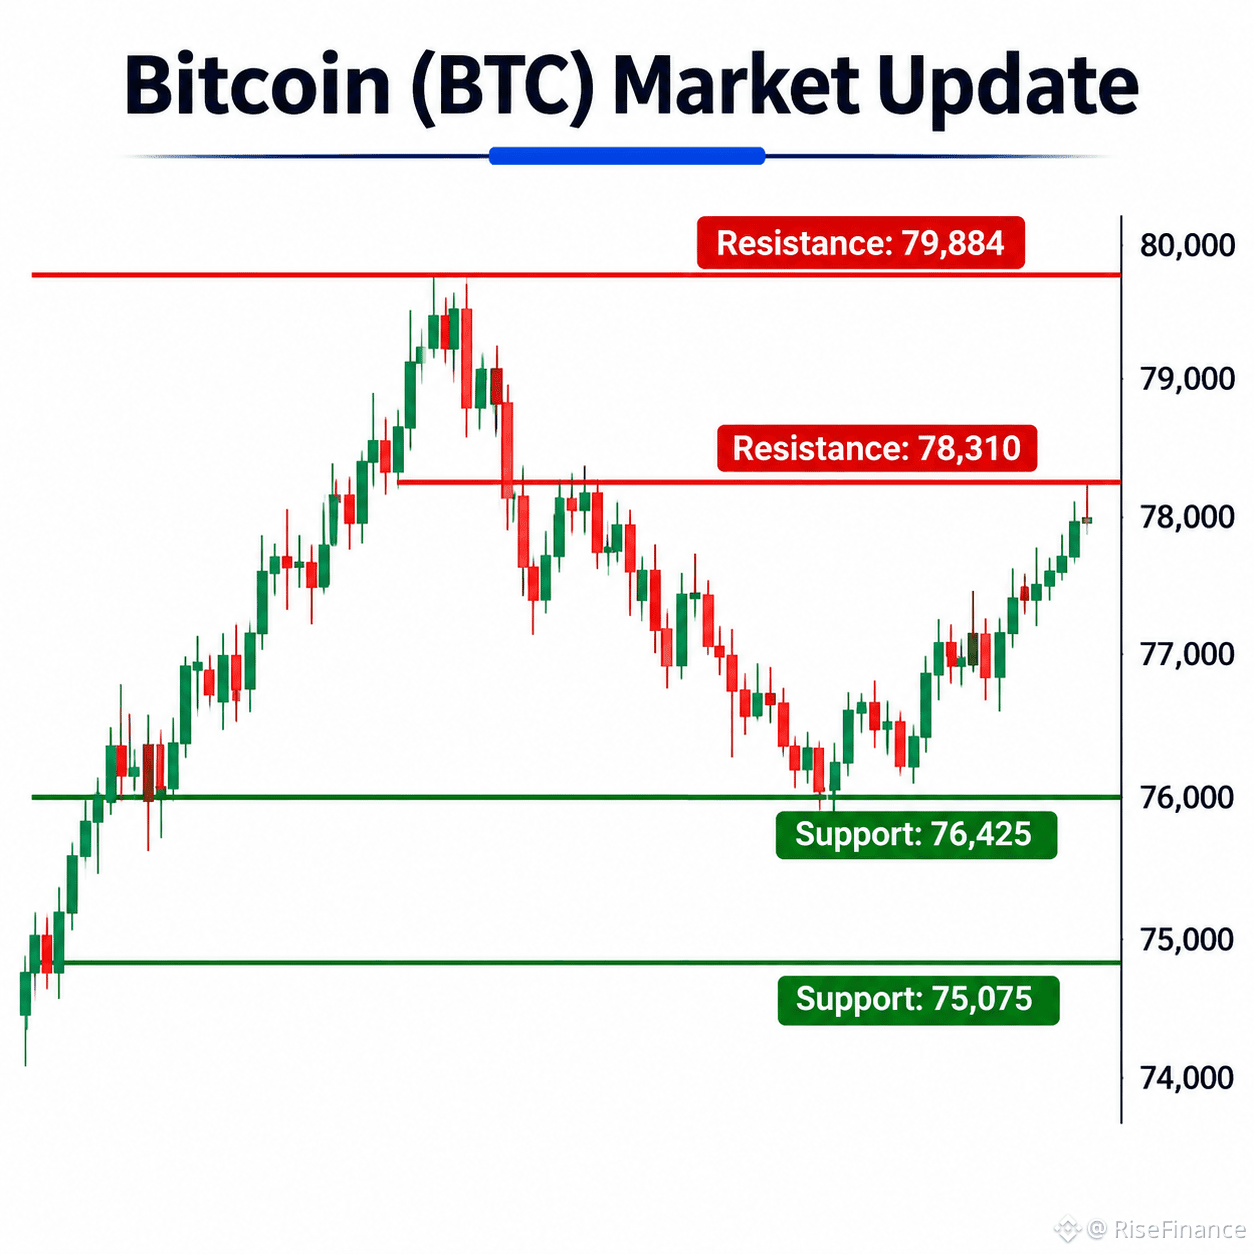
サポート:76,425ドル~75,075ドル
レジスタンス:78,310ドル~79,884ドル
強気シナリオ:78,310ドルを力強く上抜ければ、79,884ドルを目指す展開となる可能性があります。
弱気シナリオ:76,425ドルを下抜けると、75,075ドルに向けて売り圧力が強まる可能性があります。
リスク管理:重要な価格水準に注目し、感情に流された判断を避け、常に慎重にリスクを管理しましょう。
どう思いますか?BTCはレジスタンスを上抜けるでしょうか、それとも次はより低いサポートを試すでしょうか?
免責事項:このコンテンツは教育目的のみであり、金融アドバイスではありません。
#IolePlansToSellAll151.21Bitcoin #ASICHasReceivedNoPredictionMarketApplications #UniswapA16zSeekDeFiExemptionFromIllinoisCryptoTax #HKDollarStablecoinHKDAPToLaunchOnSolana
{spot}(BTCUSDT)
$BTC ビットコイン(BTC)市場アップデート | 2026年10月31日
BTCは77,500ドル付近で取引されており、短期的な勢いはまちまちです。一方、より広範な市場は引き続き圧力を受けています。
サポート:76,425ドル~75,075ドル
レジスタンス:78,310ドル~79,884ドル
強気シナリオ:78,310ドルを力強く上抜ければ、79,884ドルを目指す展開となる可能性があります。
弱気シナリオ:76,425ドルを下抜けると、75,075ドルに向けて売り圧力が強まる可能性があります。
リスク管理:重要な価格水準に注目し、感情に流された判断を避け、常に慎重にリスクを管理しましょう。
どう思いますか?BTCはレジスタンスを上抜けるでしょうか、それとも次はより低いサポートを試すでしょうか?
免責事項:このコンテンツは教育目的のみであり、金融アドバイスではありません。
#IolePlansToSellAll151.21Bitcoin #ASICHasReceivedNoPredictionMarketApplications #UniswapA16zSeekDeFiExemptionFromIllinoisCryptoTax #HKDollarStablecoinHKDAPToLaunchOnSolana
BTCは77,500ドル付近で取引されており、短期的な勢いはまちまちです。一方、より広範な市場は引き続き圧力を受けています。
サポート:76,425ドル~75,075ドル
レジスタンス:78,310ドル~79,884ドル
強気シナリオ:78,310ドルを力強く上抜ければ、79,884ドルを目指す展開となる可能性があります。
弱気シナリオ:76,425ドルを下抜けると、75,075ドルに向けて売り圧力が強まる可能性があります。
リスク管理:重要な価格水準に注目し、感情に流された判断を避け、常に慎重にリスクを管理しましょう。
どう思いますか?BTCはレジスタンスを上抜けるでしょうか、それとも次はより低いサポートを試すでしょうか?
免責事項:このコンテンツは教育目的のみであり、金融アドバイスではありません。
#IolePlansToSellAll151.21Bitcoin #ASICHasReceivedNoPredictionMarketApplications #UniswapA16zSeekDeFiExemptionFromIllinoisCryptoTax #HKDollarStablecoinHKDAPToLaunchOnSolana
66
·
--
$BTC ビットコイン(BTC)市場アップデート 📊
BTCは現在76,871ドル付近で取引されており、過去24時間で約5.33%下落しています。売り圧力は依然として強く、短期的なトレンドは弱気です。
サポート:76,500~75,000ドル
レジスタンス:78,000~80,000ドル
強気シナリオ:78,000ドルを上回る力強い回復があれば、80,000~81,900ドルを目指す展開となる可能性があります。
弱気シナリオ:76,500ドルを下回ると、さらに75,000ドル付近まで下落する可能性があります。
リスク管理:値動きの確認を待ち、感情的な取引を避け、常に慎重にリスクを管理しましょう。
どう思いますか?BTCは80,000ドルを上回るまで回復するでしょうか。それとも下落が続くでしょうか?
免責事項:このコンテンツは教育目的のみであり、金融アドバイスではありません。必ずご自身で調査を行ってください。
#UniswapA16zSeekDeFiExemptionFromIllinoisCryptoTax #HKDollarStablecoinHKDAPToLaunchOnSolana #KOSPIFalls3.53%BackBelow6000 #AmazonSharesFallAbout7%InPremarketTrading #USMidtermElections
{spot}(BTCUSDT)
$BTC ビットコイン(BTC)市場アップデート 📊
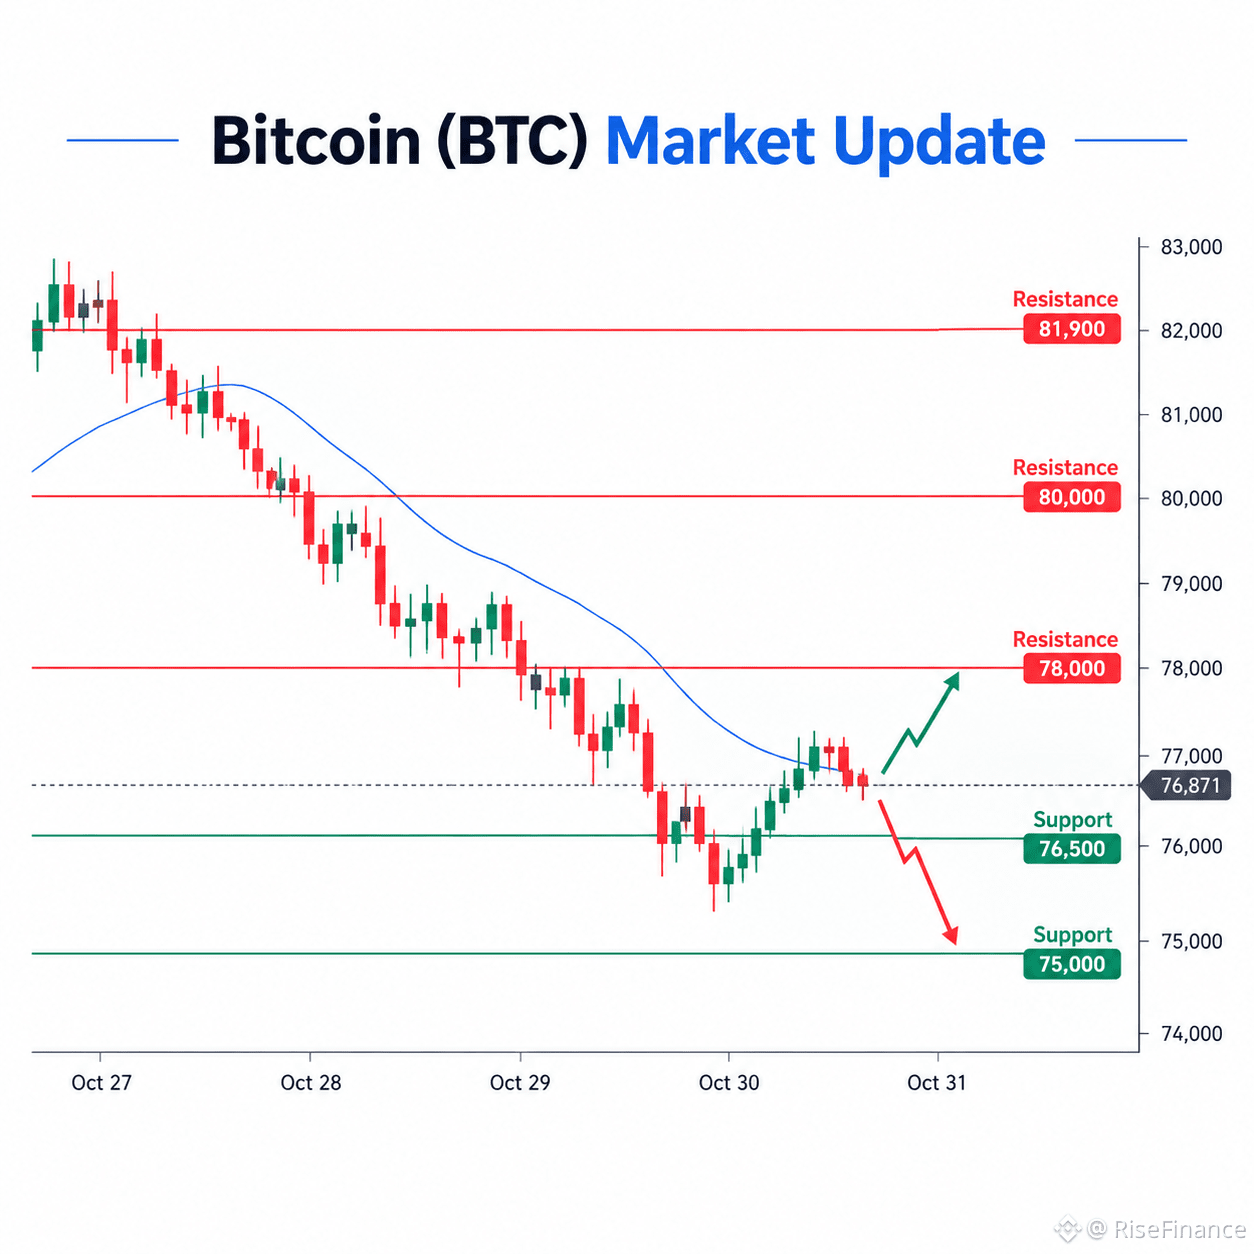
BTCは現在76,871ドル付近で取引されており、過去24時間で約5.33%下落しています。売り圧力は依然として強く、短期的なトレンドは弱気です。
サポート:76,500~75,000ドル
レジスタンス:78,000~80,000ドル
強気シナリオ:78,000ドルを上回る力強い回復があれば、80,000~81,900ドルを目指す展開となる可能性があります。
弱気シナリオ:76,500ドルを下回ると、さらに75,000ドル付近まで下落する可能性があります。
リスク管理:値動きの確認を待ち、感情的な取引を避け、常に慎重にリスクを管理しましょう。
どう思いますか?BTCは80,000ドルを上回るまで回復するでしょうか。それとも下落が続くでしょうか?
免責事項:このコンテンツは教育目的のみであり、金融アドバイスではありません。必ずご自身で調査を行ってください。
#UniswapA16zSeekDeFiExemptionFromIllinoisCryptoTax #HKDollarStablecoinHKDAPToLaunchOnSolana #KOSPIFalls3.53%BackBelow6000 #AmazonSharesFallAbout7%InPremarketTrading #USMidtermElections
BTCは現在76,871ドル付近で取引されており、過去24時間で約5.33%下落しています。売り圧力は依然として強く、短期的なトレンドは弱気です。
サポート:76,500~75,000ドル
レジスタンス:78,000~80,000ドル
強気シナリオ:78,000ドルを上回る力強い回復があれば、80,000~81,900ドルを目指す展開となる可能性があります。
弱気シナリオ:76,500ドルを下回ると、さらに75,000ドル付近まで下落する可能性があります。
リスク管理:値動きの確認を待ち、感情的な取引を避け、常に慎重にリスクを管理しましょう。
どう思いますか?BTCは80,000ドルを上回るまで回復するでしょうか。それとも下落が続くでしょうか?
免責事項:このコンテンツは教育目的のみであり、金融アドバイスではありません。必ずご自身で調査を行ってください。
#UniswapA16zSeekDeFiExemptionFromIllinoisCryptoTax #HKDollarStablecoinHKDAPToLaunchOnSolana #KOSPIFalls3.53%BackBelow6000 #AmazonSharesFallAbout7%InPremarketTrading #USMidtermElections
24
ログインして、さらにコンテンツを読む
厳選トピックで世界の暗号資産トレーダーの仲間入り
⚡️ 暗号資産に関する最新かつ有益な情報が見つかります。
💬 世界最大の暗号資産取引所から信頼されています。
👍 認証を受けたクリエイターから、有益なインサイトを得られます。
メール / 電話番号