
Professor Pump Intel
12 投稿

Professor Pump Intel
報告
ユーザーをブロック
This account is only for Trading and Sharing Trade signals.
低高頻度トレーダー
5年
4 フォロー
20 フォロワー
29 いいね
投稿
·
--
弱気相場
翻訳参照
🚨 Another Bearish Wave for $BTC After Breakout Fail 🔻🔻🔻🔻
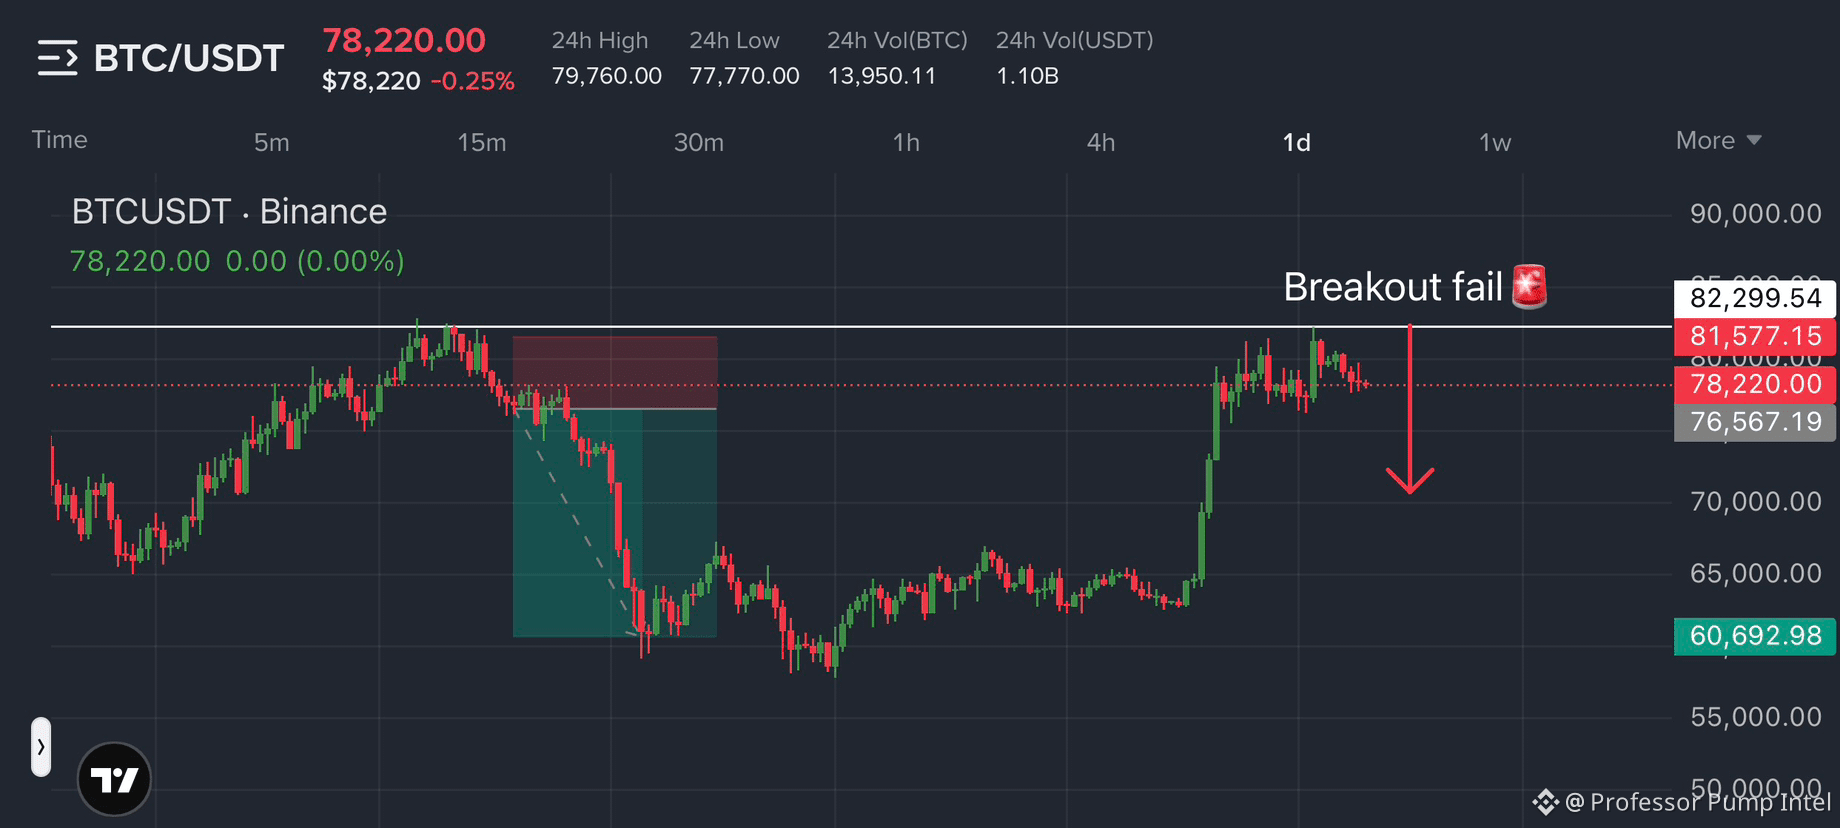
Bitcoin is showing a clear rejection from the $81,500 to $82,300 resistance zone, and the daily chart is now presenting a technically important decision point. After a strong recovery from the $60,692 area, BTC pushed into resistance but failed to establish a convincing breakout. The latest candles suggest that buyers are losing momentum near the highs, while sellers are attempting to reclaim control.
The key level to watch is $81,577. A daily close above this area, followed by a successful retest, would weaken the bearish setup and could open the door toward $82,300 and potentially higher levels. Until that happens, the failed breakout remains a warning that the market may be preparing for a deeper correction.
On the downside, $78,220 is the immediate area of interest. A decisive break below this level could accelerate selling toward $76,567, which is the next important support visible on the chart. If that support also fails, the recovery structure would face significantly greater pressure.
The chart is not confirming a major breakdown yet, but the risk of further downside is increasing. Traders should watch the daily closes carefully rather than assuming the rejection guarantees a collapse.
Key levels:
Resistance: $81,577 to $82,300
Support: $78,220 and $76,567
Bias: Bearish below resistance, bullish only after confirmed breakout.
Click here 👉 $BTC 👈 to Trade.
#bitcoin #btcbreakdown #BTCUSDT #FailedBreakout #analysis
🚨 Another Bearish Wave for $BTC After Breakout Fail 🔻🔻🔻🔻
Bitcoin is showing a clear rejection from the $81,500 to $82,300 resistance zone, and the daily chart is now presenting a technically important decision point. After a strong recovery from the $60,692 area, BTC pushed into resistance but failed to establish a convincing breakout. The latest candles suggest that buyers are losing momentum near the highs, while sellers are attempting to reclaim control.
The key level to watch is $81,577. A daily close above this area, followed by a successful retest, would weaken the bearish setup and could open the door toward $82,300 and potentially higher levels. Until that happens, the failed breakout remains a warning that the market may be preparing for a deeper correction.
On the downside, $78,220 is the immediate area of interest. A decisive break below this level could accelerate selling toward $76,567, which is the next important support visible on the chart. If that support also fails, the recovery structure would face significantly greater pressure.
The chart is not confirming a major breakdown yet, but the risk of further downside is increasing. Traders should watch the daily closes carefully rather than assuming the rejection guarantees a collapse.
Key levels:
Resistance: $81,577 to $82,300
Support: $78,220 and $76,567
Bias: Bearish below resistance, bullish only after confirmed breakout.
Click here 👉 $BTC 👈 to Trade.
#bitcoin #btcbreakdown #BTCUSDT #FailedBreakout #analysis
Bitcoin is showing a clear rejection from the $81,500 to $82,300 resistance zone, and the daily chart is now presenting a technically important decision point. After a strong recovery from the $60,692 area, BTC pushed into resistance but failed to establish a convincing breakout. The latest candles suggest that buyers are losing momentum near the highs, while sellers are attempting to reclaim control.
The key level to watch is $81,577. A daily close above this area, followed by a successful retest, would weaken the bearish setup and could open the door toward $82,300 and potentially higher levels. Until that happens, the failed breakout remains a warning that the market may be preparing for a deeper correction.
On the downside, $78,220 is the immediate area of interest. A decisive break below this level could accelerate selling toward $76,567, which is the next important support visible on the chart. If that support also fails, the recovery structure would face significantly greater pressure.
The chart is not confirming a major breakdown yet, but the risk of further downside is increasing. Traders should watch the daily closes carefully rather than assuming the rejection guarantees a collapse.
Key levels:
Resistance: $81,577 to $82,300
Support: $78,220 and $76,567
Bias: Bearish below resistance, bullish only after confirmed breakout.
Click here 👉 $BTC 👈 to Trade.
#bitcoin #btcbreakdown #BTCUSDT #FailedBreakout #analysis
4
3
29
ログインして、さらにコンテンツを読む
厳選トピックで世界の暗号資産トレーダーの仲間入り
⚡️ 暗号資産に関する最新かつ有益な情報が見つかります。
💬 世界最大の暗号資産取引所から信頼されています。
👍 認証を受けたクリエイターから、有益なインサイトを得られます。
メール / 電話番号
トレンドトピック
AppleDebutsFoldablePhone
閲覧回数 17,129
354人が討論中
$BTC
アップルが折りたたみスマホを出した
“果粉”は分割払いを計算してる
古参の“ニラ”は、いくつBTCが必要かを計算してる
みんな
アップルがついに我慢の限界を越えてきた
初の折りたたみスマホ
iPhone Duo
中国本土版 15999元から
最上位は 26499元まで直行
俺は価格を見て
まず高いとは思わなかった
むしろすぐ取引所を開いて計算した
いまの仮想通貨価格に基づくと
このスマホはだいたい 0.025 BTC くらい
0.025 BTC
たいしたことないように聞こえるよね
でも過去をひっくり返してみて
当時のiPhone 4sが出たときの価格換算は162 BTC
iPhone 6は1.7 BTC
iPhone 13は0.018 BTC
iPhone 17は0.007 BTC
このトレンド、分かった?
手元の金が増えたわけじゃない
ビットコインが、アップルの値付けを希釈してくれてるんだ
面白いのは、発表当日の会場で
アップルの株価がジェットコースター状態
寄り付きでまず叩き売り
その後また持ち直して
引けは小幅に下落
この高価格の折りたたみ機が大ヒットするか、市場の見方は割れてる😂😂
でもみんな
アップルが新機種を出したからって
テクノロジーの追い風が来るって勝手に妄想しないで
大饼(BTC)は追随で上がる必要がある
アップルと仮想通貨界隈には直接の資金の通り道はない
どれだけスマホを売っても、1円が自動で暗号資産市場に流れ込むわけじゃない
これは消費側のハード面での追い風
大饼を直接押し上げる“大きな論理”ではない
大饼の値付けの本流は、相変わらず
FRBの利下げ、米国債の利回りだ
アップルの新製品は産業としての小さなホットスポットにすぎない
短期的にセクターの気分を動かすだけで
相場全体の大きなトレンドは変えられない
もしあなたがもともとスマホを買い替えるつもりで
たまたま手元に0.025 BTC分の余剰資金があるなら
買う?
#appledebutsfoldablephone
孔大锤
·いいね:3件
·閲覧回数 2.4k
IranSaysReadyToEscalateWarWithUS
閲覧回数 0
4人が討論中
EUExtendsCentralContactPointToCASPs
閲覧回数 2,908
107人が討論中