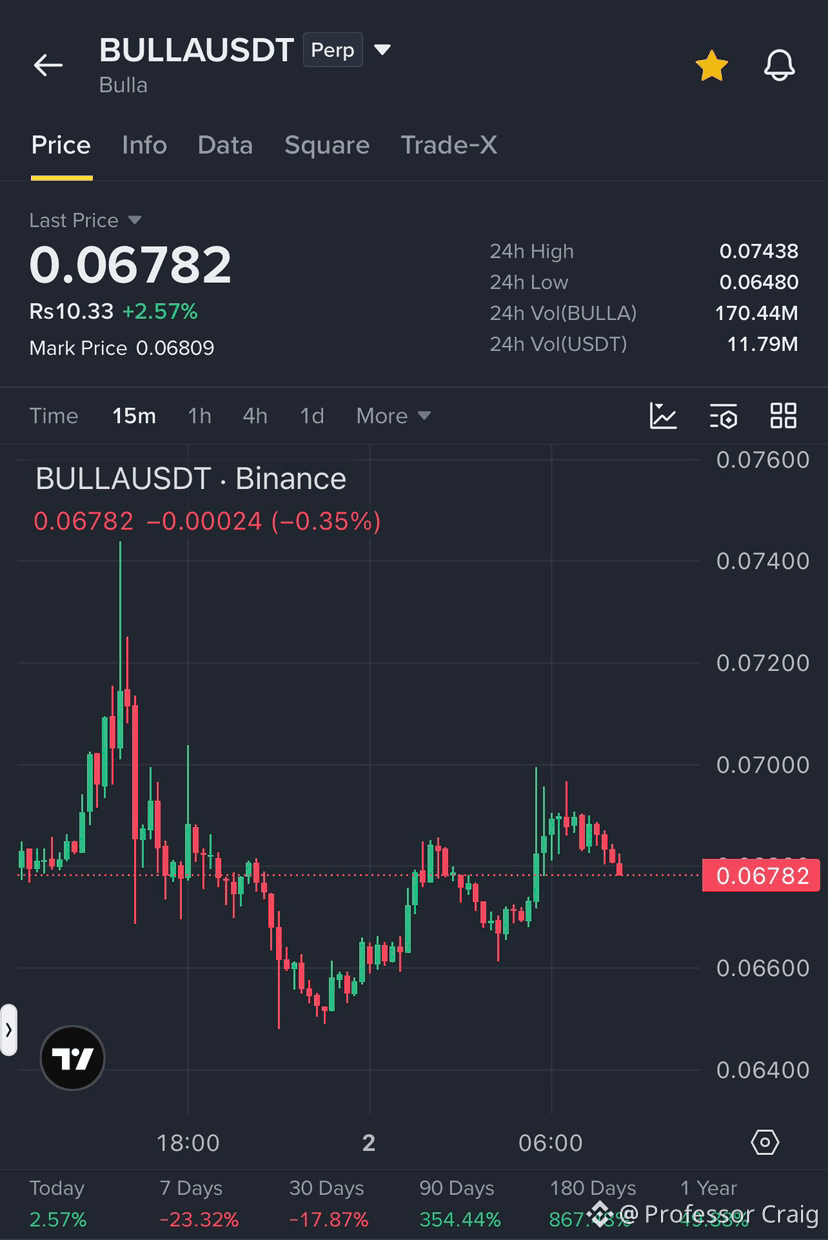
🚨$BULLA is showing signs of weakening after its recent recovery. Can sellers push it back toward the $0.065 support zone?
It is currently trading around $0.06782, up 2.57% over the last 24 hours. However, the 15-minute chart shows that bullish momentum is losing strength after failing to maintain its recovery toward the $0.0690-$0.0700 resistance area. Looking at the recent price action, it initially experienced a strong upward move toward $0.0740 before facing heavy selling pressure. This resulted in a sharp correction toward $0.0650-$0.0660. Buyers eventually stepped in and pushed the price higher, but the latest candles show another rejection near $0.0690.
My short-term view is slightly bearish. The price is currently struggling to maintain its upward momentum, and sellers are beginning to put pressure on the recovery. If BULLA loses the $0.0670 support, the next important downside levels are around $0.0660 and $0.0650. A stronger breakdown could bring the price closer to the 24-hour low of $0.06480. On the other hand, buyers still have an opportunity to regain control. A strong move above $0.0690 could open the door toward $0.0700 and potentially $0.0720. Until that happens, I would be cautious about chasing long positions.
Short Trading Plan
Entry: $0.0680 - $0.0686
TP1: $0.0670
TP2: $0.0660
TP3: $0.0650
Stop Loss: $0.0696
The main level I am watching is $0.0670. Losing this support would strengthen the bearish setup, while reclaiming $0.0690 would weaken it.
What do you think? Will BULLA revisit $0.0650, or can buyers push it back above $0.0700?
It is currently trading around $0.06782, up 2.57% over the last 24 hours. However, the 15-minute chart shows that bullish momentum is losing strength after failing to maintain its recovery toward the $0.0690-$0.0700 resistance area. Looking at the recent price action, it initially experienced a strong upward move toward $0.0740 before facing heavy selling pressure. This resulted in a sharp correction toward $0.0650-$0.0660. Buyers eventually stepped in and pushed the price higher, but the latest candles show another rejection near $0.0690.
My short-term view is slightly bearish. The price is currently struggling to maintain its upward momentum, and sellers are beginning to put pressure on the recovery. If BULLA loses the $0.0670 support, the next important downside levels are around $0.0660 and $0.0650. A stronger breakdown could bring the price closer to the 24-hour low of $0.06480. On the other hand, buyers still have an opportunity to regain control. A strong move above $0.0690 could open the door toward $0.0700 and potentially $0.0720. Until that happens, I would be cautious about chasing long positions.
Short Trading Plan
Entry: $0.0680 - $0.0686
TP1: $0.0670
TP2: $0.0660
TP3: $0.0650
Stop Loss: $0.0696
The main level I am watching is $0.0670. Losing this support would strengthen the bearish setup, while reclaiming $0.0690 would weaken it.
What do you think? Will BULLA revisit $0.0650, or can buyers push it back above $0.0700?