

Basil V
547 投稿

Basil V
報告
ユーザーをブロック
40 フォロー
113 フォロワー
508 いいね
投稿
すべて
引用
·
--
翻訳参照
$BNB is getting quiet, but the market is not asleep.
BNB is currently trading around $773, while the 1-hour chart shows a clear battle between buyers and sellers. After the recent move up toward $790, the price has started moving sideways, with neither side able to take full control.
The most interesting part is the moving averages. EMA 7 is around $773.64, EMA 25 is around $774.50, and EMA 99 is around $775.02. All three are now very close to each other. This usually means the market is losing direction and preparing for a stronger move.
RSI is around 42, which shows that buyers have lost some strength. The market is not oversold, but there is currently no strong bullish momentum either. MACD is also slightly negative, showing that sellers still have a small advantage in the short term.
The key level to watch is $772. If BNB holds this area and buyers return, we could see another attempt toward $779–780 and then $785–790. A strong breakout above $790 could completely change the short-term picture.
But if $772 is lost with a strong candle and volume, the next important area is around $768–763. This would mean that the current sideways movement is turning into another correction.
{spot}(BNBUSDT)
For now, BNB is trapped between support and resistance, and the market is becoming increasingly compressed. This is exactly the type of situation where patience can be more valuable than trying to predict the next candle.
The bulls want to reclaim $775 and attack $790.
The bears want to break $772 and push the price toward $763.
The next real move may start when one of these levels finally breaks.
$BNB is quiet right now. But quiet markets often make the loudest moves when the range finally breaks.
$BNB is getting quiet, but the market is not asleep.
BNB is currently trading around $773, while the 1-hour chart shows a clear battle between buyers and sellers. After the recent move up toward $790, the price has started moving sideways, with neither side able to take full control.
The most interesting part is the moving averages. EMA 7 is around $773.64, EMA 25 is around $774.50, and EMA 99 is around $775.02. All three are now very close to each other. This usually means the market is losing direction and preparing for a stronger move.
RSI is around 42, which shows that buyers have lost some strength. The market is not oversold, but there is currently no strong bullish momentum either. MACD is also slightly negative, showing that sellers still have a small advantage in the short term.
The key level to watch is $772. If BNB holds this area and buyers return, we could see another attempt toward $779–780 and then $785–790. A strong breakout above $790 could completely change the short-term picture.
But if $772 is lost with a strong candle and volume, the next important area is around $768–763. This would mean that the current sideways movement is turning into another correction.
For now, BNB is trapped between support and resistance, and the market is becoming increasingly compressed. This is exactly the type of situation where patience can be more valuable than trying to predict the next candle.
The bulls want to reclaim $775 and attack $790.
The bears want to break $772 and push the price toward $763.
The next real move may start when one of these levels finally breaks.
$BNB is quiet right now. But quiet markets often make the loudest moves when the range finally breaks.
BNB is currently trading around $773, while the 1-hour chart shows a clear battle between buyers and sellers. After the recent move up toward $790, the price has started moving sideways, with neither side able to take full control.
The most interesting part is the moving averages. EMA 7 is around $773.64, EMA 25 is around $774.50, and EMA 99 is around $775.02. All three are now very close to each other. This usually means the market is losing direction and preparing for a stronger move.
RSI is around 42, which shows that buyers have lost some strength. The market is not oversold, but there is currently no strong bullish momentum either. MACD is also slightly negative, showing that sellers still have a small advantage in the short term.
The key level to watch is $772. If BNB holds this area and buyers return, we could see another attempt toward $779–780 and then $785–790. A strong breakout above $790 could completely change the short-term picture.
But if $772 is lost with a strong candle and volume, the next important area is around $768–763. This would mean that the current sideways movement is turning into another correction.
For now, BNB is trapped between support and resistance, and the market is becoming increasingly compressed. This is exactly the type of situation where patience can be more valuable than trying to predict the next candle.
The bulls want to reclaim $775 and attack $790.
The bears want to break $772 and push the price toward $763.
The next real move may start when one of these levels finally breaks.
$BNB is quiet right now. But quiet markets often make the loudest moves when the range finally breaks.
139
·
--
$BNB は重要な意思決定のポイントに接近しています。
$799から$756へ下落した後、BNBは強く回復し、現在は約$780で取引されています。強気派は短期の構造を取り戻すことに成功しており、価格は主要な移動平均線を上回った状態を維持しています。
しかし、$782〜$786のエリアは現在重要なレジスタンスゾーンです。ここで弱気派が回復を止めにくる可能性があります。
もし$BNB が$786を上抜けし、その水準を維持できれば、次に注目すべきは$792と$799です。ブレイクが成功すれば、強気派がもう一段高い局面へ進む準備ができているサインとなり得ます。
一方で、$782〜$786からの反落が起き、さらに$774〜$775を下回る動きが続けば、現在の強気の設定は弱まります。その場合、$764〜$766が重要なサポートゾーンになります。
{spot}(BNBUSDT)
今のところ、私はその動きを追いかけていません。強気派と弱気派の攻防を見守り、市場が手の内を見せるのを待っています。
時には、最良の取引は早く入ることではありません。確認(コンファメーション)を待つことです。
BNBは扉の前にいます。
問題は、強気派が突き破るのか、それとも弱気派がもう一度閉めてしまうのか?
$BNB は重要な意思決定のポイントに接近しています。
$799から$756へ下落した後、BNBは強く回復し、現在は約$780で取引されています。強気派は短期の構造を取り戻すことに成功しており、価格は主要な移動平均線を上回った状態を維持しています。
しかし、$782〜$786のエリアは現在重要なレジスタンスゾーンです。ここで弱気派が回復を止めにくる可能性があります。
もし$BNB が$786を上抜けし、その水準を維持できれば、次に注目すべきは$792と$799です。ブレイクが成功すれば、強気派がもう一段高い局面へ進む準備ができているサインとなり得ます。
一方で、$782〜$786からの反落が起き、さらに$774〜$775を下回る動きが続けば、現在の強気の設定は弱まります。その場合、$764〜$766が重要なサポートゾーンになります。
今のところ、私はその動きを追いかけていません。強気派と弱気派の攻防を見守り、市場が手の内を見せるのを待っています。
時には、最良の取引は早く入ることではありません。確認(コンファメーション)を待つことです。
BNBは扉の前にいます。
問題は、強気派が突き破るのか、それとも弱気派がもう一度閉めてしまうのか?
$799から$756へ下落した後、BNBは強く回復し、現在は約$780で取引されています。強気派は短期の構造を取り戻すことに成功しており、価格は主要な移動平均線を上回った状態を維持しています。
しかし、$782〜$786のエリアは現在重要なレジスタンスゾーンです。ここで弱気派が回復を止めにくる可能性があります。
もし$BNB が$786を上抜けし、その水準を維持できれば、次に注目すべきは$792と$799です。ブレイクが成功すれば、強気派がもう一段高い局面へ進む準備ができているサインとなり得ます。
一方で、$782〜$786からの反落が起き、さらに$774〜$775を下回る動きが続けば、現在の強気の設定は弱まります。その場合、$764〜$766が重要なサポートゾーンになります。
今のところ、私はその動きを追いかけていません。強気派と弱気派の攻防を見守り、市場が手の内を見せるのを待っています。
時には、最良の取引は早く入ることではありません。確認(コンファメーション)を待つことです。
BNBは扉の前にいます。
問題は、強気派が突き破るのか、それとも弱気派がもう一度閉めてしまうのか?
1
299
·
--
$BNB 市場は重大な意思決定の局面にある
BNBは、直近の高値付近である約$799から急落し$756.83まで下がった後、現在は約$772.90で取引されています。市場はすでに強く回復していますが、現在の価格は重要なレジスタンス帯に近づいています。
1時間足チャートでは、EMA7が$770.62、EMA25が$773.37、EMA99が$774.95です。これにより、$773〜$775付近に大きなレジスタンス領域が形成されています。BNBは、このゾーンを突破し上抜けを維持することで、現在の回復がより強い強気の動きになりつつあることを確認する必要があります。
RSIは約60で、買い手が優勢であることを示していますが、まだ買われ過ぎ(オーバーボート)という状態ではありません。MACDもプラスに転じており、ヒストグラムは1.25です。これは、直近の売りの後に短期のモメンタムが回復していることを示しています。
注目すべき重要な水準は$775です。
もしBNBが出来高を伴って$775を上抜け、その水準を維持できれば、次に注目するのは$782〜$783、その次が$792、そして場合によっては過去の高値付近である約$799です。
ただし、$BNB が$773〜$775を突破できず、$770を下回るように反落するなら、回復の勢いは失われる可能性があります。その場合、$764が重要なサポートになり、続いて$756〜$757のゾーンが意識されます。
低い水準からロングポジションを保有しているトレーダーにとって、いまの局面は主に、正確に天井を当てにいくというより、積み上がった利益を守ることが中心です。$764のあたりは監視すべき重要な水準であり、そこを継続的に下回るブレイクが起きれば、現在の回復の構造が弱まることになります。
したがってBNBは、重要な分岐点にあります。$775の確定的な上抜けができれば、$782〜$792へ向かう道が開ける可能性がある一方で、このゾーンからの拒否(反落)後に$764を下抜ければ、より深い調整のサインとなり得ます。
今後の数本の1時間足のローソク足と、取引出来高が、どのシナリオが展開されるかを判断するうえで重要になります。
{spot}(BNBUSDT)
$BNB 市場は重大な意思決定の局面にある
BNBは、直近の高値付近である約$799から急落し$756.83まで下がった後、現在は約$772.90で取引されています。市場はすでに強く回復していますが、現在の価格は重要なレジスタンス帯に近づいています。
1時間足チャートでは、EMA7が$770.62、EMA25が$773.37、EMA99が$774.95です。これにより、$773〜$775付近に大きなレジスタンス領域が形成されています。BNBは、このゾーンを突破し上抜けを維持することで、現在の回復がより強い強気の動きになりつつあることを確認する必要があります。
RSIは約60で、買い手が優勢であることを示していますが、まだ買われ過ぎ(オーバーボート)という状態ではありません。MACDもプラスに転じており、ヒストグラムは1.25です。これは、直近の売りの後に短期のモメンタムが回復していることを示しています。
注目すべき重要な水準は$775です。
もしBNBが出来高を伴って$775を上抜け、その水準を維持できれば、次に注目するのは$782〜$783、その次が$792、そして場合によっては過去の高値付近である約$799です。
ただし、$BNB が$773〜$775を突破できず、$770を下回るように反落するなら、回復の勢いは失われる可能性があります。その場合、$764が重要なサポートになり、続いて$756〜$757のゾーンが意識されます。
低い水準からロングポジションを保有しているトレーダーにとって、いまの局面は主に、正確に天井を当てにいくというより、積み上がった利益を守ることが中心です。$764のあたりは監視すべき重要な水準であり、そこを継続的に下回るブレイクが起きれば、現在の回復の構造が弱まることになります。
したがってBNBは、重要な分岐点にあります。$775の確定的な上抜けができれば、$782〜$792へ向かう道が開ける可能性がある一方で、このゾーンからの拒否(反落)後に$764を下抜ければ、より深い調整のサインとなり得ます。
今後の数本の1時間足のローソク足と、取引出来高が、どのシナリオが展開されるかを判断するうえで重要になります。
BNBは、直近の高値付近である約$799から急落し$756.83まで下がった後、現在は約$772.90で取引されています。市場はすでに強く回復していますが、現在の価格は重要なレジスタンス帯に近づいています。
1時間足チャートでは、EMA7が$770.62、EMA25が$773.37、EMA99が$774.95です。これにより、$773〜$775付近に大きなレジスタンス領域が形成されています。BNBは、このゾーンを突破し上抜けを維持することで、現在の回復がより強い強気の動きになりつつあることを確認する必要があります。
RSIは約60で、買い手が優勢であることを示していますが、まだ買われ過ぎ(オーバーボート)という状態ではありません。MACDもプラスに転じており、ヒストグラムは1.25です。これは、直近の売りの後に短期のモメンタムが回復していることを示しています。
注目すべき重要な水準は$775です。
もしBNBが出来高を伴って$775を上抜け、その水準を維持できれば、次に注目するのは$782〜$783、その次が$792、そして場合によっては過去の高値付近である約$799です。
ただし、$BNB が$773〜$775を突破できず、$770を下回るように反落するなら、回復の勢いは失われる可能性があります。その場合、$764が重要なサポートになり、続いて$756〜$757のゾーンが意識されます。
低い水準からロングポジションを保有しているトレーダーにとって、いまの局面は主に、正確に天井を当てにいくというより、積み上がった利益を守ることが中心です。$764のあたりは監視すべき重要な水準であり、そこを継続的に下回るブレイクが起きれば、現在の回復の構造が弱まることになります。
したがってBNBは、重要な分岐点にあります。$775の確定的な上抜けができれば、$782〜$792へ向かう道が開ける可能性がある一方で、このゾーンからの拒否(反落)後に$764を下抜ければ、より深い調整のサインとなり得ます。
今後の数本の1時間足のローソク足と、取引出来高が、どのシナリオが展開されるかを判断するうえで重要になります。
2
608
·
--
翻訳参照
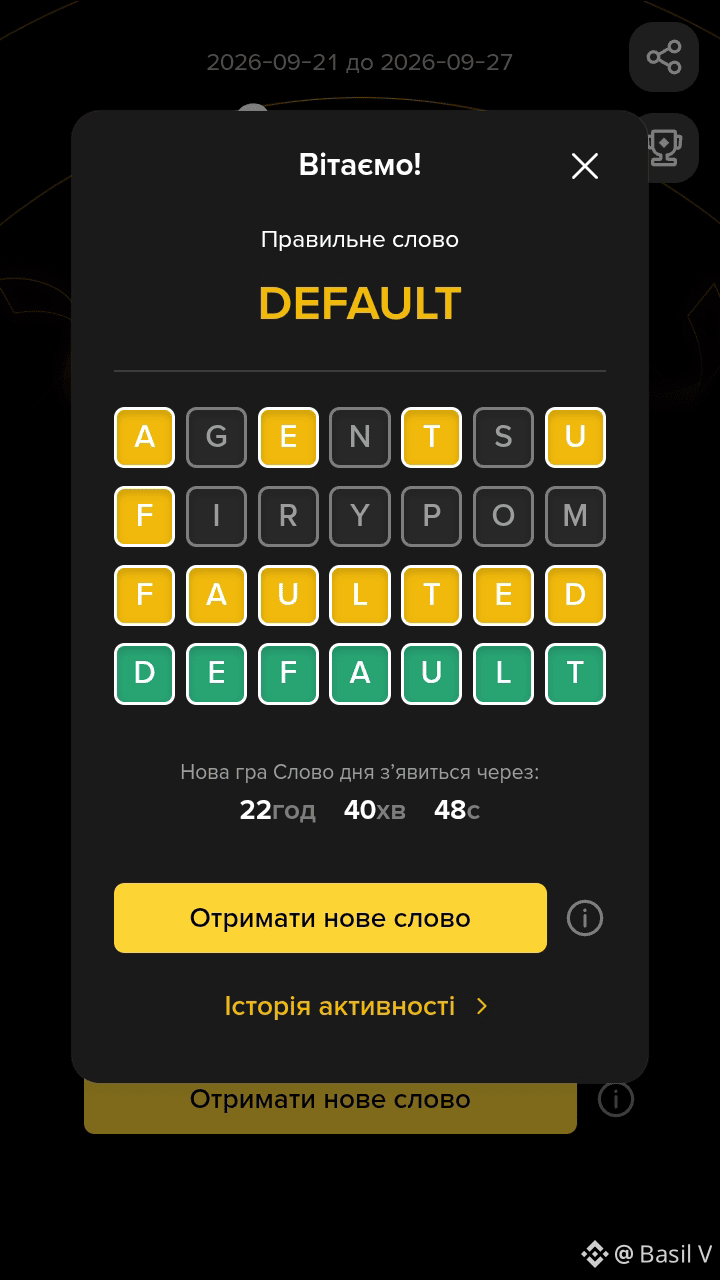
A game of *Wheel of Fortune*.
Host: "And yes, you’ve revealed all the letters—say the word."
Player: "Well, I’m not sure, but I think it’s 'faulted'."
Host: "That’s right—you *faulted*, because the correct word is 'default'."
A game of *Wheel of Fortune*.
Host: "And yes, you’ve revealed all the letters—say the word."
Player: "Well, I’m not sure, but I think it’s 'faulted'."
Host: "That’s right—you *faulted*, because the correct word is 'default'."
Host: "And yes, you’ve revealed all the letters—say the word."
Player: "Well, I’m not sure, but I think it’s 'faulted'."
Host: "That’s right—you *faulted*, because the correct word is 'default'."
314
·
--
$BNB は、私たちが注視していた調整シナリオにほぼ正確に沿って動いています。$807.49に到達した後、価格は重要な$772の下をブレイクし、その後$777付近のEMA99を失い、回復力が弱まっていることを確認しました。
BNBは現在$767付近で取引されており、EMA7は$771、EMA25は$781、EMA99は$776.8です。MACDは依然としてマイナスのままです。また、最新の下落は出来高の大幅な増加を伴っていました。
次に重要な水準は$756–757、次いで$735–736で、さらに圧力が続けば$720–721のエリアです。$720を下抜けると、$700ゾーンが再び注目される可能性があります。
興味深いのは、現時点で市場が予想外の動きをしていないことです。先ほど話し合った調整は段階的に進行しています。問題は、買い手が次のサポートを守れるのか、それとも弱気勢がBNBをさらに押し下げ続けるのかです。{spot}(BNBUSDT)
$BNB は、私たちが注視していた調整シナリオにほぼ正確に沿って動いています。$807.49に到達した後、価格は重要な$772の下をブレイクし、その後$777付近のEMA99を失い、回復力が弱まっていることを確認しました。
BNBは現在$767付近で取引されており、EMA7は$771、EMA25は$781、EMA99は$776.8です。MACDは依然としてマイナスのままです。また、最新の下落は出来高の大幅な増加を伴っていました。
次に重要な水準は$756–757、次いで$735–736で、さらに圧力が続けば$720–721のエリアです。$720を下抜けると、$700ゾーンが再び注目される可能性があります。
興味深いのは、現時点で市場が予想外の動きをしていないことです。先ほど話し合った調整は段階的に進行しています。問題は、買い手が次のサポートを守れるのか、それとも弱気勢がBNBをさらに押し下げ続けるのかです。
BNBは現在$767付近で取引されており、EMA7は$771、EMA25は$781、EMA99は$776.8です。MACDは依然としてマイナスのままです。また、最新の下落は出来高の大幅な増加を伴っていました。
次に重要な水準は$756–757、次いで$735–736で、さらに圧力が続けば$720–721のエリアです。$720を下抜けると、$700ゾーンが再び注目される可能性があります。
興味深いのは、現時点で市場が予想外の動きをしていないことです。先ほど話し合った調整は段階的に進行しています。問題は、買い手が次のサポートを守れるのか、それとも弱気勢がBNBをさらに押し下げ続けるのかです。
Basil V
·
--
$BNB は、最近の急騰の後に重要な試練に直面しています。価格は約$786まで押し戻されており、EMA7とEMA25はいずれも約$789付近、EMA99は約$769.6です。
これにより、$772の領域が注目ポイントです。EMA99に近く、売り圧力が続くなら次の重要な調整ゾーンになり得ます。
短期の指標はすでに弱まり始めています。RSIは27まで下落し、MACDはマイナスに転じました。これにより反発の可能性は高まりますが、調整シナリオが無効になるわけではありません。
私にとっての重要な問いはシンプルです。買い手は769〜772の領域を守れるのか、それともBNBがこの水準を下抜けしてさらに深く下落するのか。
このゾーンからの反応は、底を先に当てにいくよりも、はるかに多くのことを教えてくれるでしょう。
これにより、$772の領域が注目ポイントです。EMA99に近く、売り圧力が続くなら次の重要な調整ゾーンになり得ます。
短期の指標はすでに弱まり始めています。RSIは27まで下落し、MACDはマイナスに転じました。これにより反発の可能性は高まりますが、調整シナリオが無効になるわけではありません。
私にとっての重要な問いはシンプルです。買い手は769〜772の領域を守れるのか、それともBNBがこの水準を下抜けしてさらに深く下落するのか。
このゾーンからの反応は、底を先に当てにいくよりも、はるかに多くのことを教えてくれるでしょう。
1
129
·
--
前回の分析では、$DEXE が長期EMA99の周りで価格が圧縮する中、重要な局面に備えていることを指摘しました。そしてその動きがいま、ようやく姿を現し始めています。
4Hチャートでは、DEXEは約$1.91近辺のEMA99を上抜けし、現在は約$2.02で推移しています。焦点はもはや、EMA99をブレイクできるかどうかではなく、市場がその水準の上方を維持できるかどうかに移っています。
RSIはすでに約87で、強いモメンタムを示している一方、短期的にはかなり行き過ぎた動きでもあります。ただし出来高は直近の平均を下回っているため、ブレイクにはまだ確認が必要です。
いま重要なのは、$1.90〜$1.92のゾーンです。押し目の局面でサポートとして維持できれば、直近のブレイクは一段と意味のあるものになります。$DEXE は、これまでの構造が準備していた「重要な動き」をついに見せているのかもしれません。
{spot}(DEXEUSDT)
前回の分析では、$DEXE が長期EMA99の周りで価格が圧縮する中、重要な局面に備えていることを指摘しました。そしてその動きがいま、ようやく姿を現し始めています。
4Hチャートでは、DEXEは約$1.91近辺のEMA99を上抜けし、現在は約$2.02で推移しています。焦点はもはや、EMA99をブレイクできるかどうかではなく、市場がその水準の上方を維持できるかどうかに移っています。
RSIはすでに約87で、強いモメンタムを示している一方、短期的にはかなり行き過ぎた動きでもあります。ただし出来高は直近の平均を下回っているため、ブレイクにはまだ確認が必要です。
いま重要なのは、$1.90〜$1.92のゾーンです。押し目の局面でサポートとして維持できれば、直近のブレイクは一段と意味のあるものになります。$DEXE は、これまでの構造が準備していた「重要な動き」をついに見せているのかもしれません。
4Hチャートでは、DEXEは約$1.91近辺のEMA99を上抜けし、現在は約$2.02で推移しています。焦点はもはや、EMA99をブレイクできるかどうかではなく、市場がその水準の上方を維持できるかどうかに移っています。
RSIはすでに約87で、強いモメンタムを示している一方、短期的にはかなり行き過ぎた動きでもあります。ただし出来高は直近の平均を下回っているため、ブレイクにはまだ確認が必要です。
いま重要なのは、$1.90〜$1.92のゾーンです。押し目の局面でサポートとして維持できれば、直近のブレイクは一段と意味のあるものになります。$DEXE は、これまでの構造が準備していた「重要な動き」をついに見せているのかもしれません。
1
4
970
·
--
$BNB は、最近の急騰の後に重要な試練に直面しています。価格は約$786まで押し戻されており、EMA7とEMA25はいずれも約$789付近、EMA99は約$769.6です。
これにより、$772の領域が注目ポイントです。EMA99に近く、売り圧力が続くなら次の重要な調整ゾーンになり得ます。
短期の指標はすでに弱まり始めています。RSIは27まで下落し、MACDはマイナスに転じました。これにより反発の可能性は高まりますが、調整シナリオが無効になるわけではありません。
私にとっての重要な問いはシンプルです。買い手は769〜772の領域を守れるのか、それともBNBがこの水準を下抜けしてさらに深く下落するのか。
このゾーンからの反応は、底を先に当てにいくよりも、はるかに多くのことを教えてくれるでしょう。
{spot}(BNBUSDT)
$BNB は、最近の急騰の後に重要な試練に直面しています。価格は約$786まで押し戻されており、EMA7とEMA25はいずれも約$789付近、EMA99は約$769.6です。
これにより、$772の領域が注目ポイントです。EMA99に近く、売り圧力が続くなら次の重要な調整ゾーンになり得ます。
短期の指標はすでに弱まり始めています。RSIは27まで下落し、MACDはマイナスに転じました。これにより反発の可能性は高まりますが、調整シナリオが無効になるわけではありません。
私にとっての重要な問いはシンプルです。買い手は769〜772の領域を守れるのか、それともBNBがこの水準を下抜けしてさらに深く下落するのか。
このゾーンからの反応は、底を先に当てにいくよりも、はるかに多くのことを教えてくれるでしょう。
これにより、$772の領域が注目ポイントです。EMA99に近く、売り圧力が続くなら次の重要な調整ゾーンになり得ます。
短期の指標はすでに弱まり始めています。RSIは27まで下落し、MACDはマイナスに転じました。これにより反発の可能性は高まりますが、調整シナリオが無効になるわけではありません。
私にとっての重要な問いはシンプルです。買い手は769〜772の領域を守れるのか、それともBNBがこの水準を下抜けしてさらに深く下落するのか。
このゾーンからの反応は、底を先に当てにいくよりも、はるかに多くのことを教えてくれるでしょう。
1
1
391
·
--
$DEXE は、大きな値動きの可能性を示す兆候を見せています。4時間足チャートでは、価格は1.922前後で推移しており、EMA7は1.876、EMA25は1.852を上回っています。これは短期の買い手が主導権を維持していることを示唆しています。一方で、市場はEMA99付近の重要なレジスタンス(目安:1.892近辺)へ接近しています。
RSIは約78で、強い買いの勢いを示す一方で、短期的な押し目が起きるリスクも高い状態です。MACDはわずかにプラスのままで、強気のモメンタムがまだ存在していることを示しています。取引量は増加しており、買い圧力が継続するなら、より強い値動きを支える可能性があります。
重要なレジスタンス帯は1.93〜1.98です。強い出来高を伴う明確なブレイクが起これば、2.00に向けて道が開け、さらに高い水準も視野に入ります。ただし、価格がレジスタンスを突破できない場合は、市場がサポートを試す中で、1.89〜1.85への押し戻しが起こる可能性があります。
DEXEは重要な局面に近づいています。価格上昇、プラスのMACD、そして高水準のRSIがそろっていることから、ボラティリティが高まるかもしれません。次の大きな動きは、買い手がレジスタンスを上抜けられるか、それとも売り手が調整を引き起こすかにかかっています。
$DEXE は大きな動きの準備をしている可能性がありますが、価格アクションと出来高による確認が引き続き重要です。トレーダーは、強い上昇後に追いかけるのではなく、レジスタンスとサポートの水準を慎重に見守るべきです。{spot}(DEXEUSDT)
$DEXE は、大きな値動きの可能性を示す兆候を見せています。4時間足チャートでは、価格は1.922前後で推移しており、EMA7は1.876、EMA25は1.852を上回っています。これは短期の買い手が主導権を維持していることを示唆しています。一方で、市場はEMA99付近の重要なレジスタンス(目安:1.892近辺)へ接近しています。
RSIは約78で、強い買いの勢いを示す一方で、短期的な押し目が起きるリスクも高い状態です。MACDはわずかにプラスのままで、強気のモメンタムがまだ存在していることを示しています。取引量は増加しており、買い圧力が継続するなら、より強い値動きを支える可能性があります。
重要なレジスタンス帯は1.93〜1.98です。強い出来高を伴う明確なブレイクが起これば、2.00に向けて道が開け、さらに高い水準も視野に入ります。ただし、価格がレジスタンスを突破できない場合は、市場がサポートを試す中で、1.89〜1.85への押し戻しが起こる可能性があります。
DEXEは重要な局面に近づいています。価格上昇、プラスのMACD、そして高水準のRSIがそろっていることから、ボラティリティが高まるかもしれません。次の大きな動きは、買い手がレジスタンスを上抜けられるか、それとも売り手が調整を引き起こすかにかかっています。
$DEXE は大きな動きの準備をしている可能性がありますが、価格アクションと出来高による確認が引き続き重要です。トレーダーは、強い上昇後に追いかけるのではなく、レジスタンスとサポートの水準を慎重に見守るべきです。
RSIは約78で、強い買いの勢いを示す一方で、短期的な押し目が起きるリスクも高い状態です。MACDはわずかにプラスのままで、強気のモメンタムがまだ存在していることを示しています。取引量は増加しており、買い圧力が継続するなら、より強い値動きを支える可能性があります。
重要なレジスタンス帯は1.93〜1.98です。強い出来高を伴う明確なブレイクが起これば、2.00に向けて道が開け、さらに高い水準も視野に入ります。ただし、価格がレジスタンスを突破できない場合は、市場がサポートを試す中で、1.89〜1.85への押し戻しが起こる可能性があります。
DEXEは重要な局面に近づいています。価格上昇、プラスのMACD、そして高水準のRSIがそろっていることから、ボラティリティが高まるかもしれません。次の大きな動きは、買い手がレジスタンスを上抜けられるか、それとも売り手が調整を引き起こすかにかかっています。
$DEXE は大きな動きの準備をしている可能性がありますが、価格アクションと出来高による確認が引き続き重要です。トレーダーは、強い上昇後に追いかけるのではなく、レジスタンスとサポートの水準を慎重に見守るべきです。
1
329
·
--
$DEXE は4Hチャートで臨界点に近づいています。現在の価格はおよそ$1.87で、長期EMA99は$1.90付近です。同時に、短期・中期の構造も改善しており、EMA7がEMA25の上に位置し、価格は両方の平均線の上で推移しています。
注目すべきポイントは$1.90〜$1.91で何が起きるかです。EMA99を一時的に上回る動きは単なる突入にすぎません。もし価格がすぐにその下へ戻るなら、長期的な抵抗は依然として効いていることになります。一方で、EMA99の上で持続的に推移するなら、起こり得る構造変化についてより多くを示唆します。
ただしRSIはすでに83前後で、出来高は直近の平均と比べると比較的低いままです。つまり、今回の上昇は強いものの、まだ確認が欠けています。
重要なのは、$DEXE が単にEMA99をブレイクするかどうかだけではなく、価格がそこに到達したときにどう振る舞うかです。$1.90〜$1.91での反応によって、それが単なる短期的な回復なのか、より大きな構造的転換の始まりなのかが見えてきます。
市場では、節目の水準は物語の半分にすぎません。節目での反応こそが本当の情報です。
{spot}(DEXEUSDT)
$DEXE は4Hチャートで臨界点に近づいています。現在の価格はおよそ$1.87で、長期EMA99は$1.90付近です。同時に、短期・中期の構造も改善しており、EMA7がEMA25の上に位置し、価格は両方の平均線の上で推移しています。
注目すべきポイントは$1.90〜$1.91で何が起きるかです。EMA99を一時的に上回る動きは単なる突入にすぎません。もし価格がすぐにその下へ戻るなら、長期的な抵抗は依然として効いていることになります。一方で、EMA99の上で持続的に推移するなら、起こり得る構造変化についてより多くを示唆します。
ただしRSIはすでに83前後で、出来高は直近の平均と比べると比較的低いままです。つまり、今回の上昇は強いものの、まだ確認が欠けています。
重要なのは、$DEXE が単にEMA99をブレイクするかどうかだけではなく、価格がそこに到達したときにどう振る舞うかです。$1.90〜$1.91での反応によって、それが単なる短期的な回復なのか、より大きな構造的転換の始まりなのかが見えてきます。
市場では、節目の水準は物語の半分にすぎません。節目での反応こそが本当の情報です。
注目すべきポイントは$1.90〜$1.91で何が起きるかです。EMA99を一時的に上回る動きは単なる突入にすぎません。もし価格がすぐにその下へ戻るなら、長期的な抵抗は依然として効いていることになります。一方で、EMA99の上で持続的に推移するなら、起こり得る構造変化についてより多くを示唆します。
ただしRSIはすでに83前後で、出来高は直近の平均と比べると比較的低いままです。つまり、今回の上昇は強いものの、まだ確認が欠けています。
重要なのは、$DEXE が単にEMA99をブレイクするかどうかだけではなく、価格がそこに到達したときにどう振る舞うかです。$1.90〜$1.91での反応によって、それが単なる短期的な回復なのか、より大きな構造的転換の始まりなのかが見えてきます。
市場では、節目の水準は物語の半分にすぎません。節目での反応こそが本当の情報です。
512
·
--
新鮮な息 $BNB は、確かに二つの勢力の綱引きのように見えます。
$720のエリアまで下落した後、買い手はBNBを$750以上へ戻し、そして本日の高値はすでに約$759でした。現在のチャートでは、EMA7 ≈ $750、EMA25 ≈ $743、EMA99 ≈ $730 — つまり短期的には買い手が動きを支配していますが、$759付近では売り手がすでに反応を見せています。市場データも、BNBが現在およそ$750のあたりで取引されており、24時間で3%以上上昇していることを示しています。
誰が誰を締め上げているのか?
買い手は $743〜$750 より上に売り手を維持していますが、売り手はまだ $759〜$760 のゾーンを明け渡していません。
もし $BNB が $760 より上で定着すれば、次の論点は「リバウンドがあるかどうか」ではなく、「それの後に買い手が動きを継続できるかどうか」になります。一方で、$759〜$760 が再び価格を下へ押し戻すなら、買い手は EMA25 を防衛する必要が出てきます。
今、BNBは単に上がっているだけではありません——数日間の攻防の後に、誰がより強いのかを確かめています。そして、まさに $760 への反応が、状況を本当に支配しているのが誰かを示すかもしれません。
{spot}(BNBUSDT)
新鮮な息 $BNB は、確かに二つの勢力の綱引きのように見えます。
$720のエリアまで下落した後、買い手はBNBを$750以上へ戻し、そして本日の高値はすでに約$759でした。現在のチャートでは、EMA7 ≈ $750、EMA25 ≈ $743、EMA99 ≈ $730 — つまり短期的には買い手が動きを支配していますが、$759付近では売り手がすでに反応を見せています。市場データも、BNBが現在およそ$750のあたりで取引されており、24時間で3%以上上昇していることを示しています。
誰が誰を締め上げているのか?
買い手は $743〜$750 より上に売り手を維持していますが、売り手はまだ $759〜$760 のゾーンを明け渡していません。
もし $BNB が $760 より上で定着すれば、次の論点は「リバウンドがあるかどうか」ではなく、「それの後に買い手が動きを継続できるかどうか」になります。一方で、$759〜$760 が再び価格を下へ押し戻すなら、買い手は EMA25 を防衛する必要が出てきます。
今、BNBは単に上がっているだけではありません——数日間の攻防の後に、誰がより強いのかを確かめています。そして、まさに $760 への反応が、状況を本当に支配しているのが誰かを示すかもしれません。
$720のエリアまで下落した後、買い手はBNBを$750以上へ戻し、そして本日の高値はすでに約$759でした。現在のチャートでは、EMA7 ≈ $750、EMA25 ≈ $743、EMA99 ≈ $730 — つまり短期的には買い手が動きを支配していますが、$759付近では売り手がすでに反応を見せています。市場データも、BNBが現在およそ$750のあたりで取引されており、24時間で3%以上上昇していることを示しています。
誰が誰を締め上げているのか?
買い手は $743〜$750 より上に売り手を維持していますが、売り手はまだ $759〜$760 のゾーンを明け渡していません。
もし $BNB が $760 より上で定着すれば、次の論点は「リバウンドがあるかどうか」ではなく、「それの後に買い手が動きを継続できるかどうか」になります。一方で、$759〜$760 が再び価格を下へ押し戻すなら、買い手は EMA25 を防衛する必要が出てきます。
今、BNBは単に上がっているだけではありません——数日間の攻防の後に、誰がより強いのかを確かめています。そして、まさに $760 への反応が、状況を本当に支配しているのが誰かを示すかもしれません。
1
2
823
·
--
翻訳参照
$BNB is back at a critical decision point. After dropping from the 741 area toward 713, the price has recovered to 724.85 and is now testing the 725–726 zone, where the 1H EMA99 is sitting at 725.73.
EMA7 at 723.80 and EMA25 at 722.51 have already turned supportive, while MACD has moved back into positive territory and RSI is around 63.
The interesting part is that BNB is not yet clearly bullish. A clean break and hold above EMA99 could open the way toward 735 and possibly the previous 741 high. But rejection here would show that the longer-term pressure is still present and could send the price back toward 718–713.
$BNB is no longer simply falling. It is testing whether this recovery is the beginning of a new move or just another bounce inside the correction. The next few candles may tell us more than the last few days.
{spot}(BNBUSDT)
$BNB is back at a critical decision point. After dropping from the 741 area toward 713, the price has recovered to 724.85 and is now testing the 725–726 zone, where the 1H EMA99 is sitting at 725.73.
EMA7 at 723.80 and EMA25 at 722.51 have already turned supportive, while MACD has moved back into positive territory and RSI is around 63.
The interesting part is that BNB is not yet clearly bullish. A clean break and hold above EMA99 could open the way toward 735 and possibly the previous 741 high. But rejection here would show that the longer-term pressure is still present and could send the price back toward 718–713.
$BNB is no longer simply falling. It is testing whether this recovery is the beginning of a new move or just another bounce inside the correction. The next few candles may tell us more than the last few days.
EMA7 at 723.80 and EMA25 at 722.51 have already turned supportive, while MACD has moved back into positive territory and RSI is around 63.
The interesting part is that BNB is not yet clearly bullish. A clean break and hold above EMA99 could open the way toward 735 and possibly the previous 741 high. But rejection here would show that the longer-term pressure is still present and could send the price back toward 718–713.
$BNB is no longer simply falling. It is testing whether this recovery is the beginning of a new move or just another bounce inside the correction. The next few candles may tell us more than the last few days.
1
131
·
--
翻訳参照
$BNB /USDT is showing a bullish structure on the 1H chart.
Price is trading above EMA7 at 754.25, EMA25 at 752.33 and EMA99 at 745.39, while MACD is slightly positive and RSI is around 59.
The preferred strategy is to buy a pullback rather than chase the current price.
Long setup:
Entry 753.5–755.5,
Stop Loss 749.0,
Take Profit 1 761.0,
Take Profit 2 768.5,
Take Profit 3 781.0.
The strongest entry would be near 753–754 if the level holds and buyers appear with increasing volume. A 1H close below 749 would invalidate the setup. EMA99 around 745 is the major trend-support level.
Trading lesson: A good long is not simply buying because the price is rising. The better opportunity is to wait for a controlled pullback into support, confirm that buyers are defending it, and only then enter with a predefined stop and targets.
$BNB /USDT is showing a bullish structure on the 1H chart.
Price is trading above EMA7 at 754.25, EMA25 at 752.33 and EMA99 at 745.39, while MACD is slightly positive and RSI is around 59.
The preferred strategy is to buy a pullback rather than chase the current price.
Long setup:
Entry 753.5–755.5,
Stop Loss 749.0,
Take Profit 1 761.0,
Take Profit 2 768.5,
Take Profit 3 781.0.
The strongest entry would be near 753–754 if the level holds and buyers appear with increasing volume. A 1H close below 749 would invalidate the setup. EMA99 around 745 is the major trend-support level.
Trading lesson: A good long is not simply buying because the price is rising. The better opportunity is to wait for a controlled pullback into support, confirm that buyers are defending it, and only then enter with a predefined stop and targets.
Price is trading above EMA7 at 754.25, EMA25 at 752.33 and EMA99 at 745.39, while MACD is slightly positive and RSI is around 59.
The preferred strategy is to buy a pullback rather than chase the current price.
Long setup:
Entry 753.5–755.5,
Stop Loss 749.0,
Take Profit 1 761.0,
Take Profit 2 768.5,
Take Profit 3 781.0.
The strongest entry would be near 753–754 if the level holds and buyers appear with increasing volume. A 1H close below 749 would invalidate the setup. EMA99 around 745 is the major trend-support level.
Trading lesson: A good long is not simply buying because the price is rising. The better opportunity is to wait for a controlled pullback into support, confirm that buyers are defending it, and only then enter with a predefined stop and targets.
1
85
·
--
$DEXE は、チャートが最初に示唆する以上に、はるかに面白い局面へ入ろうとしています。7月のピーク付近(約 $49)からの極端な急落の後、このトークンは何週間もかけてベース(下支え)を確立しようとしてきました。
いま私の注目を引くのは、構造の変化です。1Hチャートでは、これまで続いていた切り下げの安値の連続が $1.89 付近でいったん止まり、EMA7・EMA25・EMA99 がほぼ同じあたり($2.00 付近)にまで圧縮されています。これは、移動平均が大きく離れていて下向きに示されていた、以前のチャートとはまったく異なる状況です。
重要な問いは、これが蓄積(アキュムレーション)なのか、それとも下落の継続に向けた単なる一時停止なのか、という点です。
出来高が増えながら $2.07 を上抜ける動きは、買い手が主導権を握りつつあることを示す、最初の説得力のあるシグナルになるでしょう。そうなれば、次に注目するのは $2.16〜$2.20 という価格帯です。さらに重要なのは、EMA25/EMA99 のクラスター(集まり)を上回る状態が継続することで、現在の「弱気のリカバリー」的な構造が、「本物のトレンド反転」を試す形に変わる可能性があることです。
ただし罠もあります。DEXE は、いかに激しく動き得るかをすでに示しています。このトークンは過去最高値が $48.91 付近にあった後、90%以上の下落を経験しました。確認なしにブレイクを追いかけるのは、相当なリスクを伴います。
私にとって最も興味深いのは、DEXE が明日値上がりするかどうかではありません。過去最大の売りの後、市場が静かに新しい構造を組み立てているのかどうか、そこにあります。
次の数本の足が、$2.00〜$2.07 付近で示すことは、これまでの数週間よりもはるかに多くを教えてくれるかもしれません。
{spot}(DEXEUSDT)
$DEXE は、チャートが最初に示唆する以上に、はるかに面白い局面へ入ろうとしています。7月のピーク付近(約 $49)からの極端な急落の後、このトークンは何週間もかけてベース(下支え)を確立しようとしてきました。
いま私の注目を引くのは、構造の変化です。1Hチャートでは、これまで続いていた切り下げの安値の連続が $1.89 付近でいったん止まり、EMA7・EMA25・EMA99 がほぼ同じあたり($2.00 付近)にまで圧縮されています。これは、移動平均が大きく離れていて下向きに示されていた、以前のチャートとはまったく異なる状況です。
重要な問いは、これが蓄積(アキュムレーション)なのか、それとも下落の継続に向けた単なる一時停止なのか、という点です。
出来高が増えながら $2.07 を上抜ける動きは、買い手が主導権を握りつつあることを示す、最初の説得力のあるシグナルになるでしょう。そうなれば、次に注目するのは $2.16〜$2.20 という価格帯です。さらに重要なのは、EMA25/EMA99 のクラスター(集まり)を上回る状態が継続することで、現在の「弱気のリカバリー」的な構造が、「本物のトレンド反転」を試す形に変わる可能性があることです。
ただし罠もあります。DEXE は、いかに激しく動き得るかをすでに示しています。このトークンは過去最高値が $48.91 付近にあった後、90%以上の下落を経験しました。確認なしにブレイクを追いかけるのは、相当なリスクを伴います。
私にとって最も興味深いのは、DEXE が明日値上がりするかどうかではありません。過去最大の売りの後、市場が静かに新しい構造を組み立てているのかどうか、そこにあります。
次の数本の足が、$2.00〜$2.07 付近で示すことは、これまでの数週間よりもはるかに多くを教えてくれるかもしれません。
いま私の注目を引くのは、構造の変化です。1Hチャートでは、これまで続いていた切り下げの安値の連続が $1.89 付近でいったん止まり、EMA7・EMA25・EMA99 がほぼ同じあたり($2.00 付近)にまで圧縮されています。これは、移動平均が大きく離れていて下向きに示されていた、以前のチャートとはまったく異なる状況です。
重要な問いは、これが蓄積(アキュムレーション)なのか、それとも下落の継続に向けた単なる一時停止なのか、という点です。
出来高が増えながら $2.07 を上抜ける動きは、買い手が主導権を握りつつあることを示す、最初の説得力のあるシグナルになるでしょう。そうなれば、次に注目するのは $2.16〜$2.20 という価格帯です。さらに重要なのは、EMA25/EMA99 のクラスター(集まり)を上回る状態が継続することで、現在の「弱気のリカバリー」的な構造が、「本物のトレンド反転」を試す形に変わる可能性があることです。
ただし罠もあります。DEXE は、いかに激しく動き得るかをすでに示しています。このトークンは過去最高値が $48.91 付近にあった後、90%以上の下落を経験しました。確認なしにブレイクを追いかけるのは、相当なリスクを伴います。
私にとって最も興味深いのは、DEXE が明日値上がりするかどうかではありません。過去最大の売りの後、市場が静かに新しい構造を組み立てているのかどうか、そこにあります。
次の数本の足が、$2.00〜$2.07 付近で示すことは、これまでの数週間よりもはるかに多くを教えてくれるかもしれません。
1
556
·
--
$DEXE は、これまでの急騰の大部分を消し去った激しい崩壊の後で、非常に異なって見えます。1Hチャートでは現在価格は約$1.87で、EMA7は$1.87、EMA25は$1.90、EMA99は$1.93です。3本の移動平均が極めて狭いゾーンに圧縮されています——大きなトレンドの後、ボラティリティが抑え込まれているサインです。
注目すべきは、次に何が起きるかです。出来高は大幅に低下し、RSIは中立、MACDはわずかにマイナスのままです。現時点では強い買いの衝動はありませんが、攻撃的な売り圧力もありません。市場は「待っている」ように見えます。
もう一つ、確認しておきたい点があります。最近のオンチェーン分析では、7月のクラッシュ直前に、プロジェクトに紐づくウォレットからBinanceへ約0.76M $DEXE が移動したことが報告されていますが、新たなトークン発行は検出されていませんでした。後にこれらのウォレットは空にされており、今回の売りは恒常的な供給源というよりは、一度限りの出来事だった可能性が示唆されます。
一方で、DeXe自体はDAO基盤の開発を継続しており、新しいステーキングプールや、ガバナンス実行にもう一つのセキュリティ・チェックを追加することを目的としたValidator Layerも含まれています。
つまり本当のストーリーは、もはや単に「DEXEが下落している」ということではありません。極端な圧縮を、蓄積(アキュムレーション)へ転換できるかどうかです。$1.90〜$1.93のEMAクラスターを上回る状態が継続すれば、バランスが変わり始めた最初の興味深いシグナルになるでしょう。そこに失敗すれば、より広い下落構造は維持され続けます。
起きたすべての後で、DEXEは最も興味深い局面に入っているのかもしれません。クラッシュそのものではなく、その後に市場が何を選ぶか——その瞬間です。
{spot}(DEXEUSDT)
$DEXE は、これまでの急騰の大部分を消し去った激しい崩壊の後で、非常に異なって見えます。1Hチャートでは現在価格は約$1.87で、EMA7は$1.87、EMA25は$1.90、EMA99は$1.93です。3本の移動平均が極めて狭いゾーンに圧縮されています——大きなトレンドの後、ボラティリティが抑え込まれているサインです。
注目すべきは、次に何が起きるかです。出来高は大幅に低下し、RSIは中立、MACDはわずかにマイナスのままです。現時点では強い買いの衝動はありませんが、攻撃的な売り圧力もありません。市場は「待っている」ように見えます。
もう一つ、確認しておきたい点があります。最近のオンチェーン分析では、7月のクラッシュ直前に、プロジェクトに紐づくウォレットからBinanceへ約0.76M $DEXE が移動したことが報告されていますが、新たなトークン発行は検出されていませんでした。後にこれらのウォレットは空にされており、今回の売りは恒常的な供給源というよりは、一度限りの出来事だった可能性が示唆されます。
一方で、DeXe自体はDAO基盤の開発を継続しており、新しいステーキングプールや、ガバナンス実行にもう一つのセキュリティ・チェックを追加することを目的としたValidator Layerも含まれています。
つまり本当のストーリーは、もはや単に「DEXEが下落している」ということではありません。極端な圧縮を、蓄積(アキュムレーション)へ転換できるかどうかです。$1.90〜$1.93のEMAクラスターを上回る状態が継続すれば、バランスが変わり始めた最初の興味深いシグナルになるでしょう。そこに失敗すれば、より広い下落構造は維持され続けます。
起きたすべての後で、DEXEは最も興味深い局面に入っているのかもしれません。クラッシュそのものではなく、その後に市場が何を選ぶか——その瞬間です。
注目すべきは、次に何が起きるかです。出来高は大幅に低下し、RSIは中立、MACDはわずかにマイナスのままです。現時点では強い買いの衝動はありませんが、攻撃的な売り圧力もありません。市場は「待っている」ように見えます。
もう一つ、確認しておきたい点があります。最近のオンチェーン分析では、7月のクラッシュ直前に、プロジェクトに紐づくウォレットからBinanceへ約0.76M $DEXE が移動したことが報告されていますが、新たなトークン発行は検出されていませんでした。後にこれらのウォレットは空にされており、今回の売りは恒常的な供給源というよりは、一度限りの出来事だった可能性が示唆されます。
一方で、DeXe自体はDAO基盤の開発を継続しており、新しいステーキングプールや、ガバナンス実行にもう一つのセキュリティ・チェックを追加することを目的としたValidator Layerも含まれています。
つまり本当のストーリーは、もはや単に「DEXEが下落している」ということではありません。極端な圧縮を、蓄積(アキュムレーション)へ転換できるかどうかです。$1.90〜$1.93のEMAクラスターを上回る状態が継続すれば、バランスが変わり始めた最初の興味深いシグナルになるでしょう。そこに失敗すれば、より広い下落構造は維持され続けます。
起きたすべての後で、DEXEは最も興味深い局面に入っているのかもしれません。クラッシュそのものではなく、その後に市場が何を選ぶか——その瞬間です。
1
259
·
--
$BNB は$600周辺での下支えを確立しようとしているものの、長期的なトレンドはまだ完全には強気(ブル)に転換していません。この上昇は新しいサイクルの始まりになり得る一方で、より大きな弱気(ベア)の構造の中での単なる一時的な休止に過ぎない可能性もあります。
市場は$600のあたりで安定しようとしているものの、より長期の全体トレンドは依然として弱気に見えます。最近の上昇によって短期的なセンチメントは改善しましたが、ブレイクアウトが1回起きただけではトレンドの全面的な反転を確認するには不十分です。より大きな時間軸で高値更新と安値更新が確立されるまでは、強気の継続も、別の大きな調整も現実的なシナリオとして残ります。
{spot}(BNBUSDT)
$BNB は$600周辺での下支えを確立しようとしているものの、長期的なトレンドはまだ完全には強気(ブル)に転換していません。この上昇は新しいサイクルの始まりになり得る一方で、より大きな弱気(ベア)の構造の中での単なる一時的な休止に過ぎない可能性もあります。
市場は$600のあたりで安定しようとしているものの、より長期の全体トレンドは依然として弱気に見えます。最近の上昇によって短期的なセンチメントは改善しましたが、ブレイクアウトが1回起きただけではトレンドの全面的な反転を確認するには不十分です。より大きな時間軸で高値更新と安値更新が確立されるまでは、強気の継続も、別の大きな調整も現実的なシナリオとして残ります。
市場は$600のあたりで安定しようとしているものの、より長期の全体トレンドは依然として弱気に見えます。最近の上昇によって短期的なセンチメントは改善しましたが、ブレイクアウトが1回起きただけではトレンドの全面的な反転を確認するには不十分です。より大きな時間軸で高値更新と安値更新が確立されるまでは、強気の継続も、別の大きな調整も現実的なシナリオとして残ります。
1
81
·
--
$DEXE を数日間観察した後、構造が私の想定していたシナリオに近づき始めています。$2.20付近で見られた急落への下支えがあり、買い手が入り、マーケットは次の衝動的な売り崩しではなく、より高い安値を作ろうとしています。
1Hチャートでは、価格がEMA7を取り戻し、EMA25をテストしている一方で、MACDはプラスに転じており、RSIも売られ過ぎの水準から回復しています。これはまだ新たな強気トレンドを確定するものではありませんが、弱気の勢いが弱まっていることは示しています。
最も重要な水準は依然としてEMA99付近の$3.08です。価格がそれを下回っている限り、より大きなトレンドはまだ弱気のままです。ただし、買い手が現状のレンジを守り続け、出来高が徐々に増えていくなら、EMA99へ向かう動きはますます起こりやすくなります。そこが本当の試金石になります。明確なブレイクアウトがあれば、より大きな回復への道が開けますが、そこで拒否されれば、もう一段の調整理固、あるいは$2.20のサポート再テストを裏付けることになります。
私の見方は変わっていません。トレンドが一直線に反転することはまれです。まずは安定化が来て、次に流動性が溜まり、その後に市場が高値方向を続けるのか、それとも下落トレンドに戻るのかを判断します。現在、DEXEはその移行局面にあるように見えるため、すべてのローソク足を追いかけるよりも忍耐の価値が高くなります。
{spot}(DEXEUSDT)
$DEXE を数日間観察した後、構造が私の想定していたシナリオに近づき始めています。$2.20付近で見られた急落への下支えがあり、買い手が入り、マーケットは次の衝動的な売り崩しではなく、より高い安値を作ろうとしています。
1Hチャートでは、価格がEMA7を取り戻し、EMA25をテストしている一方で、MACDはプラスに転じており、RSIも売られ過ぎの水準から回復しています。これはまだ新たな強気トレンドを確定するものではありませんが、弱気の勢いが弱まっていることは示しています。
最も重要な水準は依然としてEMA99付近の$3.08です。価格がそれを下回っている限り、より大きなトレンドはまだ弱気のままです。ただし、買い手が現状のレンジを守り続け、出来高が徐々に増えていくなら、EMA99へ向かう動きはますます起こりやすくなります。そこが本当の試金石になります。明確なブレイクアウトがあれば、より大きな回復への道が開けますが、そこで拒否されれば、もう一段の調整理固、あるいは$2.20のサポート再テストを裏付けることになります。
私の見方は変わっていません。トレンドが一直線に反転することはまれです。まずは安定化が来て、次に流動性が溜まり、その後に市場が高値方向を続けるのか、それとも下落トレンドに戻るのかを判断します。現在、DEXEはその移行局面にあるように見えるため、すべてのローソク足を追いかけるよりも忍耐の価値が高くなります。
1Hチャートでは、価格がEMA7を取り戻し、EMA25をテストしている一方で、MACDはプラスに転じており、RSIも売られ過ぎの水準から回復しています。これはまだ新たな強気トレンドを確定するものではありませんが、弱気の勢いが弱まっていることは示しています。
最も重要な水準は依然としてEMA99付近の$3.08です。価格がそれを下回っている限り、より大きなトレンドはまだ弱気のままです。ただし、買い手が現状のレンジを守り続け、出来高が徐々に増えていくなら、EMA99へ向かう動きはますます起こりやすくなります。そこが本当の試金石になります。明確なブレイクアウトがあれば、より大きな回復への道が開けますが、そこで拒否されれば、もう一段の調整理固、あるいは$2.20のサポート再テストを裏付けることになります。
私の見方は変わっていません。トレンドが一直線に反転することはまれです。まずは安定化が来て、次に流動性が溜まり、その後に市場が高値方向を続けるのか、それとも下落トレンドに戻るのかを判断します。現在、DEXEはその移行局面にあるように見えるため、すべてのローソク足を追いかけるよりも忍耐の価値が高くなります。
1
460
·
--
$BNB はまたしても市場を驚かせました。ほんの数週間前までは、議論の中心は下方向の目標設定でしたが、今日のチャートはまったく別の物語を伝えています。
4時間足では、価格が単一のインパルス的な動きで EMA7、EMA25、そして EMA99 を取り戻しました。上昇する出来高と強いMACDのクロスに裏付けられています。これは、数週間にわたる弱気の圧力の後に訪れた、市場構造における最初の意味のある変化です。
もはや「$BNB が跳ね返すことができるのか」という問題ではありません。実際の論点は、このブレイクがより大きなトレンド転換の始まりを示しているのかどうかです。
私にとって最も興味深いのは、現在の価格そのものではなく、$650 から $666 の間のゾーンです。この領域は過去に主要なレジスタンスとして機能しており、買い手と売り手の次の戦場になり得ます。強気派がそれをうまく取り戻せれば、中長期の見通しは劇的に変わる可能性があります。
もちろん、何も保証はありません。RSI はすでに買われ過ぎ領域にあるため、上昇の継続の前に健全な押し目が入るのは完全に自然なことです。私は緑のローソク足を追いかける戦略を取ったことはありません。
市場は、私たちがそうしたいから動くわけではありません。買い手と売り手が絶えず力関係のバランスを変えるから動くのです。チャートは単に、そのバランスを私たちに示しているだけです。
どう思いますか? BNB にとって新しい強気局面の始まりでしょうか、それとも次の下げ局面の前の「強気トラップ」でしょうか。ぜひさまざまな意見を聞かせてください。
{spot}(BNBUSDT)
$BNB はまたしても市場を驚かせました。ほんの数週間前までは、議論の中心は下方向の目標設定でしたが、今日のチャートはまったく別の物語を伝えています。
4時間足では、価格が単一のインパルス的な動きで EMA7、EMA25、そして EMA99 を取り戻しました。上昇する出来高と強いMACDのクロスに裏付けられています。これは、数週間にわたる弱気の圧力の後に訪れた、市場構造における最初の意味のある変化です。
もはや「$BNB が跳ね返すことができるのか」という問題ではありません。実際の論点は、このブレイクがより大きなトレンド転換の始まりを示しているのかどうかです。
私にとって最も興味深いのは、現在の価格そのものではなく、$650 から $666 の間のゾーンです。この領域は過去に主要なレジスタンスとして機能しており、買い手と売り手の次の戦場になり得ます。強気派がそれをうまく取り戻せれば、中長期の見通しは劇的に変わる可能性があります。
もちろん、何も保証はありません。RSI はすでに買われ過ぎ領域にあるため、上昇の継続の前に健全な押し目が入るのは完全に自然なことです。私は緑のローソク足を追いかける戦略を取ったことはありません。
市場は、私たちがそうしたいから動くわけではありません。買い手と売り手が絶えず力関係のバランスを変えるから動くのです。チャートは単に、そのバランスを私たちに示しているだけです。
どう思いますか? BNB にとって新しい強気局面の始まりでしょうか、それとも次の下げ局面の前の「強気トラップ」でしょうか。ぜひさまざまな意見を聞かせてください。
4時間足では、価格が単一のインパルス的な動きで EMA7、EMA25、そして EMA99 を取り戻しました。上昇する出来高と強いMACDのクロスに裏付けられています。これは、数週間にわたる弱気の圧力の後に訪れた、市場構造における最初の意味のある変化です。
もはや「$BNB が跳ね返すことができるのか」という問題ではありません。実際の論点は、このブレイクがより大きなトレンド転換の始まりを示しているのかどうかです。
私にとって最も興味深いのは、現在の価格そのものではなく、$650 から $666 の間のゾーンです。この領域は過去に主要なレジスタンスとして機能しており、買い手と売り手の次の戦場になり得ます。強気派がそれをうまく取り戻せれば、中長期の見通しは劇的に変わる可能性があります。
もちろん、何も保証はありません。RSI はすでに買われ過ぎ領域にあるため、上昇の継続の前に健全な押し目が入るのは完全に自然なことです。私は緑のローソク足を追いかける戦略を取ったことはありません。
市場は、私たちがそうしたいから動くわけではありません。買い手と売り手が絶えず力関係のバランスを変えるから動くのです。チャートは単に、そのバランスを私たちに示しているだけです。
どう思いますか? BNB にとって新しい強気局面の始まりでしょうか、それとも次の下げ局面の前の「強気トラップ」でしょうか。ぜひさまざまな意見を聞かせてください。
1
104
·
--
$DEXE は興味深い意思決定ゾーンに接近しています。急な下落(シャープなリコレクション)の後でも、価格は $1.9〜2.1 のエリアを再訪する可能性があります。そこでは買い手が市場を防衛し、新たな蓄積(アキュムレーション)レンジを形成することがあり得ます。そこで強い買いの出来高が現れれば、中期的な回復の確率は大きく上がります。
一方で、売り手が主導権を保ち、サポートが機能しない場合は、下落トレンドが続き、その後に持続可能な反発が起こるまで時間がかかるかもしれません。
今のところ私は「緑のローソク足」を追いかけていません。出来高、買い手の反応、そしてモメンタムの明確な転換といった「確認」を待っています。不安定な相場では、忍耐がスピードより勝つことが多いです。
ポジションを取る前に、必ず相場があなたの見立てを確認してくれるまで待ちましょう。DYOR。
{spot}(DEXEUSDT)
$DEXE は興味深い意思決定ゾーンに接近しています。急な下落(シャープなリコレクション)の後でも、価格は $1.9〜2.1 のエリアを再訪する可能性があります。そこでは買い手が市場を防衛し、新たな蓄積(アキュムレーション)レンジを形成することがあり得ます。そこで強い買いの出来高が現れれば、中期的な回復の確率は大きく上がります。
一方で、売り手が主導権を保ち、サポートが機能しない場合は、下落トレンドが続き、その後に持続可能な反発が起こるまで時間がかかるかもしれません。
今のところ私は「緑のローソク足」を追いかけていません。出来高、買い手の反応、そしてモメンタムの明確な転換といった「確認」を待っています。不安定な相場では、忍耐がスピードより勝つことが多いです。
ポジションを取る前に、必ず相場があなたの見立てを確認してくれるまで待ちましょう。DYOR。
一方で、売り手が主導権を保ち、サポートが機能しない場合は、下落トレンドが続き、その後に持続可能な反発が起こるまで時間がかかるかもしれません。
今のところ私は「緑のローソク足」を追いかけていません。出来高、買い手の反応、そしてモメンタムの明確な転換といった「確認」を待っています。不安定な相場では、忍耐がスピードより勝つことが多いです。
ポジションを取る前に、必ず相場があなたの見立てを確認してくれるまで待ちましょう。DYOR。
1
429
·
--
市場は、最も欺瞞的になる直前に最もはっきり見えることがよくあります。現在、$DEXE について現実的な2つのシナリオが見え、それぞれに注目する価値があります。
1つ目のシナリオは強気トラップです。価格が直近のローカル高値を一時的に上抜けし、ブレイクアウトの買い手を引きつける可能性があります。十分な流動性が集まると、売り手が強く介入し、急激な拒否(リジェクション)と深い押し目につながるかもしれません。
2つ目のシナリオは弱気トラップです。価格がまず短期のサポートを下抜け、ロングポジションのストップロスを誘発する可能性があります。買い手がすぐに売りの圧力を吸収すれば、その誤ったブレイクダウンが、より高いレジスタンス水準に向けた次の強い上昇の燃料になることもあります。
重要な教訓は、すべてのローソク足を当てようとしないことです。流動性が奪われた後の確認を待つことが大切です。大きな動きの前には、しばしば誤った動きが先行します。そして忍耐は、勢いを追って飛びつくよりも、リスク対リターンの観点でより良い機会をもたらすことが多いです。
このような相場では、次の利益の出る取引を見つけるのと同じくらい、資本を守ることが重要です。確認を待つトレーダーは、最初のブレイクアウトに反応するトレーダーよりも、結果的により良いエントリーを得ることが多いからです。
{future}(DEXEUSDT)
市場は、最も欺瞞的になる直前に最もはっきり見えることがよくあります。現在、$DEXE について現実的な2つのシナリオが見え、それぞれに注目する価値があります。
1つ目のシナリオは強気トラップです。価格が直近のローカル高値を一時的に上抜けし、ブレイクアウトの買い手を引きつける可能性があります。十分な流動性が集まると、売り手が強く介入し、急激な拒否(リジェクション)と深い押し目につながるかもしれません。
2つ目のシナリオは弱気トラップです。価格がまず短期のサポートを下抜け、ロングポジションのストップロスを誘発する可能性があります。買い手がすぐに売りの圧力を吸収すれば、その誤ったブレイクダウンが、より高いレジスタンス水準に向けた次の強い上昇の燃料になることもあります。
重要な教訓は、すべてのローソク足を当てようとしないことです。流動性が奪われた後の確認を待つことが大切です。大きな動きの前には、しばしば誤った動きが先行します。そして忍耐は、勢いを追って飛びつくよりも、リスク対リターンの観点でより良い機会をもたらすことが多いです。
このような相場では、次の利益の出る取引を見つけるのと同じくらい、資本を守ることが重要です。確認を待つトレーダーは、最初のブレイクアウトに反応するトレーダーよりも、結果的により良いエントリーを得ることが多いからです。
1つ目のシナリオは強気トラップです。価格が直近のローカル高値を一時的に上抜けし、ブレイクアウトの買い手を引きつける可能性があります。十分な流動性が集まると、売り手が強く介入し、急激な拒否(リジェクション)と深い押し目につながるかもしれません。
2つ目のシナリオは弱気トラップです。価格がまず短期のサポートを下抜け、ロングポジションのストップロスを誘発する可能性があります。買い手がすぐに売りの圧力を吸収すれば、その誤ったブレイクダウンが、より高いレジスタンス水準に向けた次の強い上昇の燃料になることもあります。
重要な教訓は、すべてのローソク足を当てようとしないことです。流動性が奪われた後の確認を待つことが大切です。大きな動きの前には、しばしば誤った動きが先行します。そして忍耐は、勢いを追って飛びつくよりも、リスク対リターンの観点でより良い機会をもたらすことが多いです。
このような相場では、次の利益の出る取引を見つけるのと同じくらい、資本を守ることが重要です。確認を待つトレーダーは、最初のブレイクアウトに反応するトレーダーよりも、結果的により良いエントリーを得ることが多いからです。
3
3
1.4k
·
--
弱気相場
最近の$DEXE 価格アクションは、市場が流動性と忍耐の両方によって動かされることを改めて思い出させる良い例でした。ローカルボトムから鋭く回復した後、多くのトレーダーは長期EMA99への即時の継続を期待していました。ところが、市場は鈍化し、出来高は薄れ、モメンタムは弱まり始めました。
現時点の構造は、強気のブレイクアウトの新規局面というよりは、健全なクールダウンにより近いように見えます。EMA7はEMA25を下回り、RSIは買われ過ぎの水準から戻り、MACDのモメンタムはフラット化しています。これらのシグナルは、買い手がより慎重になりつつあり、売り手が市場の強さを試していることを示唆しています。
最も重要な教訓は、次の動きはおそらく「希望」ではなく出来高によって決まるということです。強い買い圧力が戻れば、より高いレジスタンス水準へ向かうトレンドを再始動させる可能性があります。一方で出来高が弱い場合は、次のチャンスが現れる前に、より深い押し目につながるかもしれません。
トレーディングでは、次の方向を正確に予測することよりも、市場がどのように振る舞うかを理解することの方が重要です。モメンタム、流動性、そして主要な移動平均の周りでの反応を見ておくことは、次の足を当てようとするよりも、はるかに大きな優位性をもたらすことがよくあります。忍耐は依然として最も強力なトレーディング指標の一つです。
{spot}(DEXEUSDT)
最近の$DEXE 価格アクションは、市場が流動性と忍耐の両方によって動かされることを改めて思い出させる良い例でした。ローカルボトムから鋭く回復した後、多くのトレーダーは長期EMA99への即時の継続を期待していました。ところが、市場は鈍化し、出来高は薄れ、モメンタムは弱まり始めました。
現時点の構造は、強気のブレイクアウトの新規局面というよりは、健全なクールダウンにより近いように見えます。EMA7はEMA25を下回り、RSIは買われ過ぎの水準から戻り、MACDのモメンタムはフラット化しています。これらのシグナルは、買い手がより慎重になりつつあり、売り手が市場の強さを試していることを示唆しています。
最も重要な教訓は、次の動きはおそらく「希望」ではなく出来高によって決まるということです。強い買い圧力が戻れば、より高いレジスタンス水準へ向かうトレンドを再始動させる可能性があります。一方で出来高が弱い場合は、次のチャンスが現れる前に、より深い押し目につながるかもしれません。
トレーディングでは、次の方向を正確に予測することよりも、市場がどのように振る舞うかを理解することの方が重要です。モメンタム、流動性、そして主要な移動平均の周りでの反応を見ておくことは、次の足を当てようとするよりも、はるかに大きな優位性をもたらすことがよくあります。忍耐は依然として最も強力なトレーディング指標の一つです。
現時点の構造は、強気のブレイクアウトの新規局面というよりは、健全なクールダウンにより近いように見えます。EMA7はEMA25を下回り、RSIは買われ過ぎの水準から戻り、MACDのモメンタムはフラット化しています。これらのシグナルは、買い手がより慎重になりつつあり、売り手が市場の強さを試していることを示唆しています。
最も重要な教訓は、次の動きはおそらく「希望」ではなく出来高によって決まるということです。強い買い圧力が戻れば、より高いレジスタンス水準へ向かうトレンドを再始動させる可能性があります。一方で出来高が弱い場合は、次のチャンスが現れる前に、より深い押し目につながるかもしれません。
トレーディングでは、次の方向を正確に予測することよりも、市場がどのように振る舞うかを理解することの方が重要です。モメンタム、流動性、そして主要な移動平均の周りでの反応を見ておくことは、次の足を当てようとするよりも、はるかに大きな優位性をもたらすことがよくあります。忍耐は依然として最も強力なトレーディング指標の一つです。
251
ログインして、さらにコンテンツを読む
厳選トピックで世界の暗号資産トレーダーの仲間入り
⚡️ 暗号資産に関する最新かつ有益な情報が見つかります。
💬 世界最大の暗号資産取引所から信頼されています。
👍 認証を受けたクリエイターから、有益なインサイトを得られます。
メール / 電話番号
トレンドトピック
BitwiseFilesFinalNEARSpotETFProspectus
閲覧回数 33,561
933人が討論中
#bitwisefilesfinalnearspotetfprospectus 🚀
NEARトークンは$562.$NEAR に到達できますか?
ビットワイズは、NYSEアーカのティッカー「NRR」で上場する現物NEAR ETFを準備しています。マネージャーはすでに、$155、あるいは2030年までに$562といった目標について議論していました。$RESOLV $DASH
Rajo C
·いいね:6件
·閲覧回数 3.6k
BitgetHackerMoves$83MStolenXRP
閲覧回数 20,618
129人が討論中
SOLSpotETFWeeklyInflow$188M
閲覧回数 11,191
98人が討論中