

CryptoZeno 1
417 投稿

CryptoZeno 1
報告
ユーザーをブロック
Featured Creator on #CoinMarketCap #BinanceSquare and #CryptoQuant | On Chain Research and Market Insights
0 フォロー
8 フォロワー
19 いいね
投稿
·
--
翻訳参照
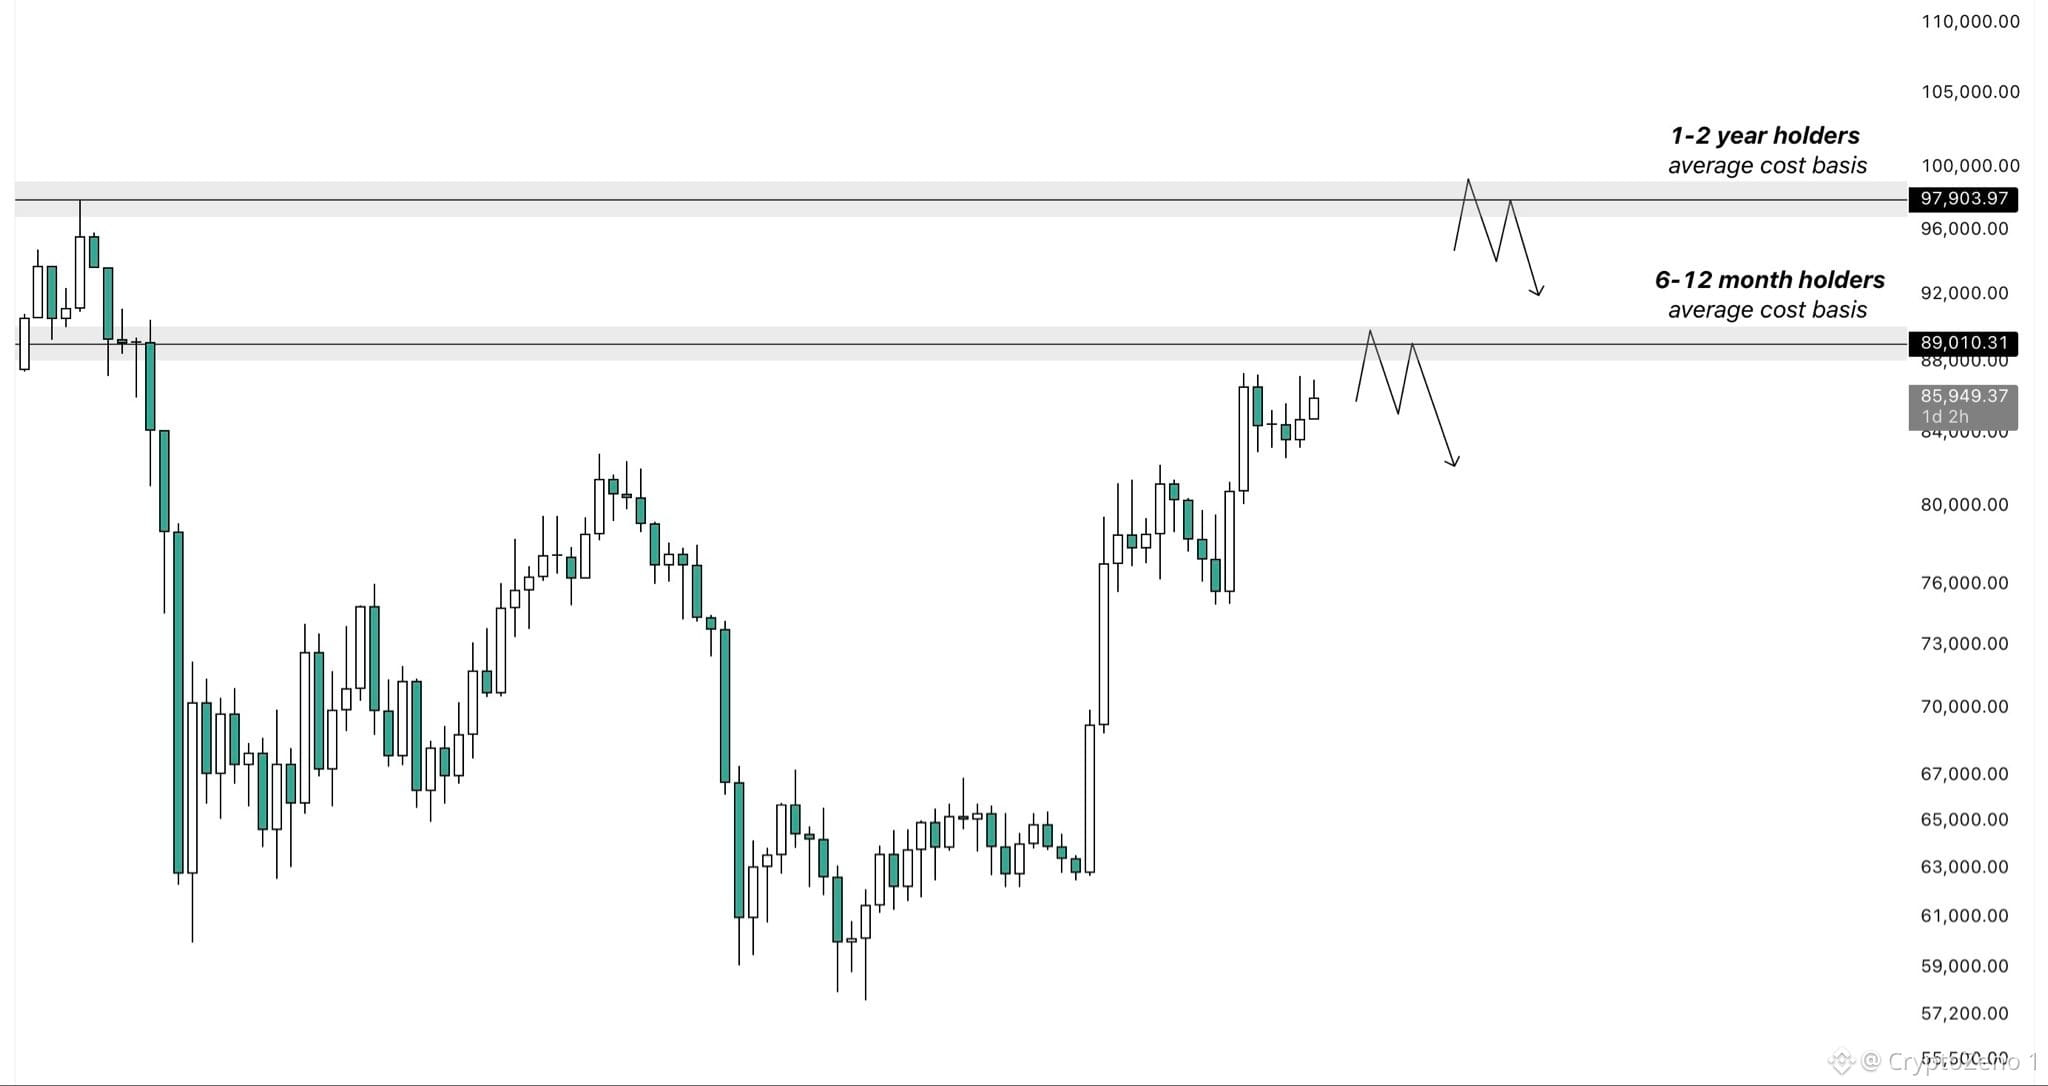
$BTC Even if price breaks above $87k, BTC might run into some additional selling pressure shortly after.
We currently have two important areas above price where large groups of holders would reach breakeven on their investments.
The closest one sits just above the recent highs around $89k, marking the average cost basis of holders who bought 6–12 months ago.
Further up around $97k, we have the breakeven level for the 1–2 year holders, which also lines up almost perfectly with the major swing high.
Holders who bought during the 2025 rally are already selling significantly more than those who accumulated during the decline.
That’s why both of these levels could become important as price approaches them, since holders who have been underwater for a longer period of time may use these opportunities to derisk or even exit their positions around breakeven. #BTC Price Analysis# #Macro Insights#
$BTC Even if price breaks above $87k, BTC might run into some additional selling pressure shortly after.
We currently have two important areas above price where large groups of holders would reach breakeven on their investments.
The closest one sits just above the recent highs around $89k, marking the average cost basis of holders who bought 6–12 months ago.
Further up around $97k, we have the breakeven level for the 1–2 year holders, which also lines up almost perfectly with the major swing high.
Holders who bought during the 2025 rally are already selling significantly more than those who accumulated during the decline.
That’s why both of these levels could become important as price approaches them, since holders who have been underwater for a longer period of time may use these opportunities to derisk or even exit their positions around breakeven. #BTC Price Analysis# #Macro Insights#
We currently have two important areas above price where large groups of holders would reach breakeven on their investments.
The closest one sits just above the recent highs around $89k, marking the average cost basis of holders who bought 6–12 months ago.
Further up around $97k, we have the breakeven level for the 1–2 year holders, which also lines up almost perfectly with the major swing high.
Holders who bought during the 2025 rally are already selling significantly more than those who accumulated during the decline.
That’s why both of these levels could become important as price approaches them, since holders who have been underwater for a longer period of time may use these opportunities to derisk or even exit their positions around breakeven. #BTC Price Analysis# #Macro Insights#
69
·
--
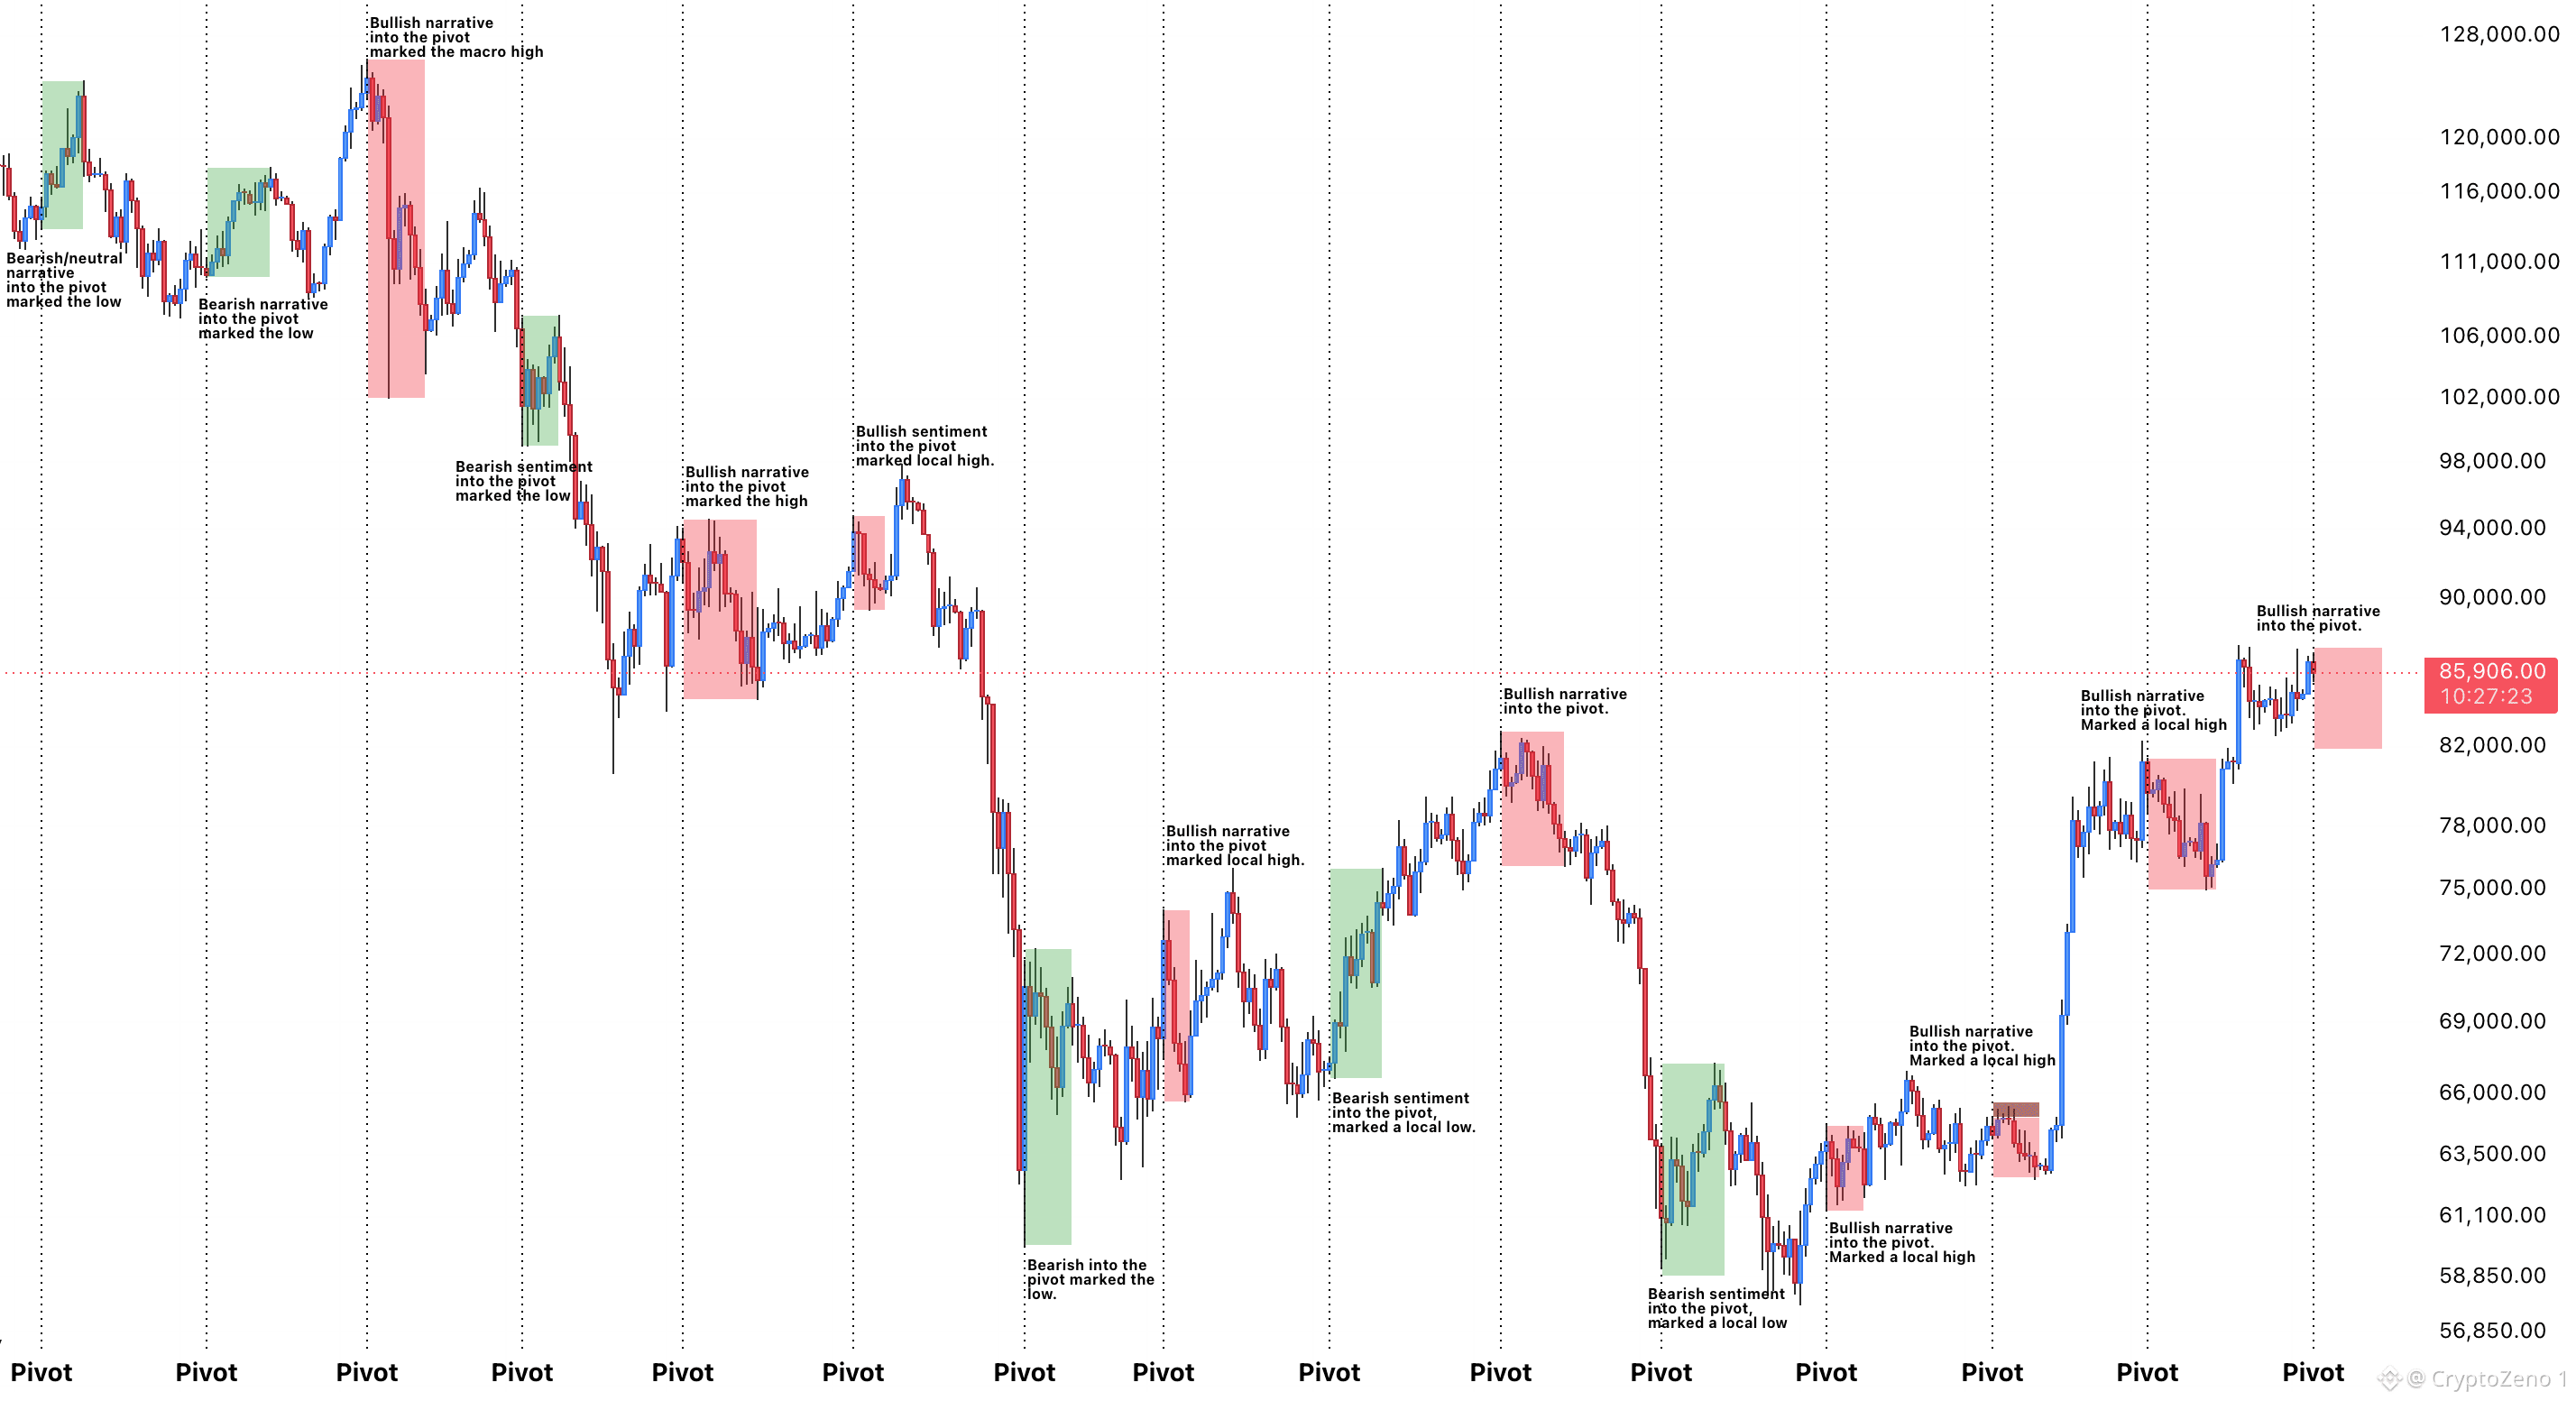
$BTC 自分のピボットに向けて、強気の見方が形成されつつある…
過去を振り返ると、4〜6回目のピボットに向けて強気ムードが高まると、いつも局所的な高値をつけてきました。
歴史が繰り返されるなら、10月中旬にかけてさらに下落する可能性があります。
そうなれば、押し目買いの絶好のチャンスになるかもしれません。🃏 #BTC価格分析# #マクロ分析#
$BTC 自分のピボットに向けて、強気の見方が形成されつつある…
過去を振り返ると、4〜6回目のピボットに向けて強気ムードが高まると、いつも局所的な高値をつけてきました。
歴史が繰り返されるなら、10月中旬にかけてさらに下落する可能性があります。
そうなれば、押し目買いの絶好のチャンスになるかもしれません。🃏 #BTC価格分析# #マクロ分析#
過去を振り返ると、4〜6回目のピボットに向けて強気ムードが高まると、いつも局所的な高値をつけてきました。
歴史が繰り返されるなら、10月中旬にかけてさらに下落する可能性があります。
そうなれば、押し目買いの絶好のチャンスになるかもしれません。🃏 #BTC価格分析# #マクロ分析#
56
·
--
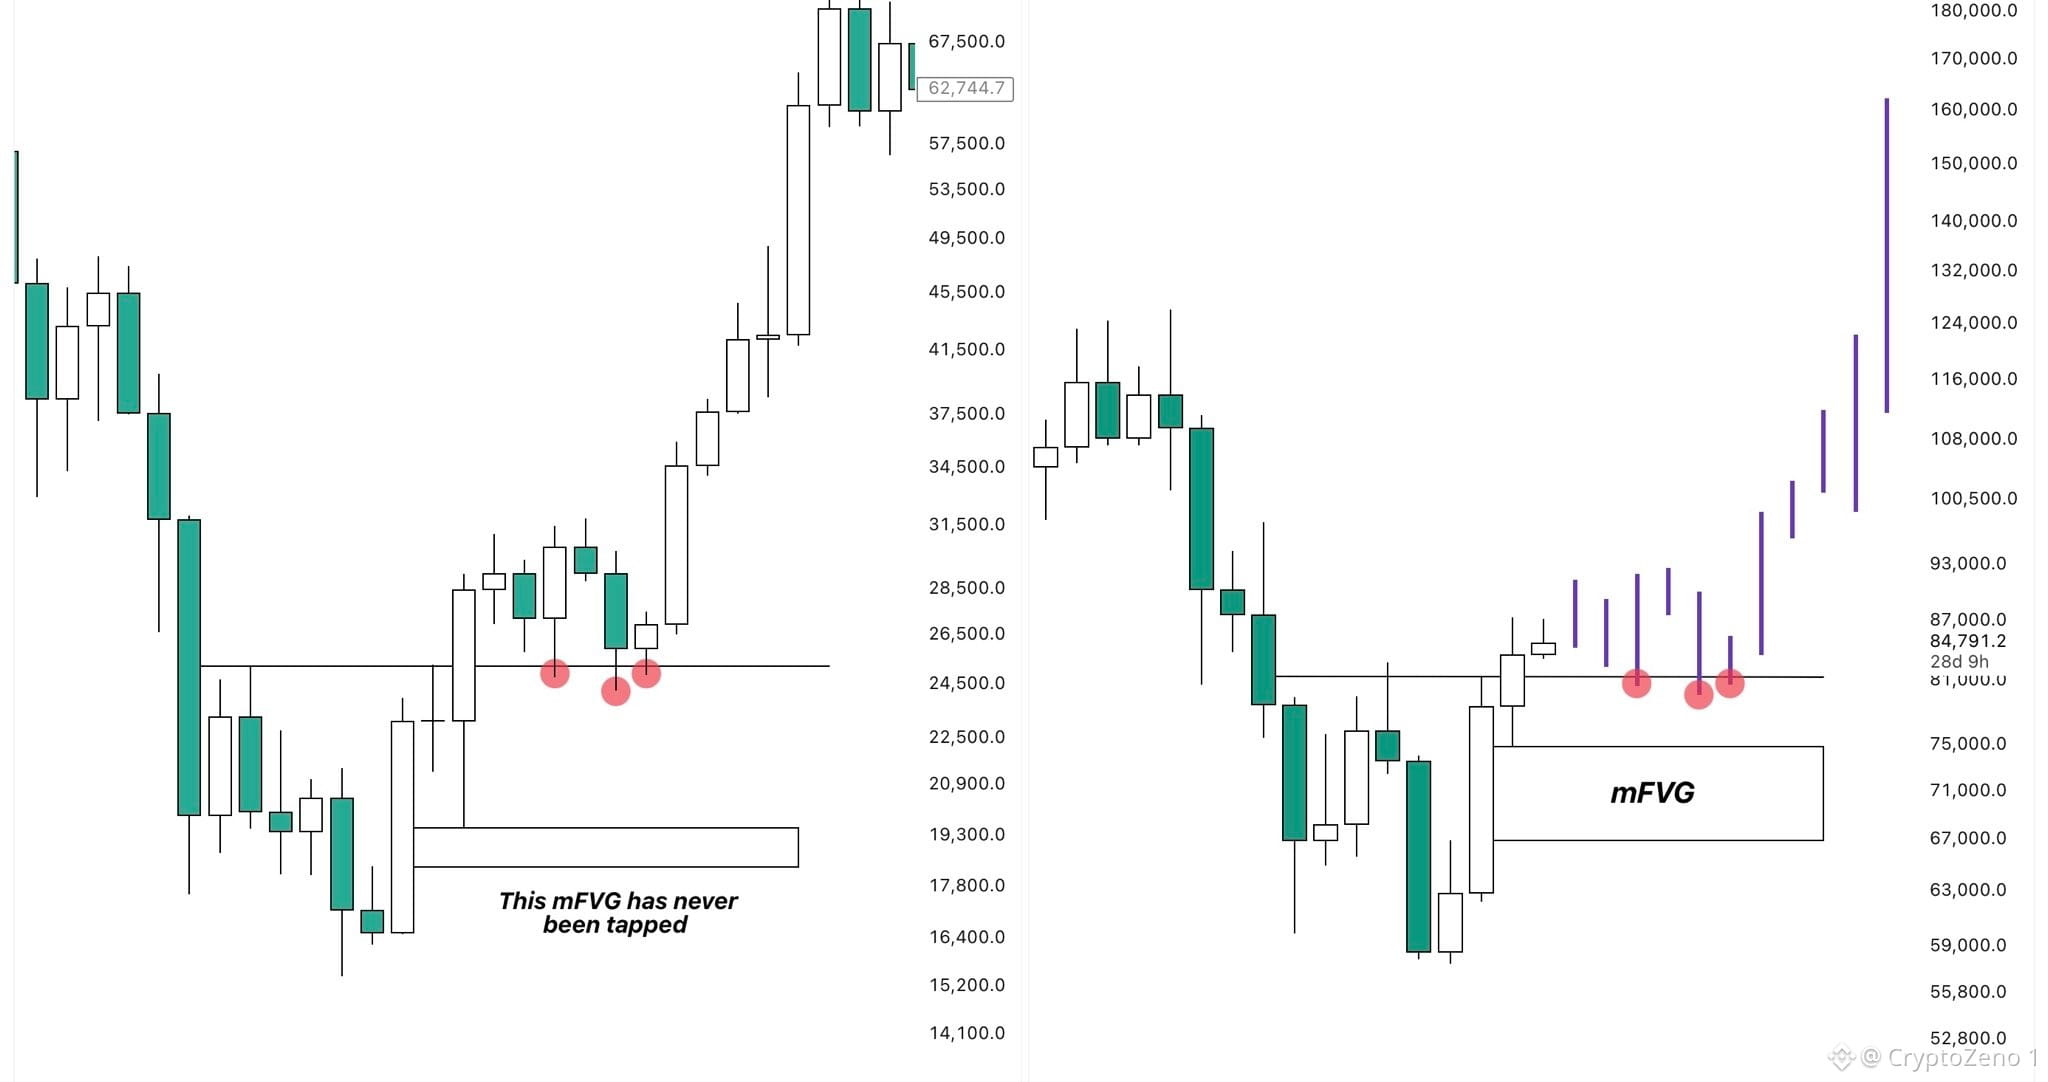
$BTC 次の大きな値動きで取り残されないために、ぜひ検討しておくべきシナリオがあります。
先ほど、2023年の底入れ構造と現在のものを比較したところ、とても興味深いことに気づきました。
現在、多くの人が月足のFVGについて話していて、次のより大きな上昇局面が始まる前に、価格はそこへ一度タップする可能性が高いと考えているようです。
それが私たちにとっては最良のシナリオになり得ること、つまり、絶対に完璧な追加の買い場を与えてくれることには同意しますが、必ずしも最も起こりやすい結果とは考えていません。
2023年の底入れプロセスでは、上方向への爆発的な動きも見られ、底入れレンジからブレイクしました。その際にも、(比較的)より小さめではあるものの、FVGが残されました。
ところが、そこを再度タップする代わりに、BTCは前のレンジの高値を再テストし、しばらくそこで推移した後、完全に勢いを取りました。
両方の構造が非常によく似ていることを考えると、このサイクルも同じような形で展開される可能性は十分あると思います。
だからこそ、現在のレンジの安値を下回るようなブレ(逸脱)は、私にとっては買いのチャンスです。これらの機会を使って次の上げ局面に向けてポジションをさらに構築しますし、もし実際にmFVGを再テストすることになれば、喜んでさらに多く買うチャンスとして受け取ります。#BTC Price Analysis# #Macro Insights# #Altcoin Season#
$BTC 次の大きな値動きで取り残されないために、ぜひ検討しておくべきシナリオがあります。
先ほど、2023年の底入れ構造と現在のものを比較したところ、とても興味深いことに気づきました。
現在、多くの人が月足のFVGについて話していて、次のより大きな上昇局面が始まる前に、価格はそこへ一度タップする可能性が高いと考えているようです。
それが私たちにとっては最良のシナリオになり得ること、つまり、絶対に完璧な追加の買い場を与えてくれることには同意しますが、必ずしも最も起こりやすい結果とは考えていません。
2023年の底入れプロセスでは、上方向への爆発的な動きも見られ、底入れレンジからブレイクしました。その際にも、(比較的)より小さめではあるものの、FVGが残されました。
ところが、そこを再度タップする代わりに、BTCは前のレンジの高値を再テストし、しばらくそこで推移した後、完全に勢いを取りました。
両方の構造が非常によく似ていることを考えると、このサイクルも同じような形で展開される可能性は十分あると思います。
だからこそ、現在のレンジの安値を下回るようなブレ(逸脱)は、私にとっては買いのチャンスです。これらの機会を使って次の上げ局面に向けてポジションをさらに構築しますし、もし実際にmFVGを再テストすることになれば、喜んでさらに多く買うチャンスとして受け取ります。#BTC Price Analysis# #Macro Insights# #Altcoin Season#
先ほど、2023年の底入れ構造と現在のものを比較したところ、とても興味深いことに気づきました。
現在、多くの人が月足のFVGについて話していて、次のより大きな上昇局面が始まる前に、価格はそこへ一度タップする可能性が高いと考えているようです。
それが私たちにとっては最良のシナリオになり得ること、つまり、絶対に完璧な追加の買い場を与えてくれることには同意しますが、必ずしも最も起こりやすい結果とは考えていません。
2023年の底入れプロセスでは、上方向への爆発的な動きも見られ、底入れレンジからブレイクしました。その際にも、(比較的)より小さめではあるものの、FVGが残されました。
ところが、そこを再度タップする代わりに、BTCは前のレンジの高値を再テストし、しばらくそこで推移した後、完全に勢いを取りました。
両方の構造が非常によく似ていることを考えると、このサイクルも同じような形で展開される可能性は十分あると思います。
だからこそ、現在のレンジの安値を下回るようなブレ(逸脱)は、私にとっては買いのチャンスです。これらの機会を使って次の上げ局面に向けてポジションをさらに構築しますし、もし実際にmFVGを再テストすることになれば、喜んでさらに多く買うチャンスとして受け取ります。#BTC Price Analysis# #Macro Insights# #Altcoin Season#
73
·
--
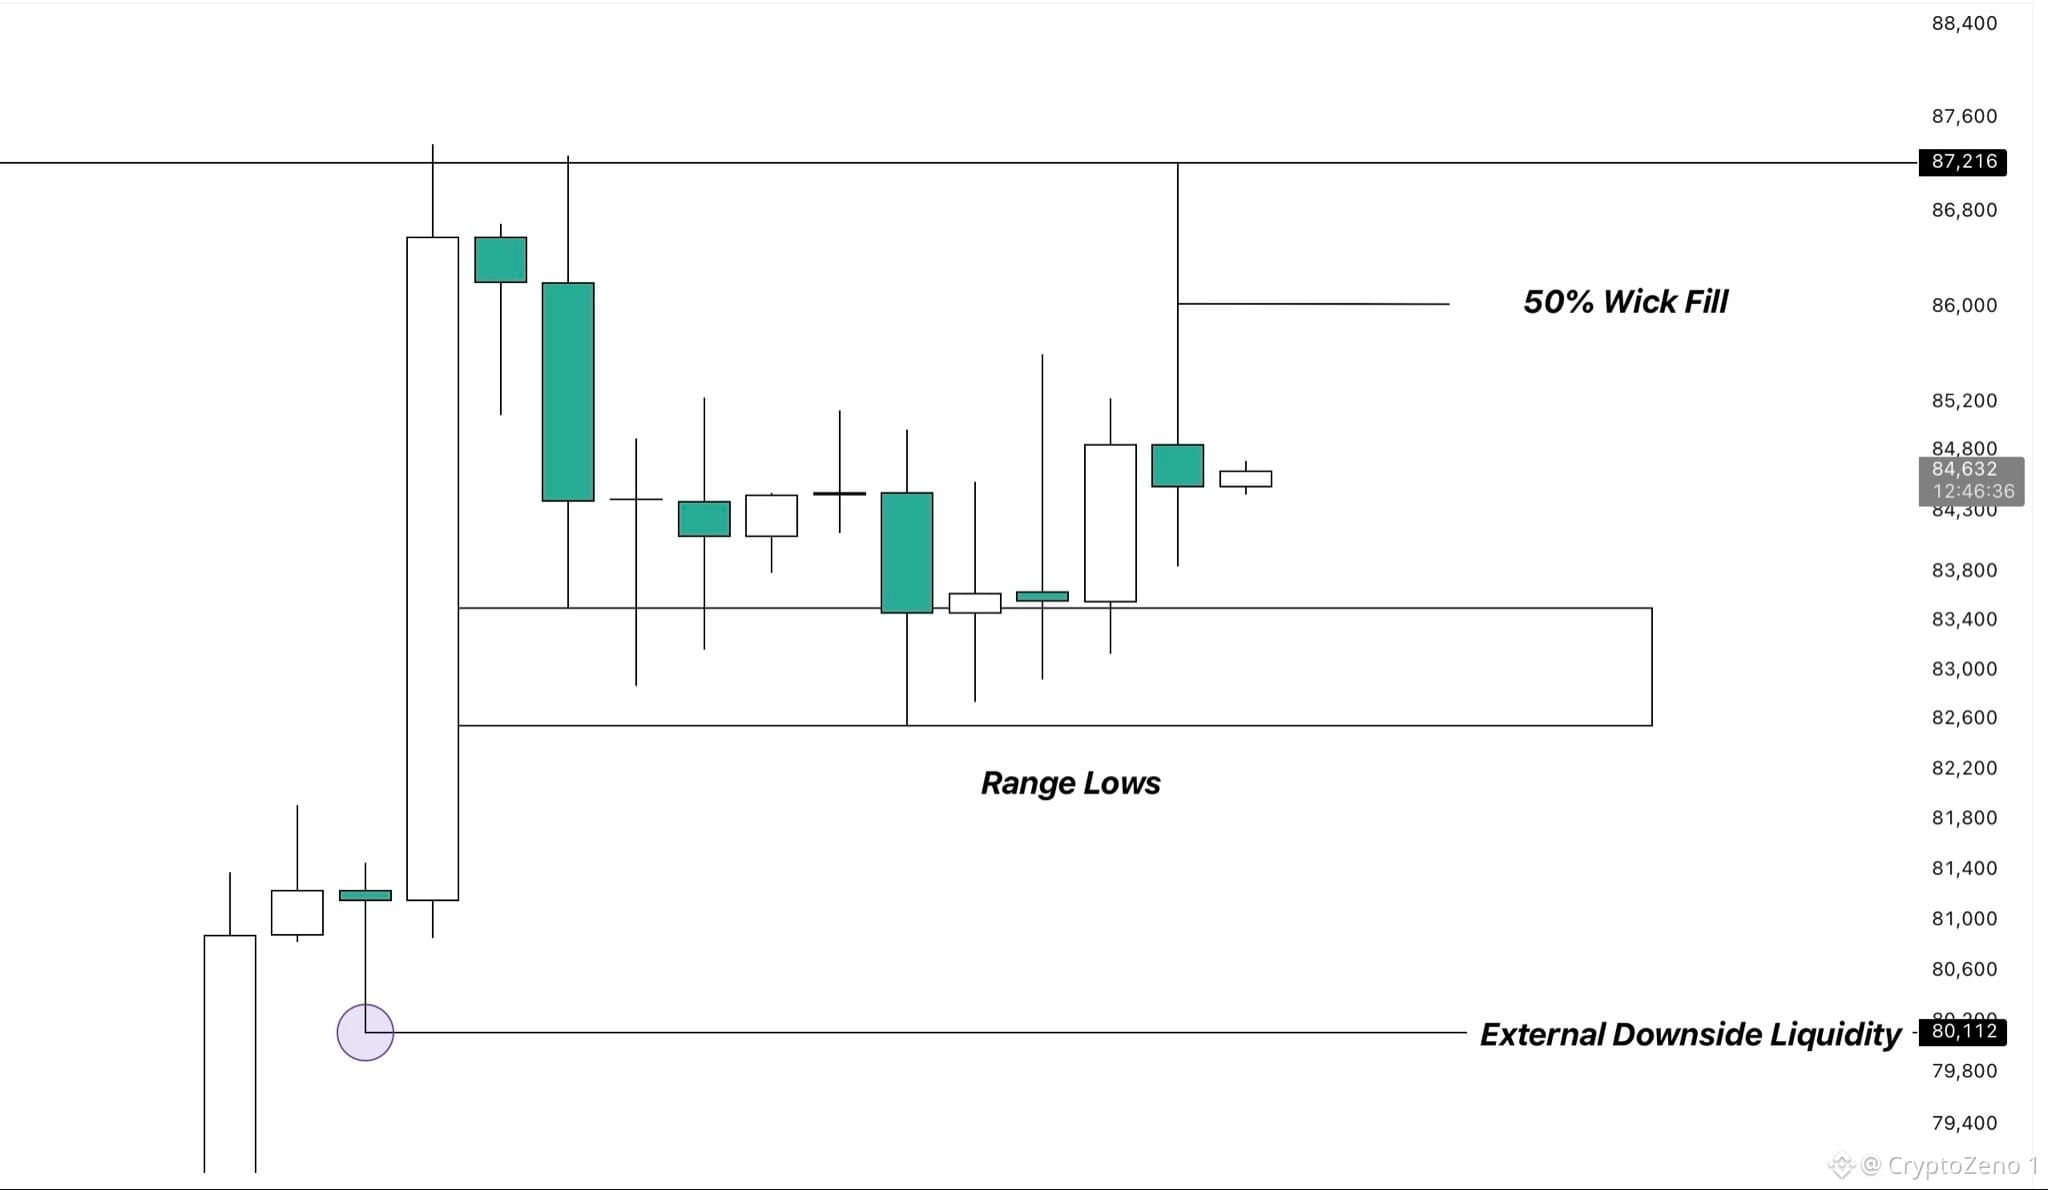
$BTC 昨日のデイリー足は、上方向にかなり大きなヒゲを残しました。
このようなヒゲが出るときは多くの場合、少なくとも50%が埋められる傾向があります。こうした急激な値動きは大量の流動性を残し、その後価格が戻ってきてスイープすることが多いためです。
したがって、価格がレンジ上限をもう一度リテストしてから、レンジ下限に向けて下方向に続く可能性が高いと思います。
そこでは、これらの安値を一時的にわずかに下抜けたあと、すぐに買い戻して回復し、その後価格が
より大きな上昇トレンドを継続する流れが見られるかもしれません。
ただし私は、まずはもう少しの間レンジが続き、その前に両側でより多くの流動性を作りにいく可能性のほうが高いと考えています。
結局のところ、価格はおよそ2週間の間ずっと$83kから$87kの間で推移しているだけで、こうしたレンジは最終的に確定したブレイクアウトが出るまで、数週間続くことも十分にあります。 #BTC Price Analysis# #Macro Insights#
$BTC 昨日のデイリー足は、上方向にかなり大きなヒゲを残しました。
このようなヒゲが出るときは多くの場合、少なくとも50%が埋められる傾向があります。こうした急激な値動きは大量の流動性を残し、その後価格が戻ってきてスイープすることが多いためです。
したがって、価格がレンジ上限をもう一度リテストしてから、レンジ下限に向けて下方向に続く可能性が高いと思います。
そこでは、これらの安値を一時的にわずかに下抜けたあと、すぐに買い戻して回復し、その後価格が
より大きな上昇トレンドを継続する流れが見られるかもしれません。
ただし私は、まずはもう少しの間レンジが続き、その前に両側でより多くの流動性を作りにいく可能性のほうが高いと考えています。
結局のところ、価格はおよそ2週間の間ずっと$83kから$87kの間で推移しているだけで、こうしたレンジは最終的に確定したブレイクアウトが出るまで、数週間続くことも十分にあります。 #BTC Price Analysis# #Macro Insights#
このようなヒゲが出るときは多くの場合、少なくとも50%が埋められる傾向があります。こうした急激な値動きは大量の流動性を残し、その後価格が戻ってきてスイープすることが多いためです。
したがって、価格がレンジ上限をもう一度リテストしてから、レンジ下限に向けて下方向に続く可能性が高いと思います。
そこでは、これらの安値を一時的にわずかに下抜けたあと、すぐに買い戻して回復し、その後価格が
より大きな上昇トレンドを継続する流れが見られるかもしれません。
ただし私は、まずはもう少しの間レンジが続き、その前に両側でより多くの流動性を作りにいく可能性のほうが高いと考えています。
結局のところ、価格はおよそ2週間の間ずっと$83kから$87kの間で推移しているだけで、こうしたレンジは最終的に確定したブレイクアウトが出るまで、数週間続くことも十分にあります。 #BTC Price Analysis# #Macro Insights#
70
·
--
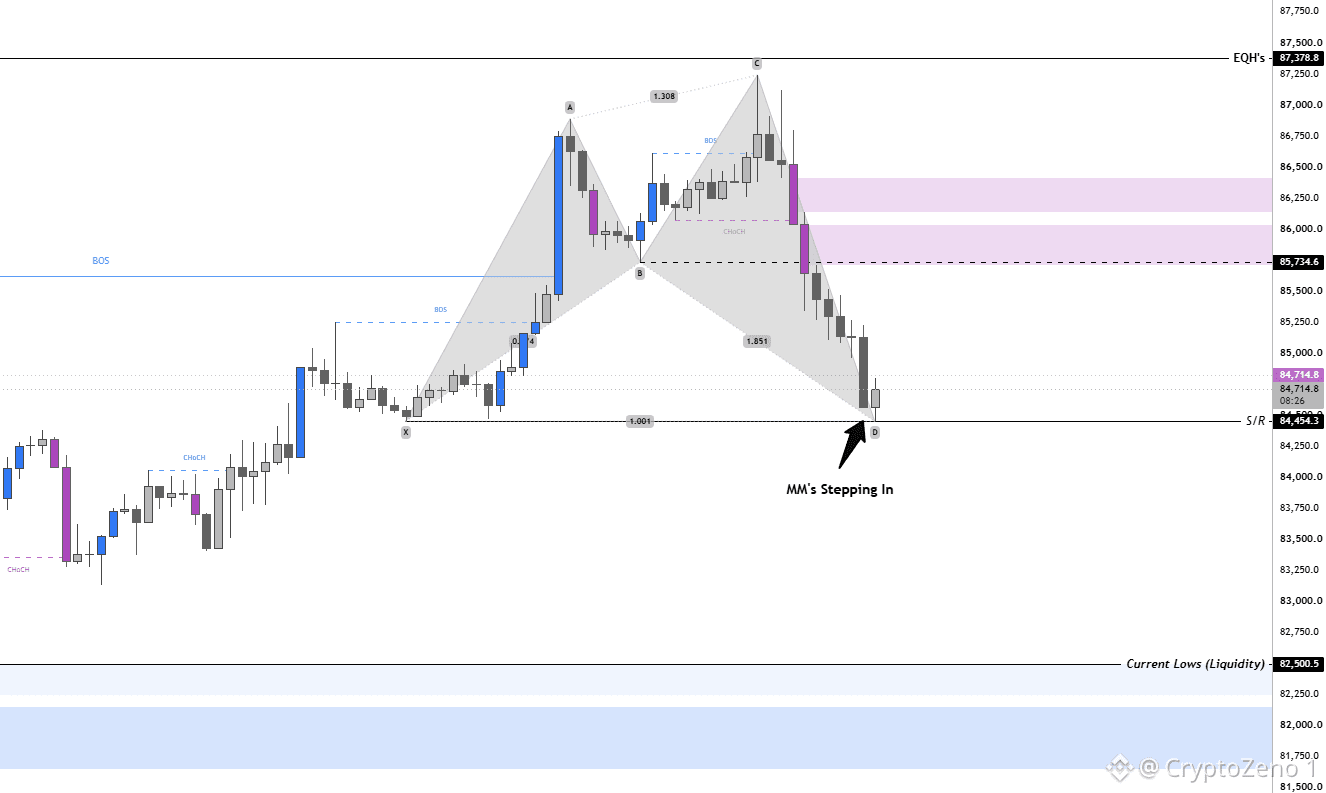
$BTC 私たちは87.3kでEQHを先回りしてから、30Mで連続9本の弱気足を見ました。
これは、MM(マーケットメイカー)が主導権を握って高値を先回りし、このポンプに先行して飛びついた遅れてのロング勢を刈り取るために動いたということを示しています。
そしてこの下落が「シェイクアウト(巻き込み)」とされる理由は、下落の間ずっと強気の値動きがなかったからです。
強気側に主導権を握るチャンスすら与えず、ただまっすぐ3%下落しただけ。
明らかに、今回の下落ではショートが狙われていないため、流動性/イアンバランスは上方向に積み上がっていません。
さて、直近の30M足は「削られた底(shaved bottom)」の形でクローズし、スマートマネーが再びエントリーしたことを表しています。だからこそ、現在の足はグリーンでクローズしつつあります。
MMは、この下落の間に上方向へより多くの流動性を製造したので、ここから価格を押し上げてくるはずです。
もし84.4kを維持できるなら、85.7kのリテストが起きる可能性が高いです。
85.7kを奪還できれば、この流動性が彼らの助けとなり、未回収(まだ刈られていない)EQHへ向けて価格を押し戻すことにつながります。
MMはただ流動性を狩るだけじゃない。彼らはそれも製造するんです。 #BTC Price Analysis# #Macro Insights#
$BTC 私たちは87.3kでEQHを先回りしてから、30Mで連続9本の弱気足を見ました。
これは、MM(マーケットメイカー)が主導権を握って高値を先回りし、このポンプに先行して飛びついた遅れてのロング勢を刈り取るために動いたということを示しています。
そしてこの下落が「シェイクアウト(巻き込み)」とされる理由は、下落の間ずっと強気の値動きがなかったからです。
強気側に主導権を握るチャンスすら与えず、ただまっすぐ3%下落しただけ。
明らかに、今回の下落ではショートが狙われていないため、流動性/イアンバランスは上方向に積み上がっていません。
さて、直近の30M足は「削られた底(shaved bottom)」の形でクローズし、スマートマネーが再びエントリーしたことを表しています。だからこそ、現在の足はグリーンでクローズしつつあります。
MMは、この下落の間に上方向へより多くの流動性を製造したので、ここから価格を押し上げてくるはずです。
もし84.4kを維持できるなら、85.7kのリテストが起きる可能性が高いです。
85.7kを奪還できれば、この流動性が彼らの助けとなり、未回収(まだ刈られていない)EQHへ向けて価格を押し戻すことにつながります。
MMはただ流動性を狩るだけじゃない。彼らはそれも製造するんです。 #BTC Price Analysis# #Macro Insights#
これは、MM(マーケットメイカー)が主導権を握って高値を先回りし、このポンプに先行して飛びついた遅れてのロング勢を刈り取るために動いたということを示しています。
そしてこの下落が「シェイクアウト(巻き込み)」とされる理由は、下落の間ずっと強気の値動きがなかったからです。
強気側に主導権を握るチャンスすら与えず、ただまっすぐ3%下落しただけ。
明らかに、今回の下落ではショートが狙われていないため、流動性/イアンバランスは上方向に積み上がっていません。
さて、直近の30M足は「削られた底(shaved bottom)」の形でクローズし、スマートマネーが再びエントリーしたことを表しています。だからこそ、現在の足はグリーンでクローズしつつあります。
MMは、この下落の間に上方向へより多くの流動性を製造したので、ここから価格を押し上げてくるはずです。
もし84.4kを維持できるなら、85.7kのリテストが起きる可能性が高いです。
85.7kを奪還できれば、この流動性が彼らの助けとなり、未回収(まだ刈られていない)EQHへ向けて価格を押し戻すことにつながります。
MMはただ流動性を狩るだけじゃない。彼らはそれも製造するんです。 #BTC Price Analysis# #Macro Insights#
40
·
--
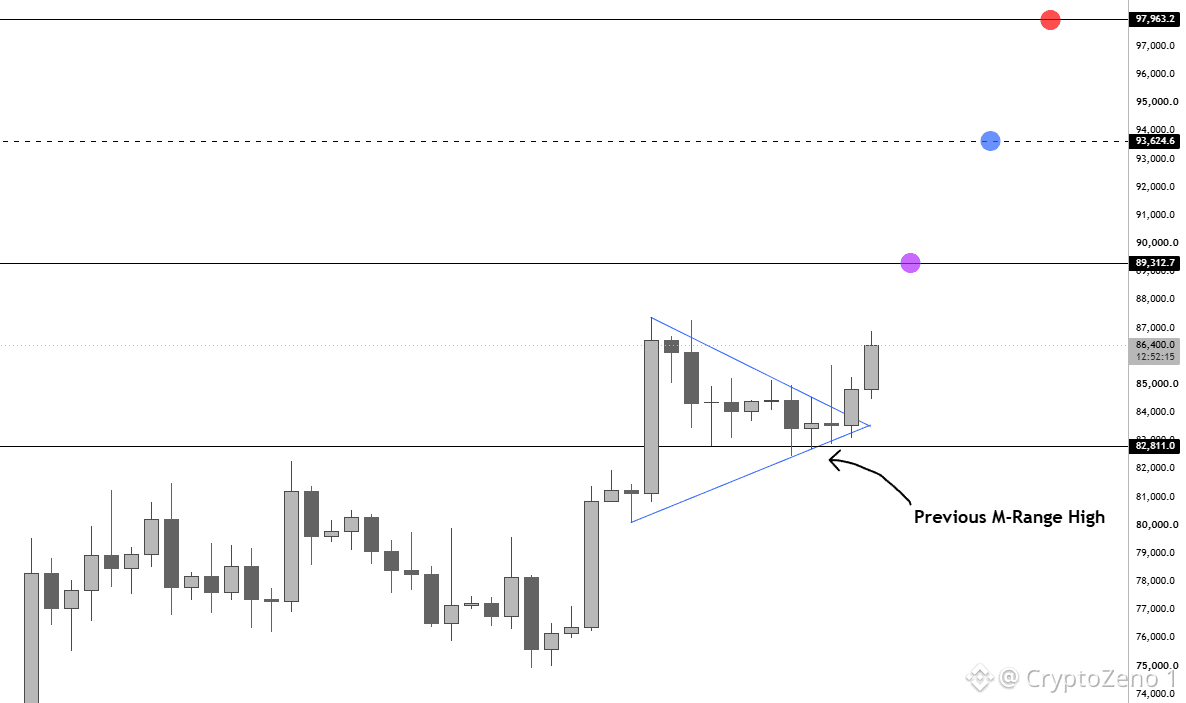
$BTC ペナントブレイクアウト + 先行するM-ハイからの跳ね返り。
新しい月が始まったばかりなのに、月初からすでに上方向へ押し上げられています。
さて、通常は新しい月が始まった直後の最初の動きは、流動性を作って個人投資家をトラップするための“フェイク”で、その後に反転します。
もしここでも同じなら、現在のローカル高値域(87.5K〜89.3K)をスイープした後に、そこで拒否反応(リジェクション)が見られるはずです。
そこでの拒否反応が、いまのレンジの安値を抜きにいくために一度下方向へ押し戻す動きを裏付け、その後に再び上方向へ向かうことになるでしょう。
ただし、ペナントからのブレイクアウトも起きているので、93.6Kのあたりまでを見込む“全体の測定幅ブレイク”の動きが、その後の反転として展開される可能性もあります。
トレンドは強気(ブル)であり、ピコ天(小さな天井)をショートして小さな押し目を拾おうとするより、押し目ごとにロングするほうがはるかに利益を出しやすいです。
現在の見立てでは、今後2週間以内に93.6K〜97.9Kのゾーンへ押して、その後は長めのレンジに入る可能性が高く、それは来年へも延びるかもしれません。その上で、次の上昇局面へ進むと見ています。
ショートには少し慎重になりますが、90K台へ到達したら、ヘッジ目的のショートを開く方向に傾き、ロングの利益を確保したうえで、その後の押し目で再びロングを入れ直します。 #BTC Price Analysis# #Macro Insights#
$BTC ペナントブレイクアウト + 先行するM-ハイからの跳ね返り。
新しい月が始まったばかりなのに、月初からすでに上方向へ押し上げられています。
さて、通常は新しい月が始まった直後の最初の動きは、流動性を作って個人投資家をトラップするための“フェイク”で、その後に反転します。
もしここでも同じなら、現在のローカル高値域(87.5K〜89.3K)をスイープした後に、そこで拒否反応(リジェクション)が見られるはずです。
そこでの拒否反応が、いまのレンジの安値を抜きにいくために一度下方向へ押し戻す動きを裏付け、その後に再び上方向へ向かうことになるでしょう。
ただし、ペナントからのブレイクアウトも起きているので、93.6Kのあたりまでを見込む“全体の測定幅ブレイク”の動きが、その後の反転として展開される可能性もあります。
トレンドは強気(ブル)であり、ピコ天(小さな天井)をショートして小さな押し目を拾おうとするより、押し目ごとにロングするほうがはるかに利益を出しやすいです。
現在の見立てでは、今後2週間以内に93.6K〜97.9Kのゾーンへ押して、その後は長めのレンジに入る可能性が高く、それは来年へも延びるかもしれません。その上で、次の上昇局面へ進むと見ています。
ショートには少し慎重になりますが、90K台へ到達したら、ヘッジ目的のショートを開く方向に傾き、ロングの利益を確保したうえで、その後の押し目で再びロングを入れ直します。 #BTC Price Analysis# #Macro Insights#
新しい月が始まったばかりなのに、月初からすでに上方向へ押し上げられています。
さて、通常は新しい月が始まった直後の最初の動きは、流動性を作って個人投資家をトラップするための“フェイク”で、その後に反転します。
もしここでも同じなら、現在のローカル高値域(87.5K〜89.3K)をスイープした後に、そこで拒否反応(リジェクション)が見られるはずです。
そこでの拒否反応が、いまのレンジの安値を抜きにいくために一度下方向へ押し戻す動きを裏付け、その後に再び上方向へ向かうことになるでしょう。
ただし、ペナントからのブレイクアウトも起きているので、93.6Kのあたりまでを見込む“全体の測定幅ブレイク”の動きが、その後の反転として展開される可能性もあります。
トレンドは強気(ブル)であり、ピコ天(小さな天井)をショートして小さな押し目を拾おうとするより、押し目ごとにロングするほうがはるかに利益を出しやすいです。
現在の見立てでは、今後2週間以内に93.6K〜97.9Kのゾーンへ押して、その後は長めのレンジに入る可能性が高く、それは来年へも延びるかもしれません。その上で、次の上昇局面へ進むと見ています。
ショートには少し慎重になりますが、90K台へ到達したら、ヘッジ目的のショートを開く方向に傾き、ロングの利益を確保したうえで、その後の押し目で再びロングを入れ直します。 #BTC Price Analysis# #Macro Insights#
56
·
--
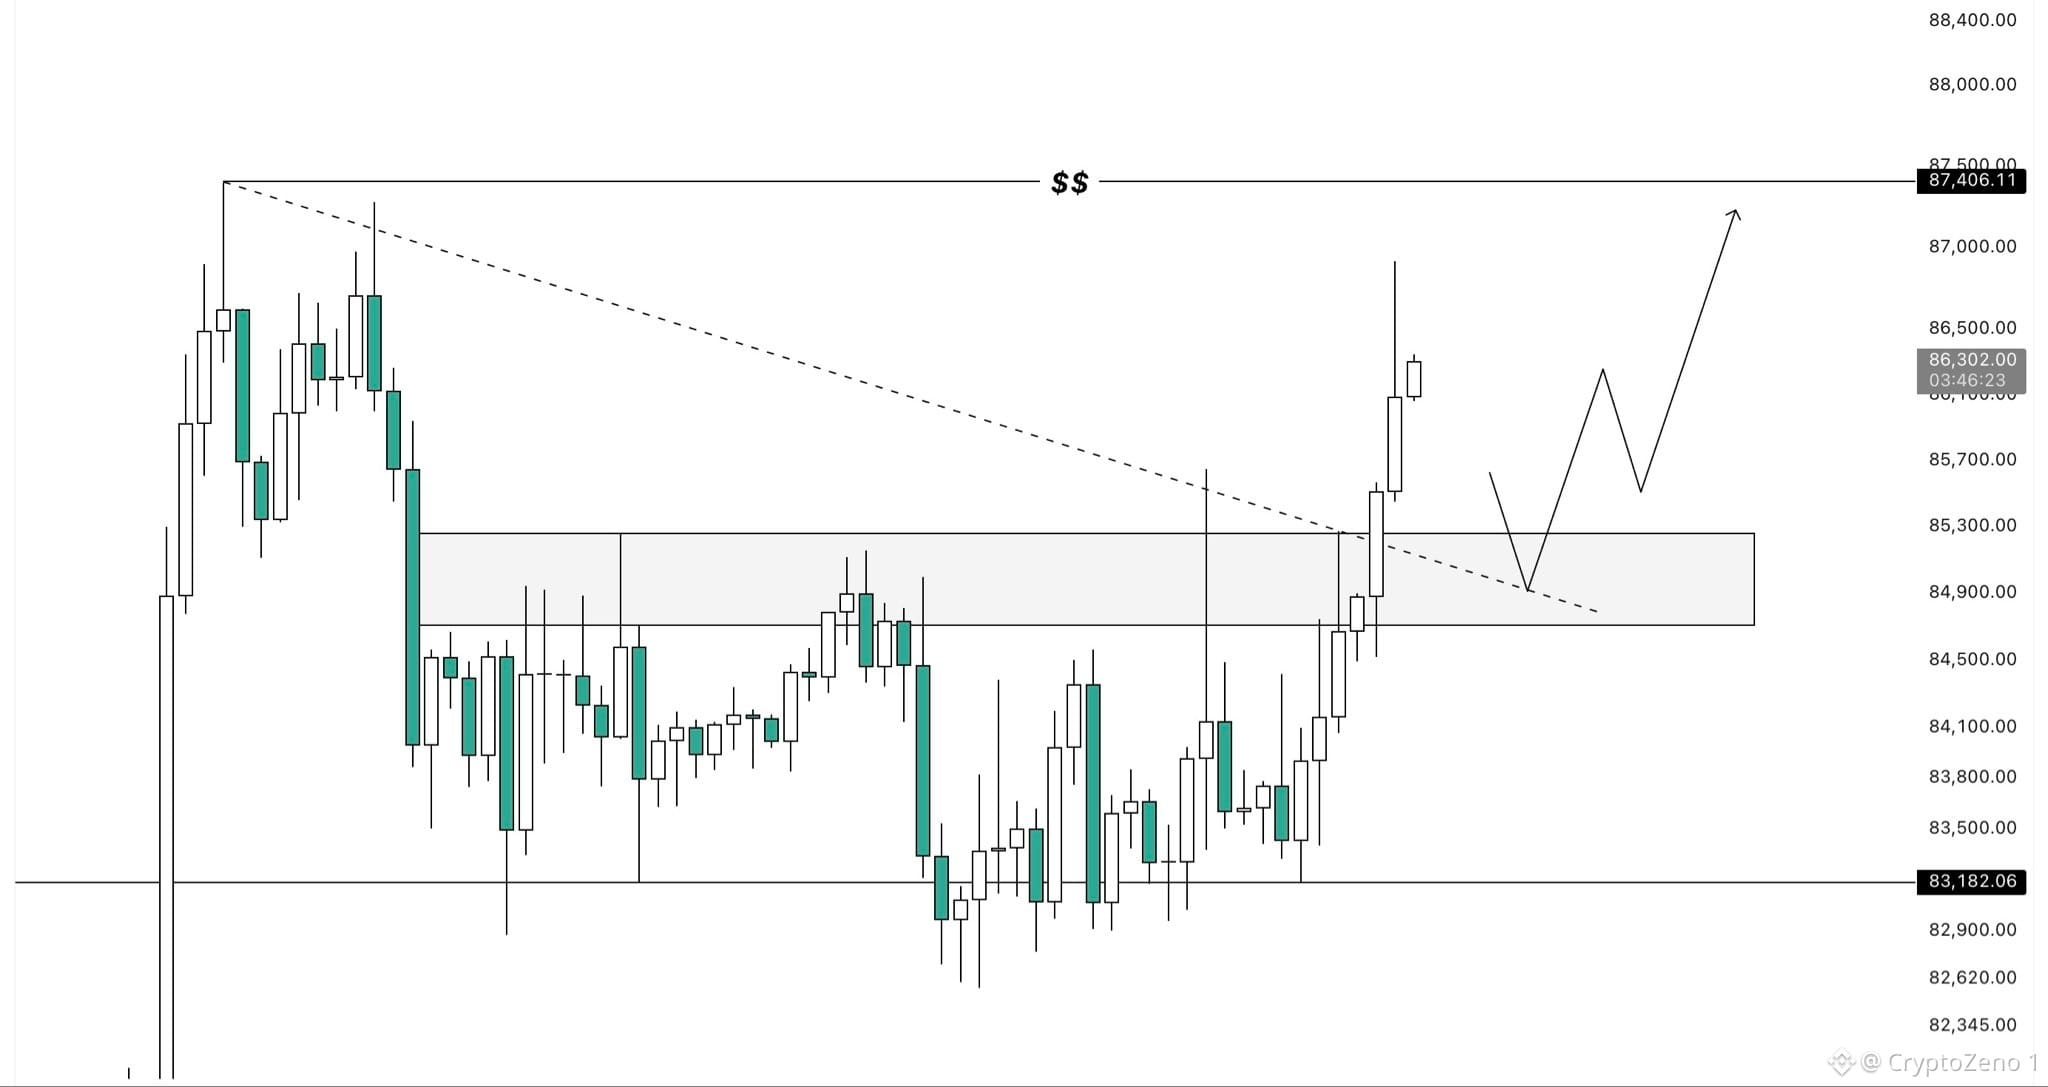
$BTC すみません。BTCがまだレンジ内で推移しており、価格がレンジ上限と下降トレンドラインの両方に接近している状況を考えると、もう一度リジェクションが起きると予想していました。
しかし、価格は勢いよくそのゾーンを突破し、$86.9k まで一気に上昇しました。
その動きがあったにもかかわらず、$87.3k 前後の高値はまだ刈り取られておらず、上側にある流動性のクラスターもまだタップされていません。
ここから考えられるシナリオは2つです。BTCがその高値を直接スイープするためにさらに上昇していくか、まずレンジ上限のリテストが入り、その後にもう一段上昇するかです。
どちらにしても、私はこれらの高値が近いうちに確実に取られると引き続き見ています。 #BTC Price Analysis# #Macro Insights#
$BTC すみません。BTCがまだレンジ内で推移しており、価格がレンジ上限と下降トレンドラインの両方に接近している状況を考えると、もう一度リジェクションが起きると予想していました。
しかし、価格は勢いよくそのゾーンを突破し、$86.9k まで一気に上昇しました。
その動きがあったにもかかわらず、$87.3k 前後の高値はまだ刈り取られておらず、上側にある流動性のクラスターもまだタップされていません。
ここから考えられるシナリオは2つです。BTCがその高値を直接スイープするためにさらに上昇していくか、まずレンジ上限のリテストが入り、その後にもう一段上昇するかです。
どちらにしても、私はこれらの高値が近いうちに確実に取られると引き続き見ています。 #BTC Price Analysis# #Macro Insights#
しかし、価格は勢いよくそのゾーンを突破し、$86.9k まで一気に上昇しました。
その動きがあったにもかかわらず、$87.3k 前後の高値はまだ刈り取られておらず、上側にある流動性のクラスターもまだタップされていません。
ここから考えられるシナリオは2つです。BTCがその高値を直接スイープするためにさらに上昇していくか、まずレンジ上限のリテストが入り、その後にもう一段上昇するかです。
どちらにしても、私はこれらの高値が近いうちに確実に取られると引き続き見ています。 #BTC Price Analysis# #Macro Insights#
68
·
--
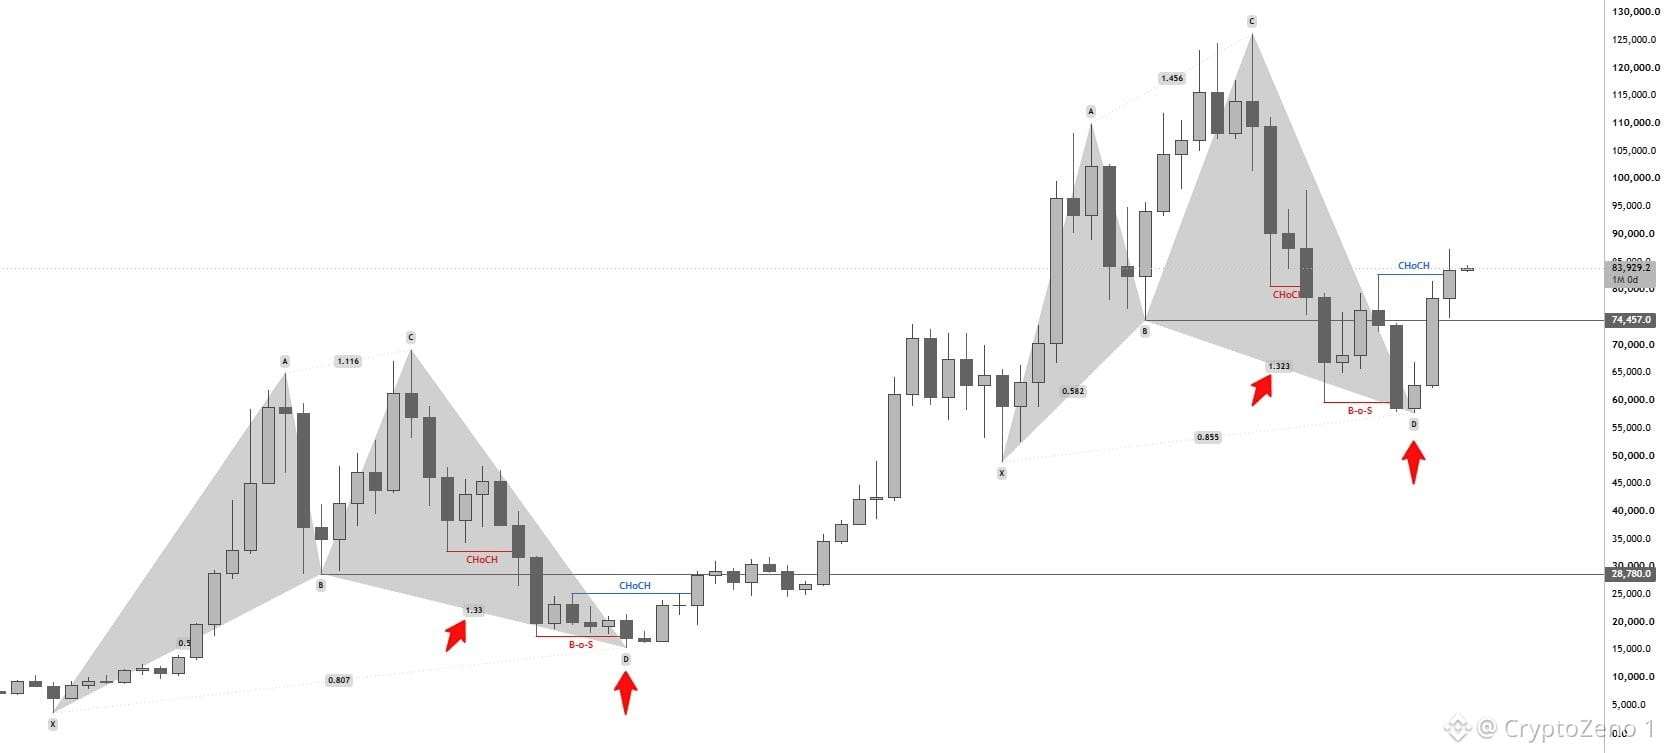
$BTC もう時間の問題でした…
月次CHoCHがINで、トレンドは月次の時間枠で公式に強気です。
起こる前にそれを言い当てていました。
いま乗る時です。#BTC 価格分析# #マクロ洞察#
$BTC もう時間の問題でした…
月次CHoCHがINで、トレンドは月次の時間枠で公式に強気です。
起こる前にそれを言い当てていました。
いま乗る時です。#BTC 価格分析# #マクロ洞察#
月次CHoCHがINで、トレンドは月次の時間枠で公式に強気です。
起こる前にそれを言い当てていました。
いま乗る時です。#BTC 価格分析# #マクロ洞察#
74
·
--
ビットコインは勢いを取り戻しつつあり、長期保有者が供給を引き締めている
$BTC
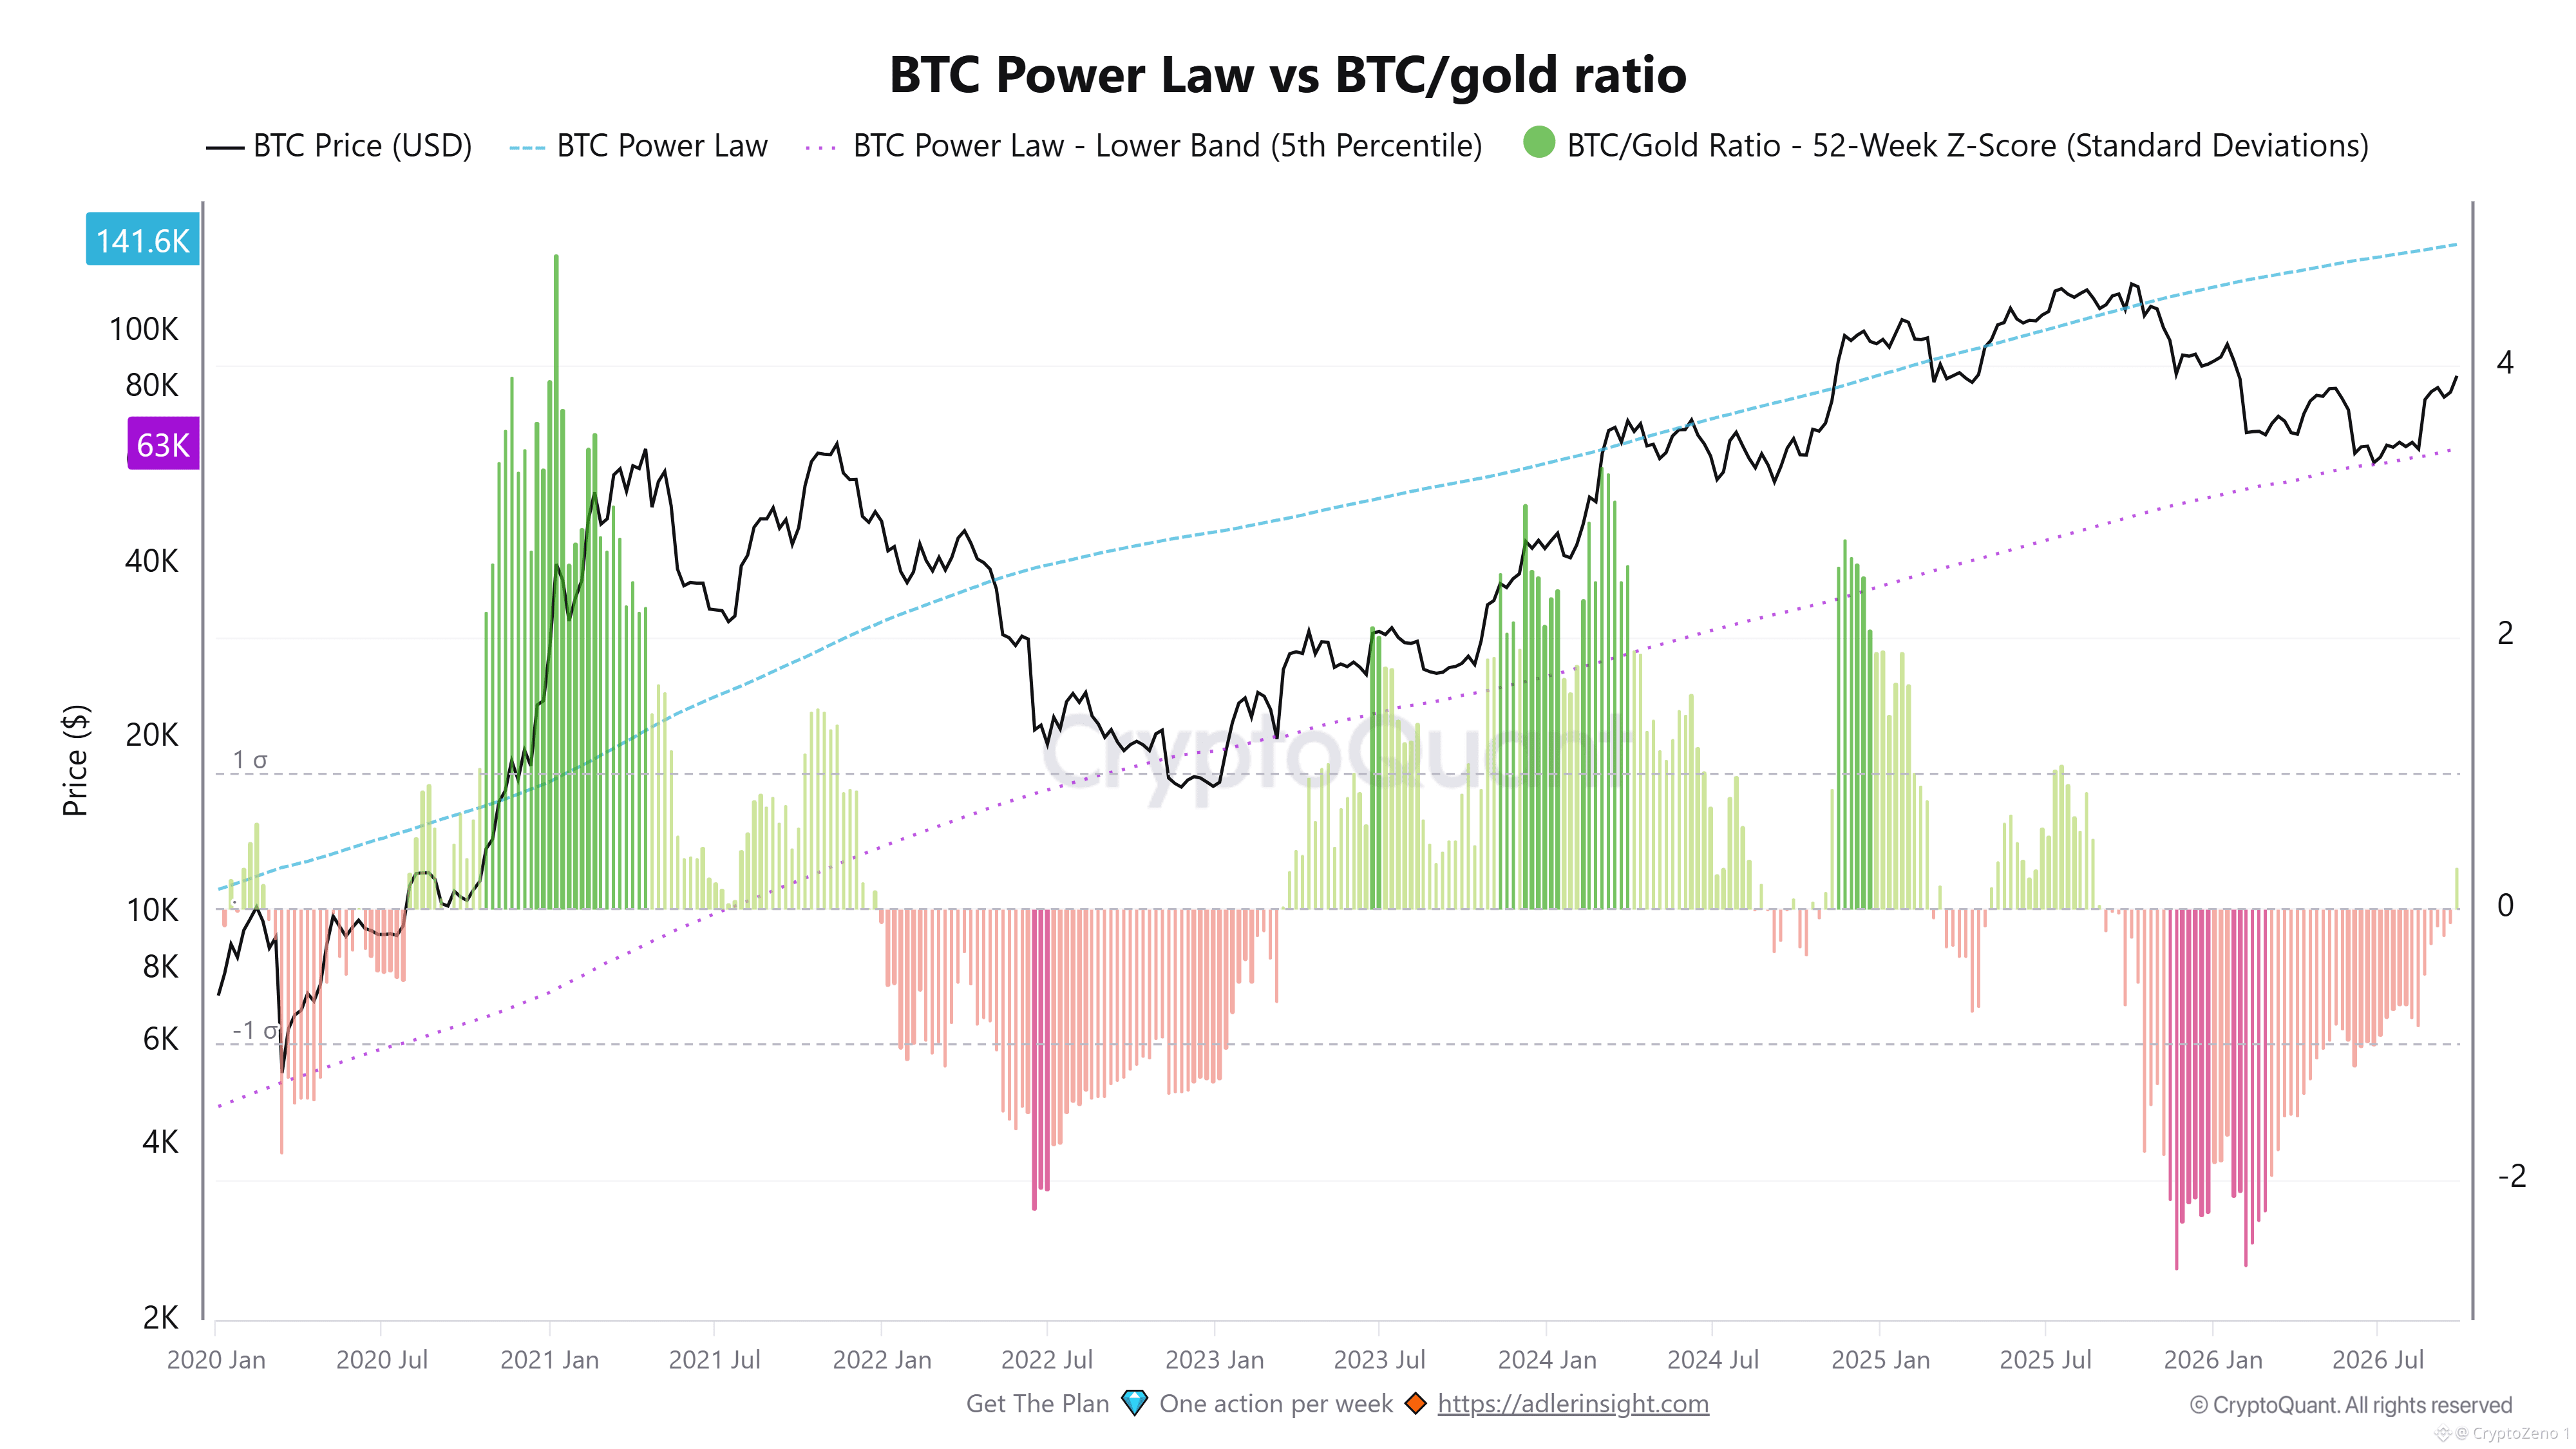
は現在約83Kドルで取引されており、依然として63Kドル付近のパワーロー(下限バンド)を大きく上回っていますが、一方でモデルのトレンドである140Kドル付近は下回っています。これは、ビットコインが過度なバリュエーション(極端な過大評価)という状況ではなく、構造的に支えられた評価ゾーンに位置していることを示します。BTC/ゴールドの52週Zスコアも、長いマイナス期間の後でなお深く低迷しており、ビットコインが相対的に金を大幅にアンダーパフォームしているものの、まだ歴史的な極端値には回帰していないことが分かります。
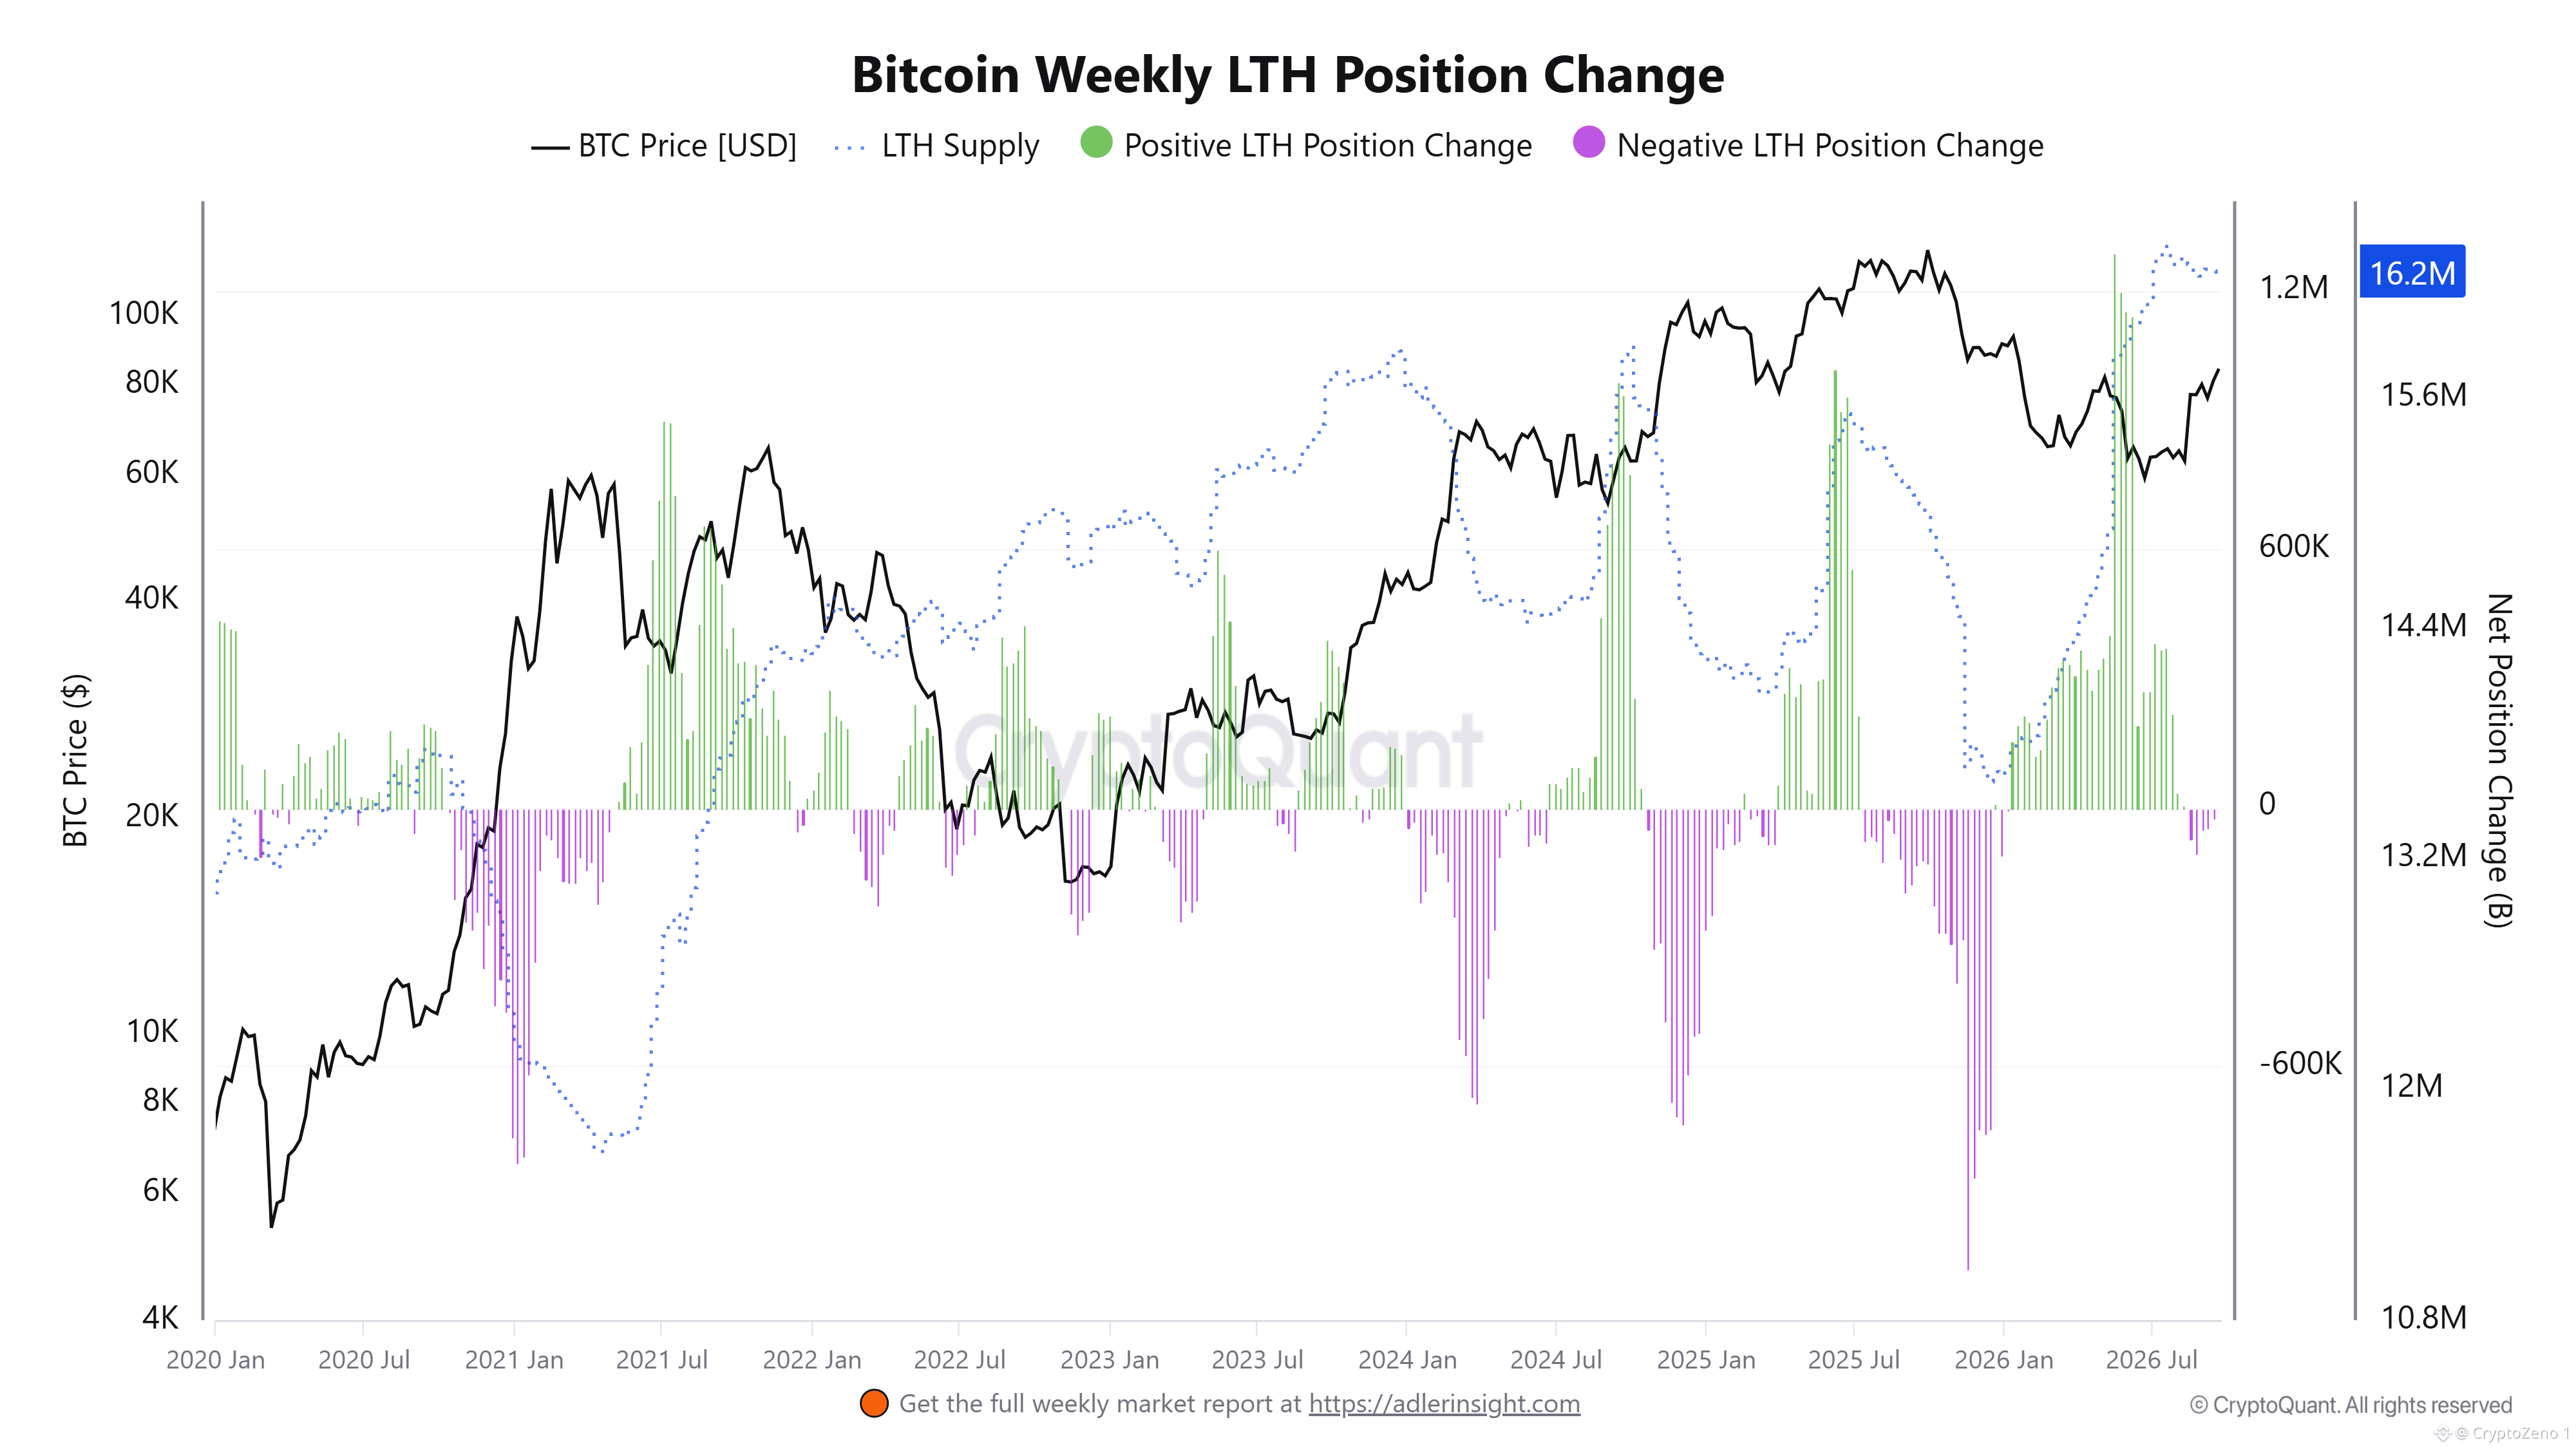
より重要なシグナルは、長期保有者の行動です。週次LTH(長期保有者)ポジション変化が最近、大きくプラス方向へ反転しており、BTCが60Kドル前後から回復する過程で複数の大口の蓄積スパイクが見られました。同時にLTH供給は16.2M BTCへ向けて増加しており、コインが継続的に市場へ分配されるというより、より長い保有期間の形で保有へ移っていることを示唆しています。
これにより、相対的なバリュエーションとオンチェーンの確信(投資の確かさ)の間に興味深い乖離が生まれます。BTCはパワーローの軌道からは大きく下方に留まっている一方、BTC/ゴールド比率はまだ圧縮された状態です。しかし長期保有者はポジションを拡大しています。歴史的には、LTH供給の継続的な増加は、当面の売却のために流動性供給が減る(売りに回りにくくなる)ことにつながり、需要が加速し始めた際のより強固な土台になります。
注目すべき重要な構造は、BTCがパワーロー下限バンドである63Kドル付近を上回った状態で、このLTHの蓄積が持続するかどうかです。BTC/ゴールド比率の持続的な回復と、LTH蓄積の継続が同時に見られれば、相対的な強さが改善し、供給条件が引き締まっていくことを示すでしょう。それまではデータが示すのは、相対的な弱さが大きかった局面から市場が回復しつつあるものの、典型的にレイトサイクルの過熱で見られるようなバリュエーションの極端値にはまだ到達していない、ということです。 #BTC Price Analysis# #Macro Insights#
ビットコインは勢いを取り戻しつつあり、長期保有者が供給を引き締めている
$BTC
は現在約83Kドルで取引されており、依然として63Kドル付近のパワーロー(下限バンド)を大きく上回っていますが、一方でモデルのトレンドである140Kドル付近は下回っています。これは、ビットコインが過度なバリュエーション(極端な過大評価)という状況ではなく、構造的に支えられた評価ゾーンに位置していることを示します。BTC/ゴールドの52週Zスコアも、長いマイナス期間の後でなお深く低迷しており、ビットコインが相対的に金を大幅にアンダーパフォームしているものの、まだ歴史的な極端値には回帰していないことが分かります。
より重要なシグナルは、長期保有者の行動です。週次LTH(長期保有者)ポジション変化が最近、大きくプラス方向へ反転しており、BTCが60Kドル前後から回復する過程で複数の大口の蓄積スパイクが見られました。同時にLTH供給は16.2M BTCへ向けて増加しており、コインが継続的に市場へ分配されるというより、より長い保有期間の形で保有へ移っていることを示唆しています。
これにより、相対的なバリュエーションとオンチェーンの確信(投資の確かさ)の間に興味深い乖離が生まれます。BTCはパワーローの軌道からは大きく下方に留まっている一方、BTC/ゴールド比率はまだ圧縮された状態です。しかし長期保有者はポジションを拡大しています。歴史的には、LTH供給の継続的な増加は、当面の売却のために流動性供給が減る(売りに回りにくくなる)ことにつながり、需要が加速し始めた際のより強固な土台になります。
注目すべき重要な構造は、BTCがパワーロー下限バンドである63Kドル付近を上回った状態で、このLTHの蓄積が持続するかどうかです。BTC/ゴールド比率の持続的な回復と、LTH蓄積の継続が同時に見られれば、相対的な強さが改善し、供給条件が引き締まっていくことを示すでしょう。それまではデータが示すのは、相対的な弱さが大きかった局面から市場が回復しつつあるものの、典型的にレイトサイクルの過熱で見られるようなバリュエーションの極端値にはまだ到達していない、ということです。 #BTC Price Analysis# #Macro Insights#
$BTC
は現在約83Kドルで取引されており、依然として63Kドル付近のパワーロー(下限バンド)を大きく上回っていますが、一方でモデルのトレンドである140Kドル付近は下回っています。これは、ビットコインが過度なバリュエーション(極端な過大評価)という状況ではなく、構造的に支えられた評価ゾーンに位置していることを示します。BTC/ゴールドの52週Zスコアも、長いマイナス期間の後でなお深く低迷しており、ビットコインが相対的に金を大幅にアンダーパフォームしているものの、まだ歴史的な極端値には回帰していないことが分かります。
より重要なシグナルは、長期保有者の行動です。週次LTH(長期保有者)ポジション変化が最近、大きくプラス方向へ反転しており、BTCが60Kドル前後から回復する過程で複数の大口の蓄積スパイクが見られました。同時にLTH供給は16.2M BTCへ向けて増加しており、コインが継続的に市場へ分配されるというより、より長い保有期間の形で保有へ移っていることを示唆しています。
これにより、相対的なバリュエーションとオンチェーンの確信(投資の確かさ)の間に興味深い乖離が生まれます。BTCはパワーローの軌道からは大きく下方に留まっている一方、BTC/ゴールド比率はまだ圧縮された状態です。しかし長期保有者はポジションを拡大しています。歴史的には、LTH供給の継続的な増加は、当面の売却のために流動性供給が減る(売りに回りにくくなる)ことにつながり、需要が加速し始めた際のより強固な土台になります。
注目すべき重要な構造は、BTCがパワーロー下限バンドである63Kドル付近を上回った状態で、このLTHの蓄積が持続するかどうかです。BTC/ゴールド比率の持続的な回復と、LTH蓄積の継続が同時に見られれば、相対的な強さが改善し、供給条件が引き締まっていくことを示すでしょう。それまではデータが示すのは、相対的な弱さが大きかった局面から市場が回復しつつあるものの、典型的にレイトサイクルの過熱で見られるようなバリュエーションの極端値にはまだ到達していない、ということです。 #BTC Price Analysis# #Macro Insights#
46
·
--
💥 #ビットコイン は回復基調にある一方、オンチェーンのリスクは依然として抑制されたまま
$BTC は $84K 付近へ向けて回復してきたが、オンチェーンの構造は、過去にレイトサイクルの過熱を伴っていた条件からはまだ程遠いように見える。現在のセットアップは、実現利益と売り圧力の長期的なリセット後に、市場が強さを取り戻していく局面により整合的だ。
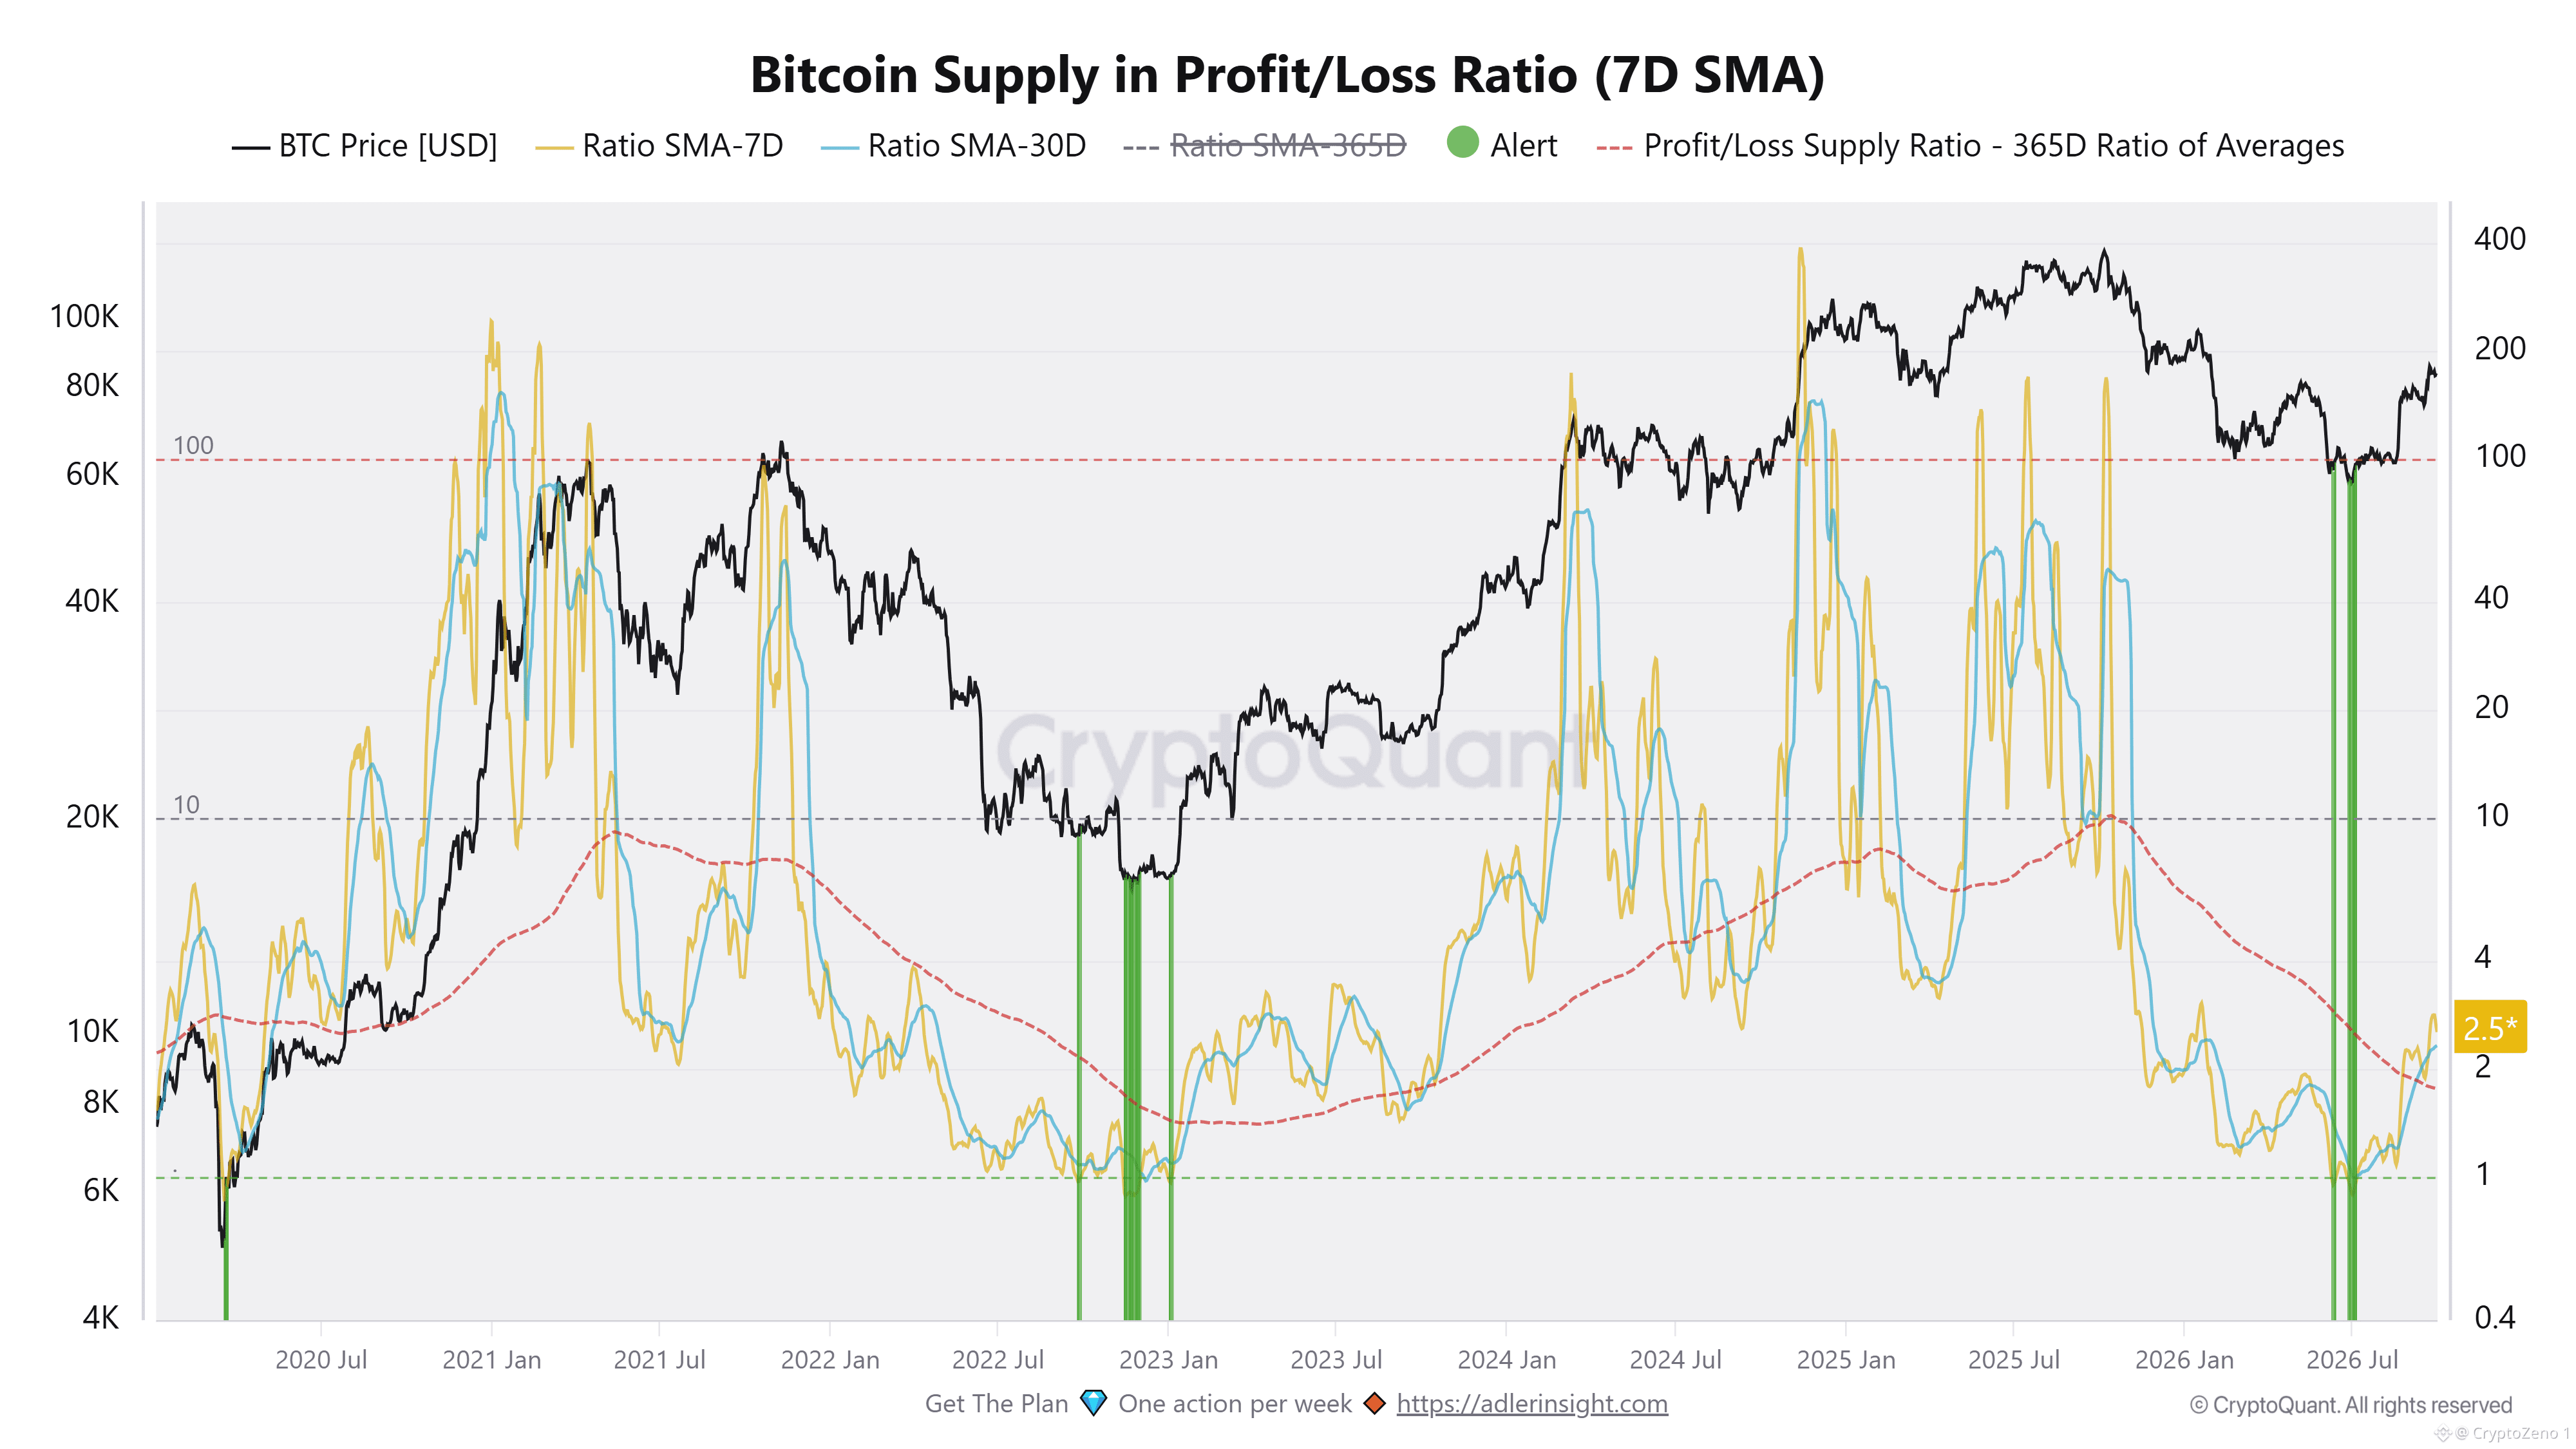
損益比率(Profit/Loss Ratio)の供給は現在およそ 2.5 で、広範な降伏(キャピテーション)期をこれまで示してきた 1.0 を大きく上回っている。しかし、より強い利益確定局面で見られる 10+ の水準にはまだ遠い。これは重要で、最新の価格回復が、利益を得ている供給が攻撃的なディストリビューション(売り分け)の明確な原因になるようなゾーンへ比率をまだ押し上げていないためだ。さらに、7日平均と30日平均も上向きに転じており、改善が単発の一日だけの動きではなく、ある程度の継続性を持っていることを示している。
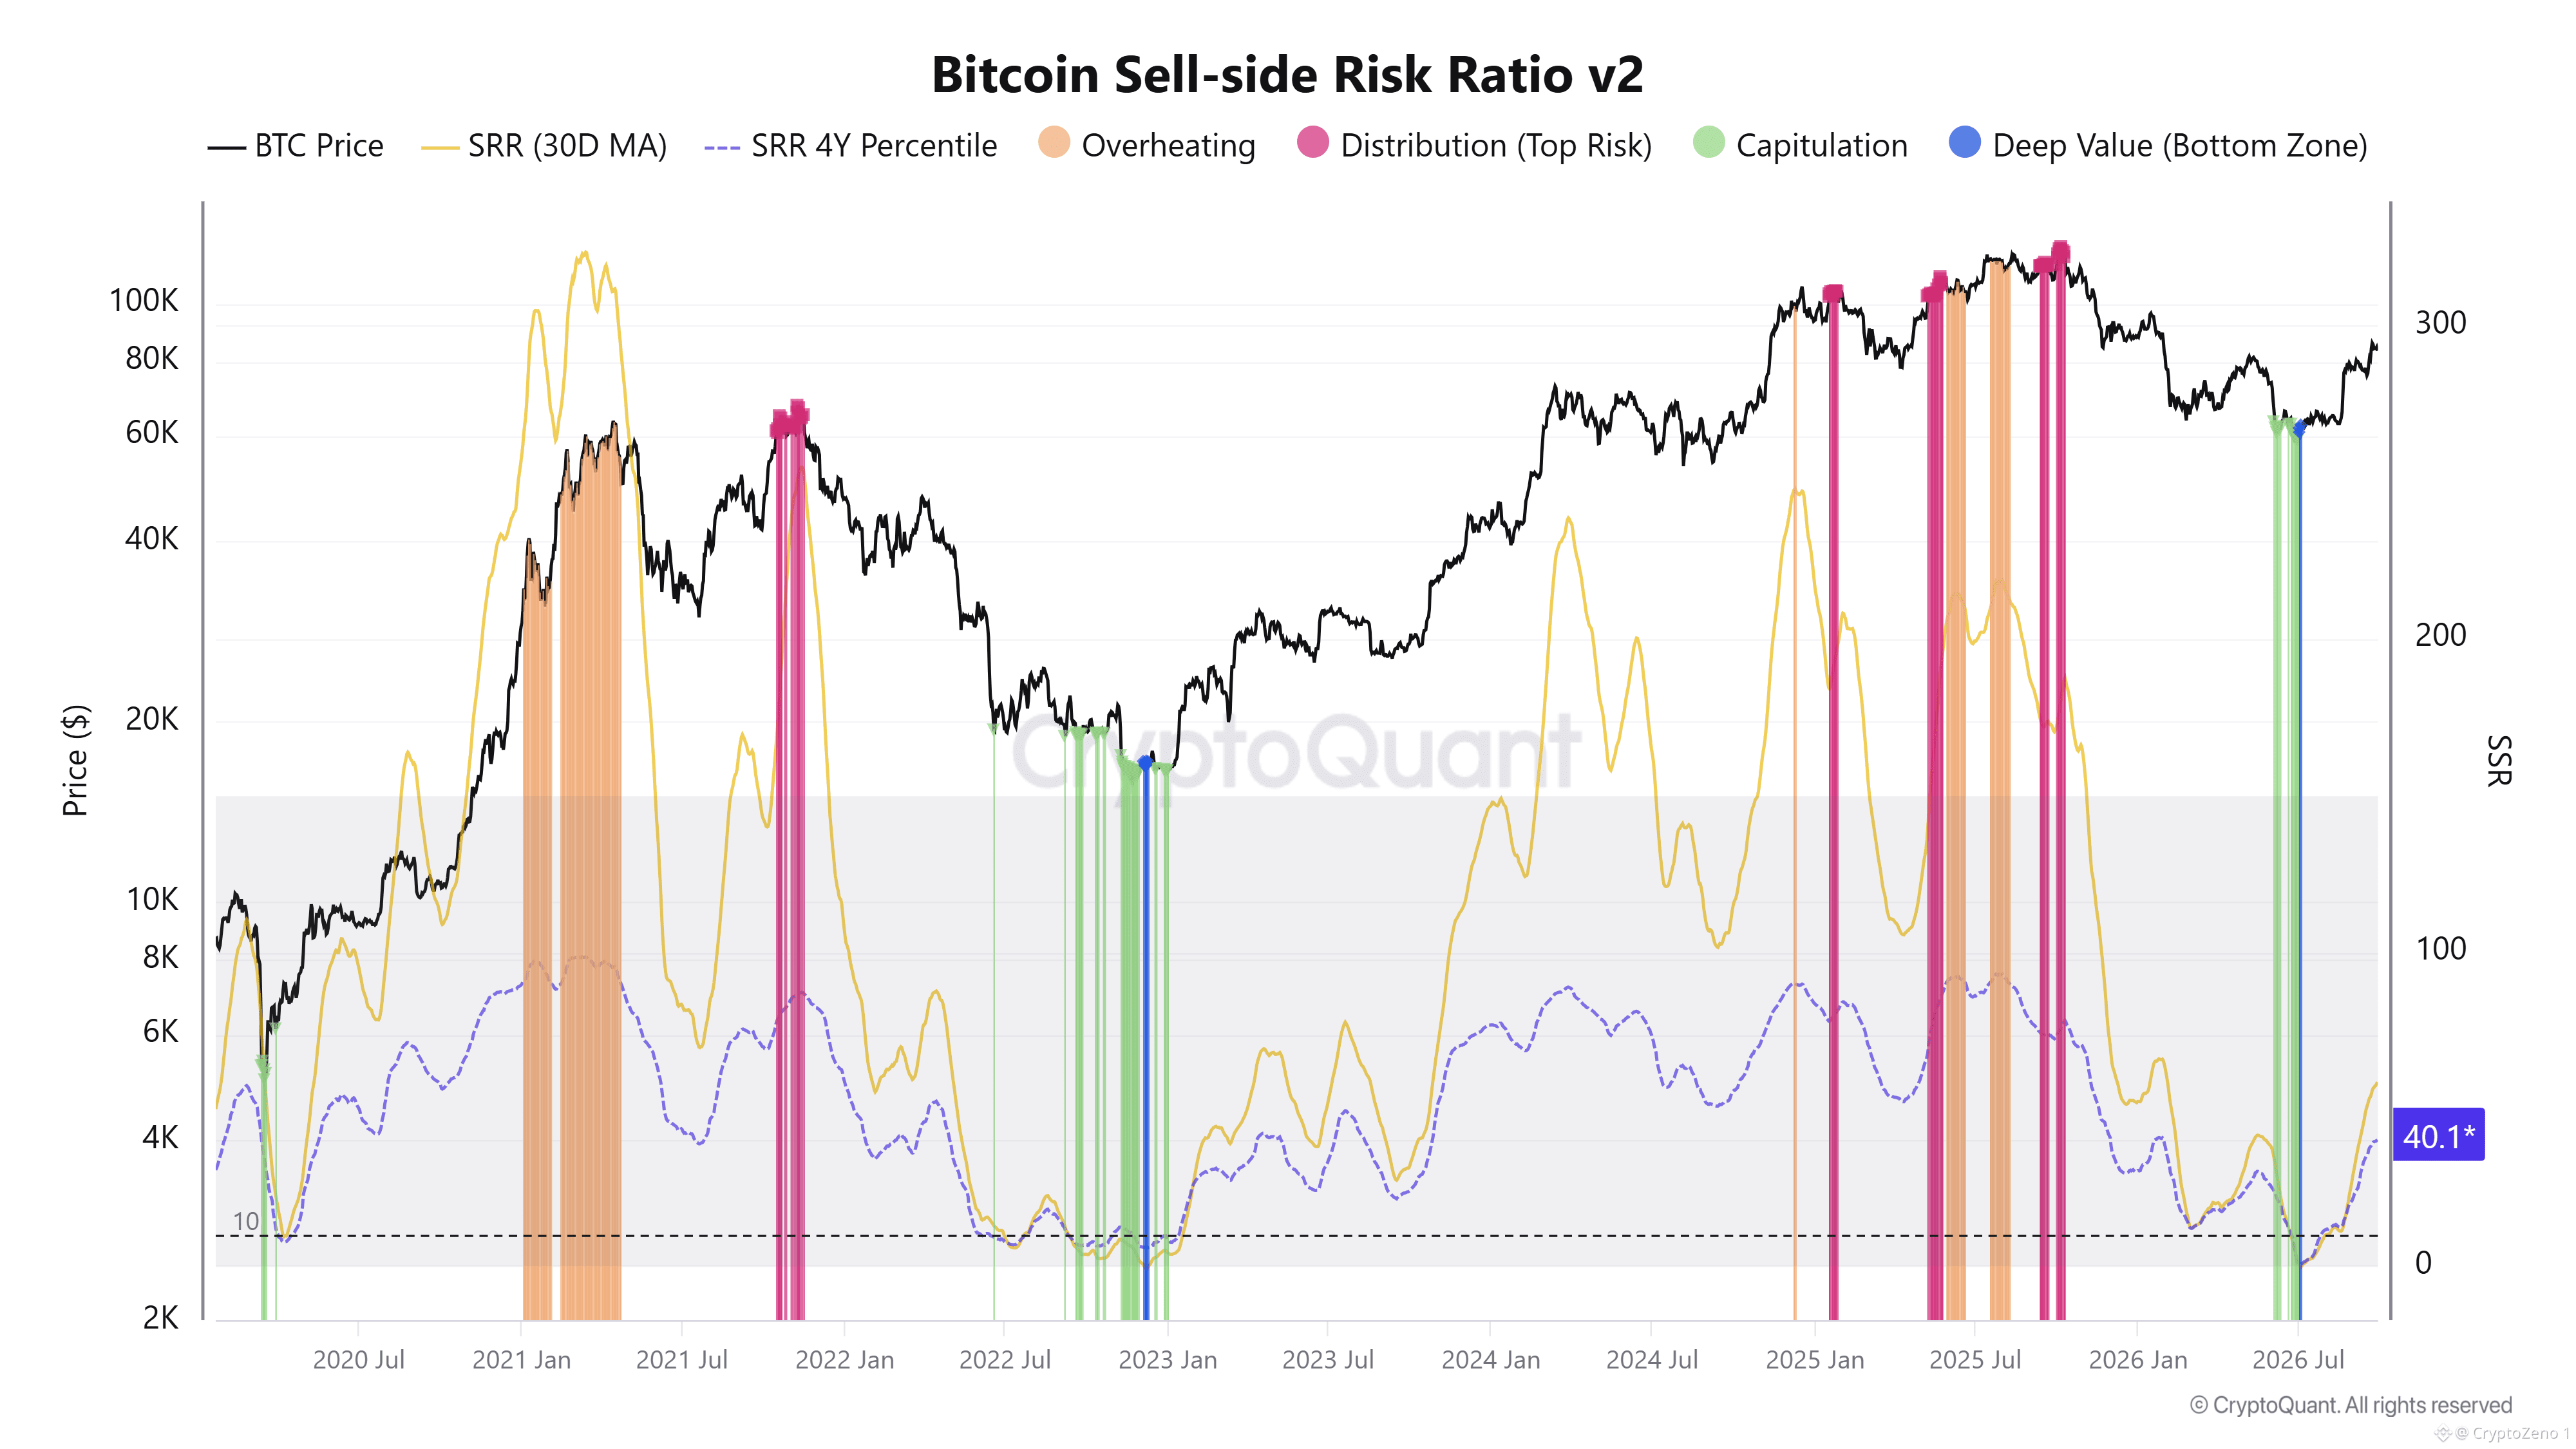
売り手側のリスク比率(Sell-side Risk Ratio)も、もう一つのレイヤーを加える。現在の数値はおよそ 40.1 で、2026年初めに低いレンジへ急落したのち、そこから戻ってきた。歴史的に、この指標における大きな下落は、市場が強制的または感情的な売りの相当部分を使い果たしたときに現れてきた。したがって今回のリバウンドは、価格回復に伴って実現利益の利益確定が戻ってきていることを示唆する一方で、過熱や大規模なディストリビューションに結びつく高水準の領域には依然として大きく届いていない。
これにより、ビットコインは興味深い転換点にある。価格は勢いを取り戻したが、オンチェーンのリスク指標は、通常成熟した投機フェーズを定義する極端な水準にはまだ到達していない。これは、マクロの流動性やリスク選好が悪化すれば、もう一度の調整が起きる可能性を否定するものではない。しかし同時に、目に見えるオンチェーンの過剰がない状態で今回の上昇が進んでいることは示している。次に注目すべきは、これらの比率が価格とともに上昇し続けるのか、それとも歴史的なリスク領域へ向けて加速していくのか、という点だ。 #ビットコイン価格分析# #マクロの洞察#
💥 #ビットコイン は回復基調にある一方、オンチェーンのリスクは依然として抑制されたまま
$BTC は $84K 付近へ向けて回復してきたが、オンチェーンの構造は、過去にレイトサイクルの過熱を伴っていた条件からはまだ程遠いように見える。現在のセットアップは、実現利益と売り圧力の長期的なリセット後に、市場が強さを取り戻していく局面により整合的だ。
損益比率(Profit/Loss Ratio)の供給は現在およそ 2.5 で、広範な降伏(キャピテーション)期をこれまで示してきた 1.0 を大きく上回っている。しかし、より強い利益確定局面で見られる 10+ の水準にはまだ遠い。これは重要で、最新の価格回復が、利益を得ている供給が攻撃的なディストリビューション(売り分け)の明確な原因になるようなゾーンへ比率をまだ押し上げていないためだ。さらに、7日平均と30日平均も上向きに転じており、改善が単発の一日だけの動きではなく、ある程度の継続性を持っていることを示している。
売り手側のリスク比率(Sell-side Risk Ratio)も、もう一つのレイヤーを加える。現在の数値はおよそ 40.1 で、2026年初めに低いレンジへ急落したのち、そこから戻ってきた。歴史的に、この指標における大きな下落は、市場が強制的または感情的な売りの相当部分を使い果たしたときに現れてきた。したがって今回のリバウンドは、価格回復に伴って実現利益の利益確定が戻ってきていることを示唆する一方で、過熱や大規模なディストリビューションに結びつく高水準の領域には依然として大きく届いていない。
これにより、ビットコインは興味深い転換点にある。価格は勢いを取り戻したが、オンチェーンのリスク指標は、通常成熟した投機フェーズを定義する極端な水準にはまだ到達していない。これは、マクロの流動性やリスク選好が悪化すれば、もう一度の調整が起きる可能性を否定するものではない。しかし同時に、目に見えるオンチェーンの過剰がない状態で今回の上昇が進んでいることは示している。次に注目すべきは、これらの比率が価格とともに上昇し続けるのか、それとも歴史的なリスク領域へ向けて加速していくのか、という点だ。 #ビットコイン価格分析# #マクロの洞察#
$BTC は $84K 付近へ向けて回復してきたが、オンチェーンの構造は、過去にレイトサイクルの過熱を伴っていた条件からはまだ程遠いように見える。現在のセットアップは、実現利益と売り圧力の長期的なリセット後に、市場が強さを取り戻していく局面により整合的だ。
損益比率(Profit/Loss Ratio)の供給は現在およそ 2.5 で、広範な降伏(キャピテーション)期をこれまで示してきた 1.0 を大きく上回っている。しかし、より強い利益確定局面で見られる 10+ の水準にはまだ遠い。これは重要で、最新の価格回復が、利益を得ている供給が攻撃的なディストリビューション(売り分け)の明確な原因になるようなゾーンへ比率をまだ押し上げていないためだ。さらに、7日平均と30日平均も上向きに転じており、改善が単発の一日だけの動きではなく、ある程度の継続性を持っていることを示している。
売り手側のリスク比率(Sell-side Risk Ratio)も、もう一つのレイヤーを加える。現在の数値はおよそ 40.1 で、2026年初めに低いレンジへ急落したのち、そこから戻ってきた。歴史的に、この指標における大きな下落は、市場が強制的または感情的な売りの相当部分を使い果たしたときに現れてきた。したがって今回のリバウンドは、価格回復に伴って実現利益の利益確定が戻ってきていることを示唆する一方で、過熱や大規模なディストリビューションに結びつく高水準の領域には依然として大きく届いていない。
これにより、ビットコインは興味深い転換点にある。価格は勢いを取り戻したが、オンチェーンのリスク指標は、通常成熟した投機フェーズを定義する極端な水準にはまだ到達していない。これは、マクロの流動性やリスク選好が悪化すれば、もう一度の調整が起きる可能性を否定するものではない。しかし同時に、目に見えるオンチェーンの過剰がない状態で今回の上昇が進んでいることは示している。次に注目すべきは、これらの比率が価格とともに上昇し続けるのか、それとも歴史的なリスク領域へ向けて加速していくのか、という点だ。 #ビットコイン価格分析# #マクロの洞察#
83
·
--
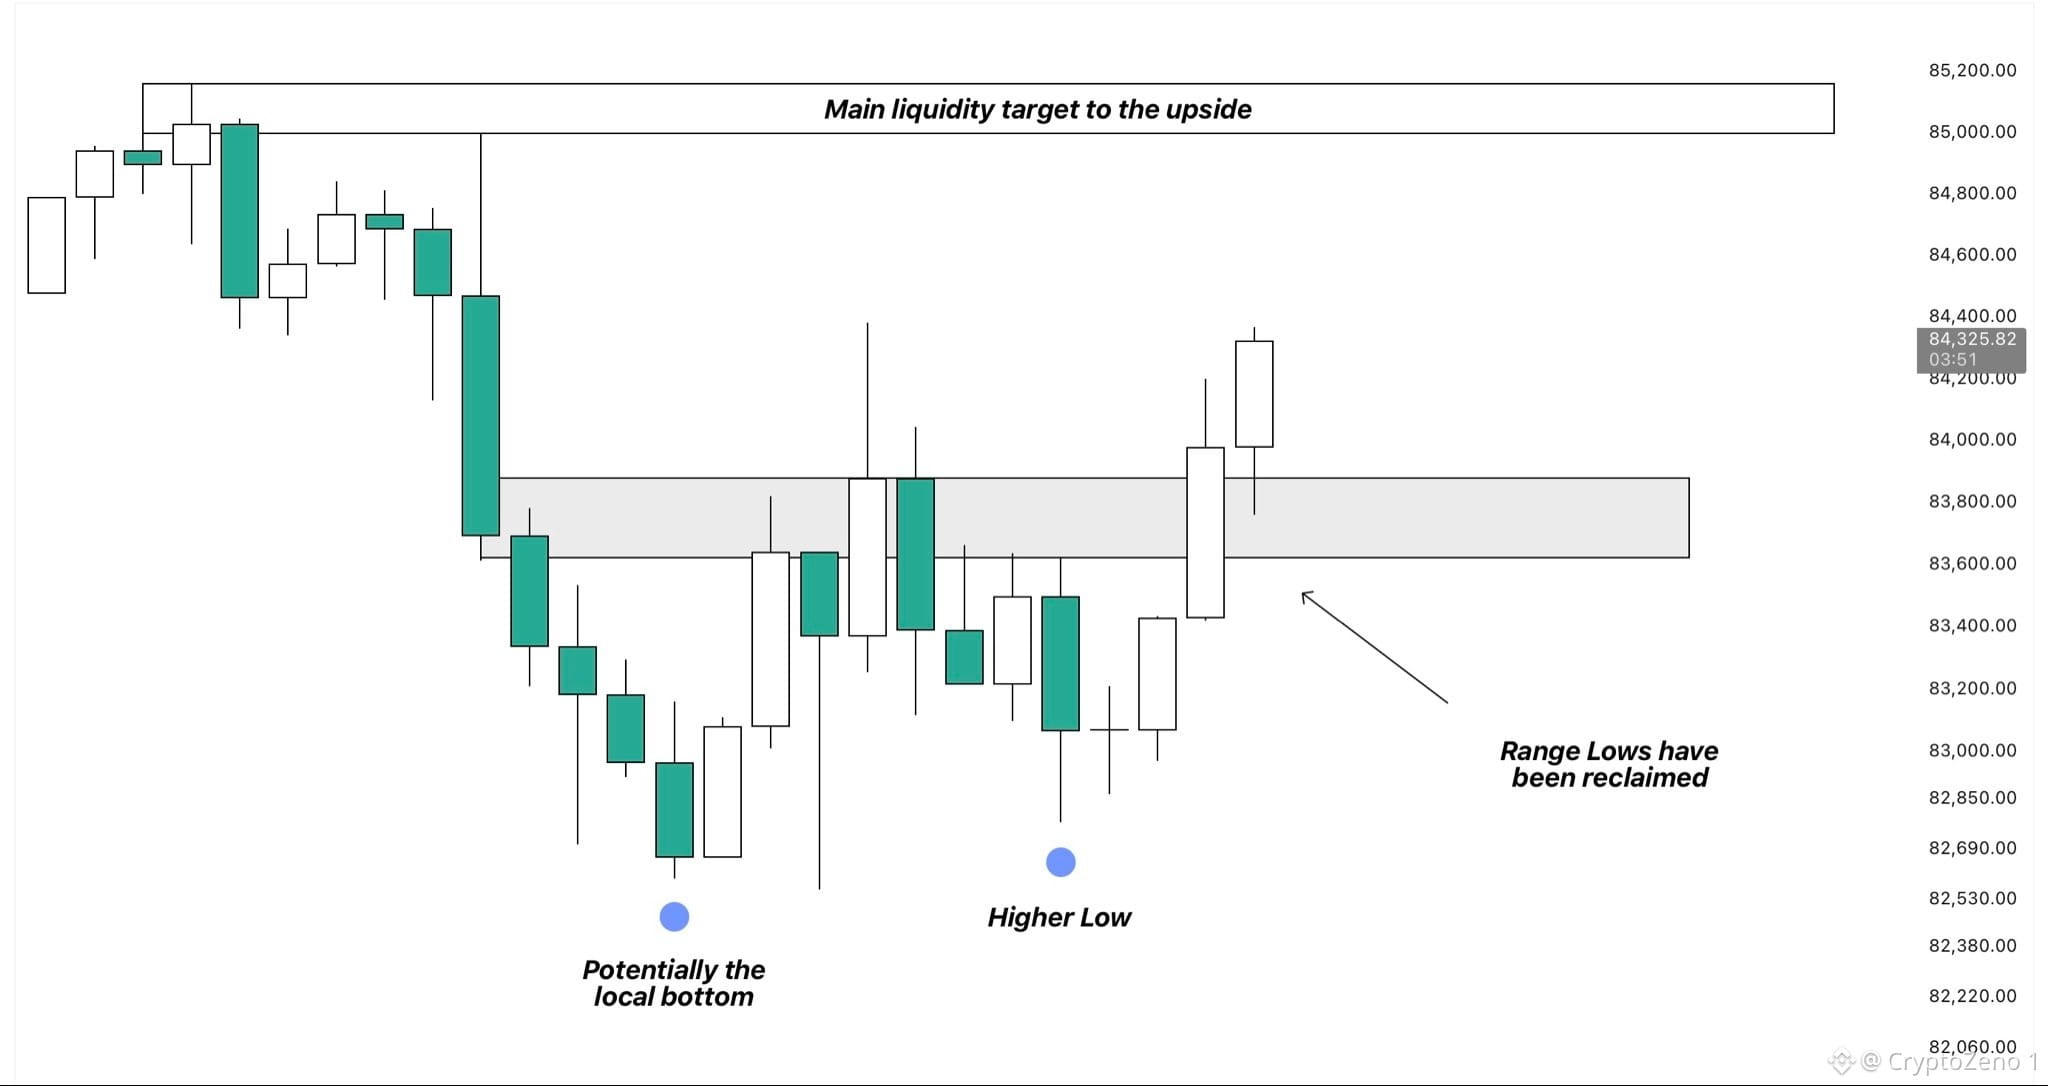
$BTC 地元のボトムは実はすでに形成されている可能性があります。
価格はついにレンジの安値を公式に奪還し、そこを上回る形で定着を続けています。
LTFでは、BTCはすでにより高い安値を付けており、さらにより高い高値の形成にも近づいています。
ここからは、$85kの領域への継続が非常に起こりやすいと考えます。というのも、そこには現在、短期の流動性の大半が位置しているからです。
もし強気の勢いがその水準を押し上げるほど十分なら、その後は$87k付近の高値に向けて再び上昇する可能性があります。
一方で、そこでの反発(リジェクション)が起これば、当面はBTCはレンジ内にとどまるでしょう。 #BTC Price Analysis# #Macro Insights#
$BTC 地元のボトムは実はすでに形成されている可能性があります。
価格はついにレンジの安値を公式に奪還し、そこを上回る形で定着を続けています。
LTFでは、BTCはすでにより高い安値を付けており、さらにより高い高値の形成にも近づいています。
ここからは、$85kの領域への継続が非常に起こりやすいと考えます。というのも、そこには現在、短期の流動性の大半が位置しているからです。
もし強気の勢いがその水準を押し上げるほど十分なら、その後は$87k付近の高値に向けて再び上昇する可能性があります。
一方で、そこでの反発(リジェクション)が起これば、当面はBTCはレンジ内にとどまるでしょう。 #BTC Price Analysis# #Macro Insights#
価格はついにレンジの安値を公式に奪還し、そこを上回る形で定着を続けています。
LTFでは、BTCはすでにより高い安値を付けており、さらにより高い高値の形成にも近づいています。
ここからは、$85kの領域への継続が非常に起こりやすいと考えます。というのも、そこには現在、短期の流動性の大半が位置しているからです。
もし強気の勢いがその水準を押し上げるほど十分なら、その後は$87k付近の高値に向けて再び上昇する可能性があります。
一方で、そこでの反発(リジェクション)が起これば、当面はBTCはレンジ内にとどまるでしょう。 #BTC Price Analysis# #Macro Insights#
96
·
--
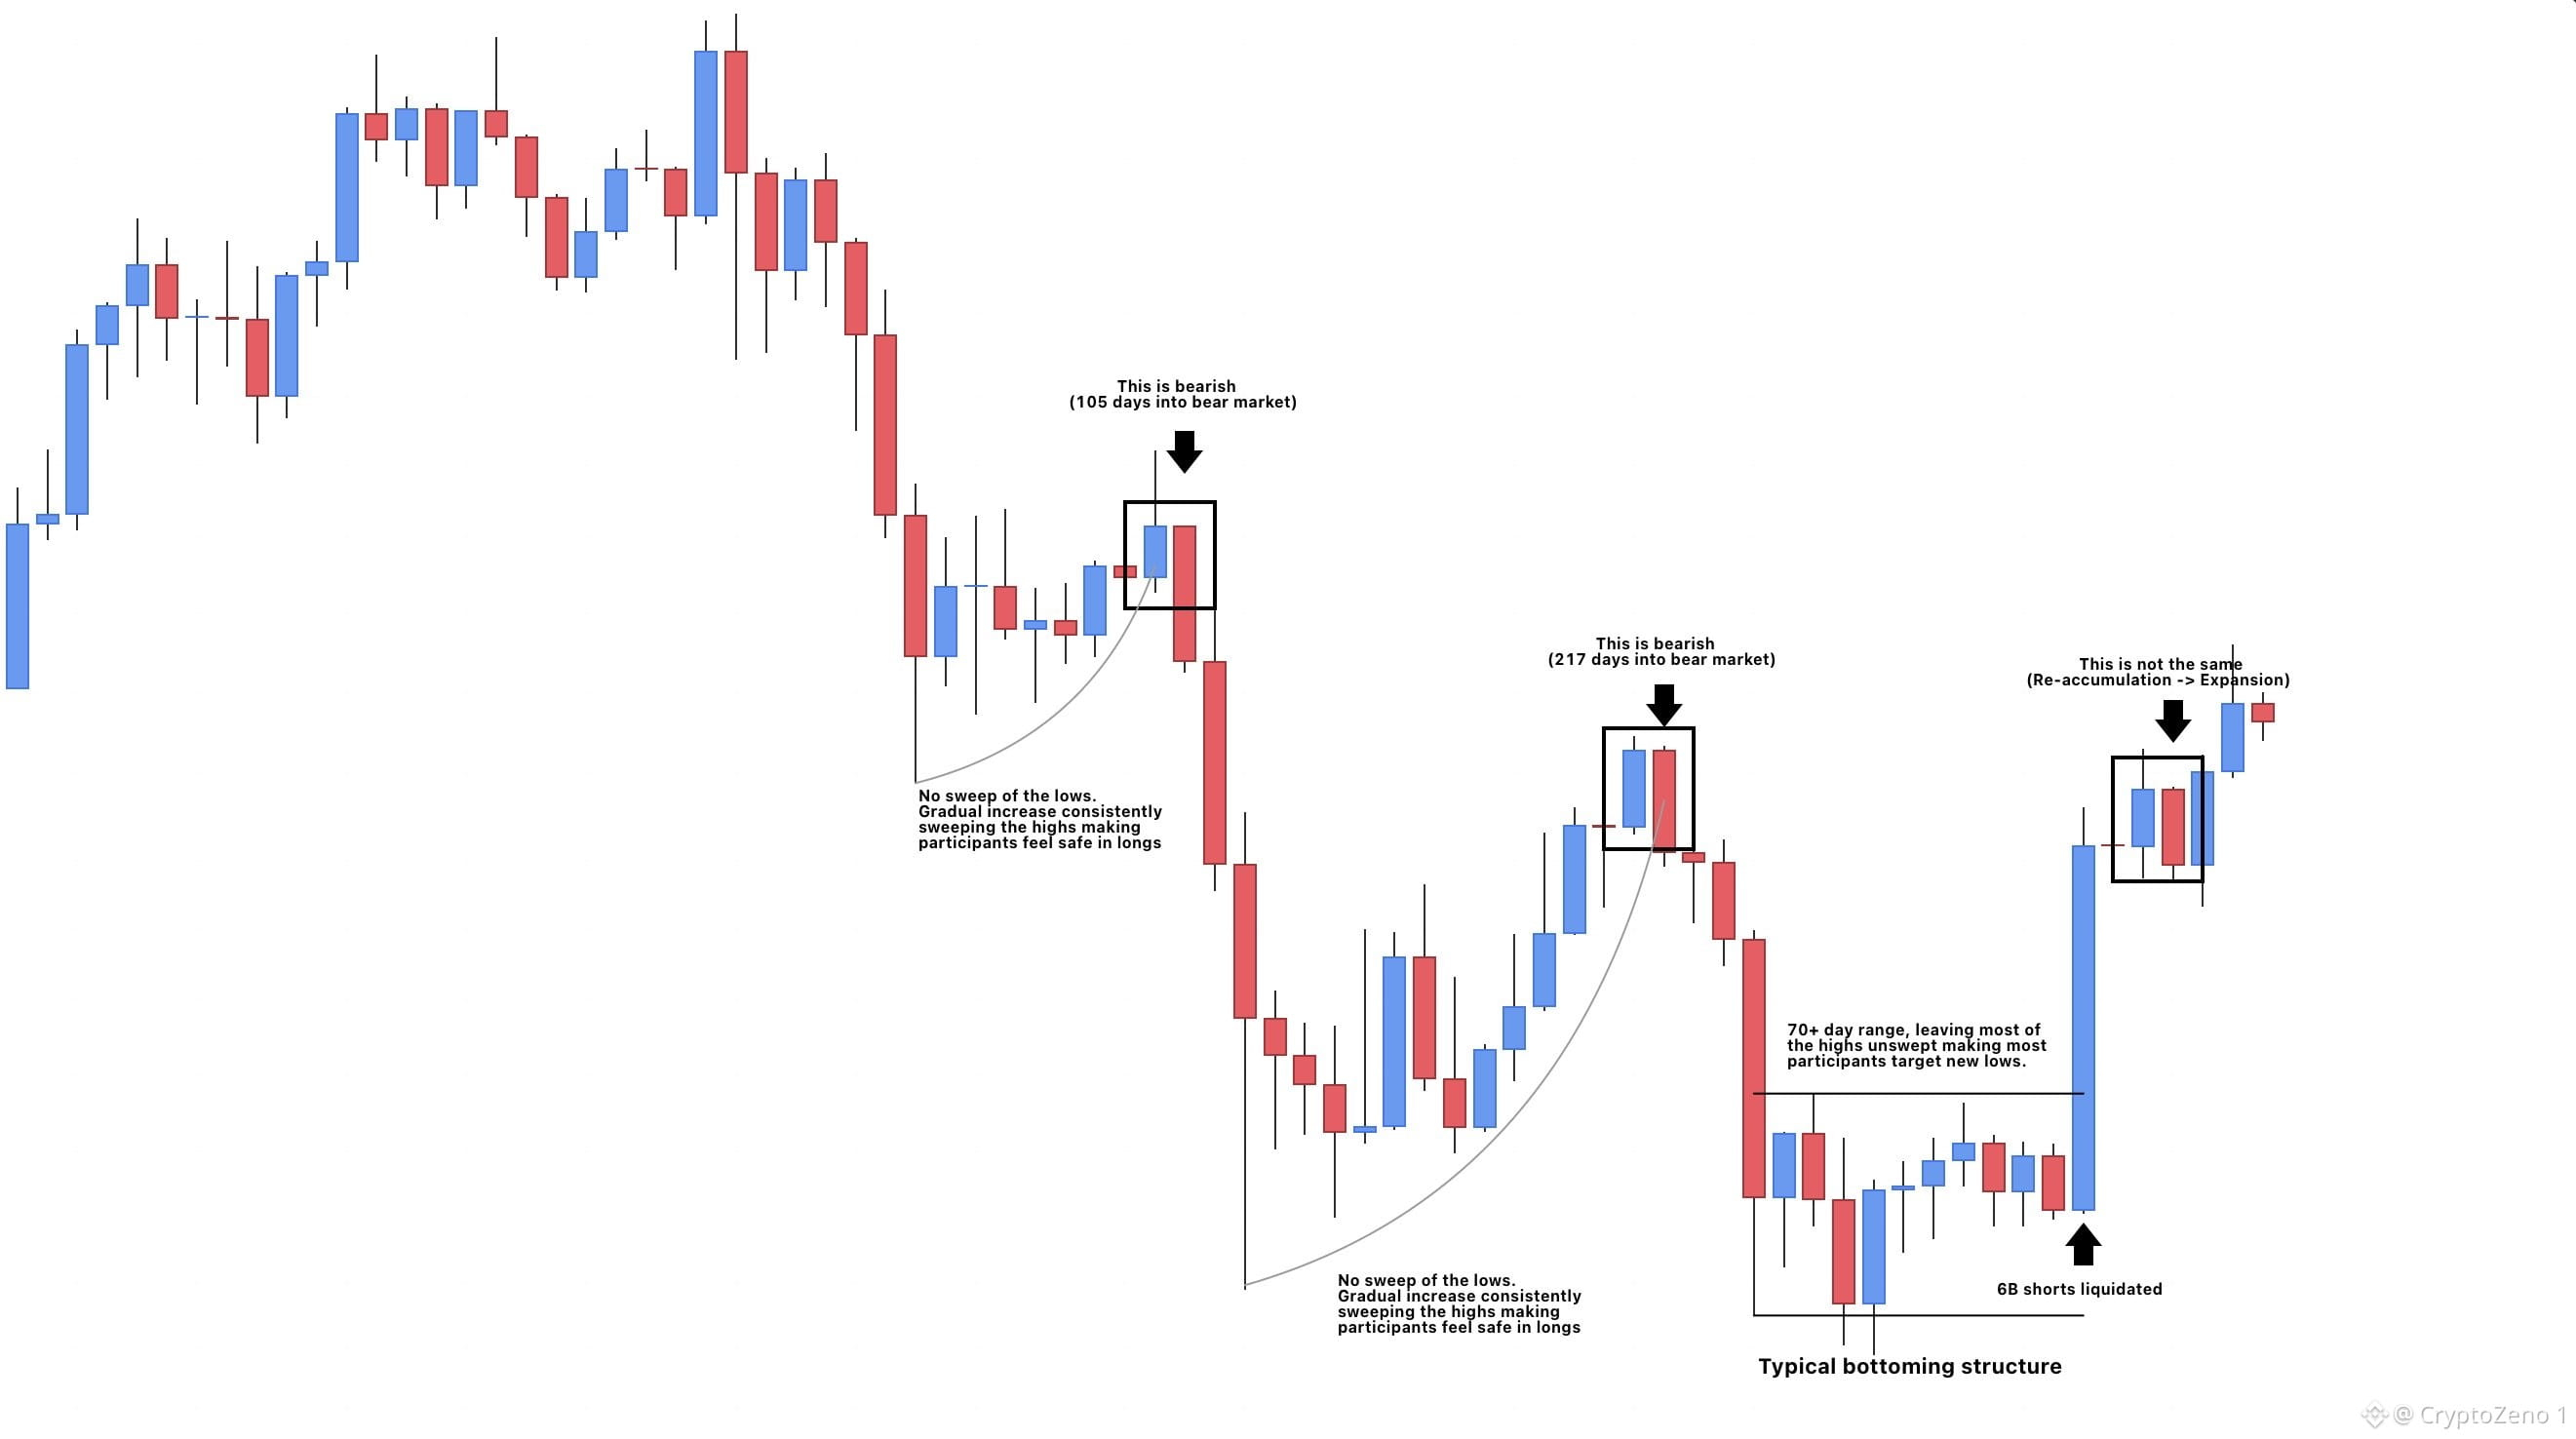
$BTC それは同じではなかった…
動きの前後の構造が重要です。3本すべての下降型の包み足(ベア・エンゴルフィング)でしたか?はい。ですが、それぞれの発生の周囲の構造を見てください。
3本目は、2か月以上のレンジからのブレイクアウト後に出現し、ショート6Bドル分を清算しました。これは、直前の2つのケースとはまったく違います。そこでは価格がショートを狙い続けた一方で、ほとんどのヒゲの安値が回収されず、ロング勢に安全感を与えていました。
文脈が重要です。これは底打ちが入り、より高い価格が来ることを示す明確なサインです。🎲 #BTC Price Analysis# #Macro Insights#
$BTC それは同じではなかった…
動きの前後の構造が重要です。3本すべての下降型の包み足(ベア・エンゴルフィング)でしたか?はい。ですが、それぞれの発生の周囲の構造を見てください。
3本目は、2か月以上のレンジからのブレイクアウト後に出現し、ショート6Bドル分を清算しました。これは、直前の2つのケースとはまったく違います。そこでは価格がショートを狙い続けた一方で、ほとんどのヒゲの安値が回収されず、ロング勢に安全感を与えていました。
文脈が重要です。これは底打ちが入り、より高い価格が来ることを示す明確なサインです。🎲 #BTC Price Analysis# #Macro Insights#
動きの前後の構造が重要です。3本すべての下降型の包み足(ベア・エンゴルフィング)でしたか?はい。ですが、それぞれの発生の周囲の構造を見てください。
3本目は、2か月以上のレンジからのブレイクアウト後に出現し、ショート6Bドル分を清算しました。これは、直前の2つのケースとはまったく違います。そこでは価格がショートを狙い続けた一方で、ほとんどのヒゲの安値が回収されず、ロング勢に安全感を与えていました。
文脈が重要です。これは底打ちが入り、より高い価格が来ることを示す明確なサインです。🎲 #BTC Price Analysis# #Macro Insights#
78
·
--
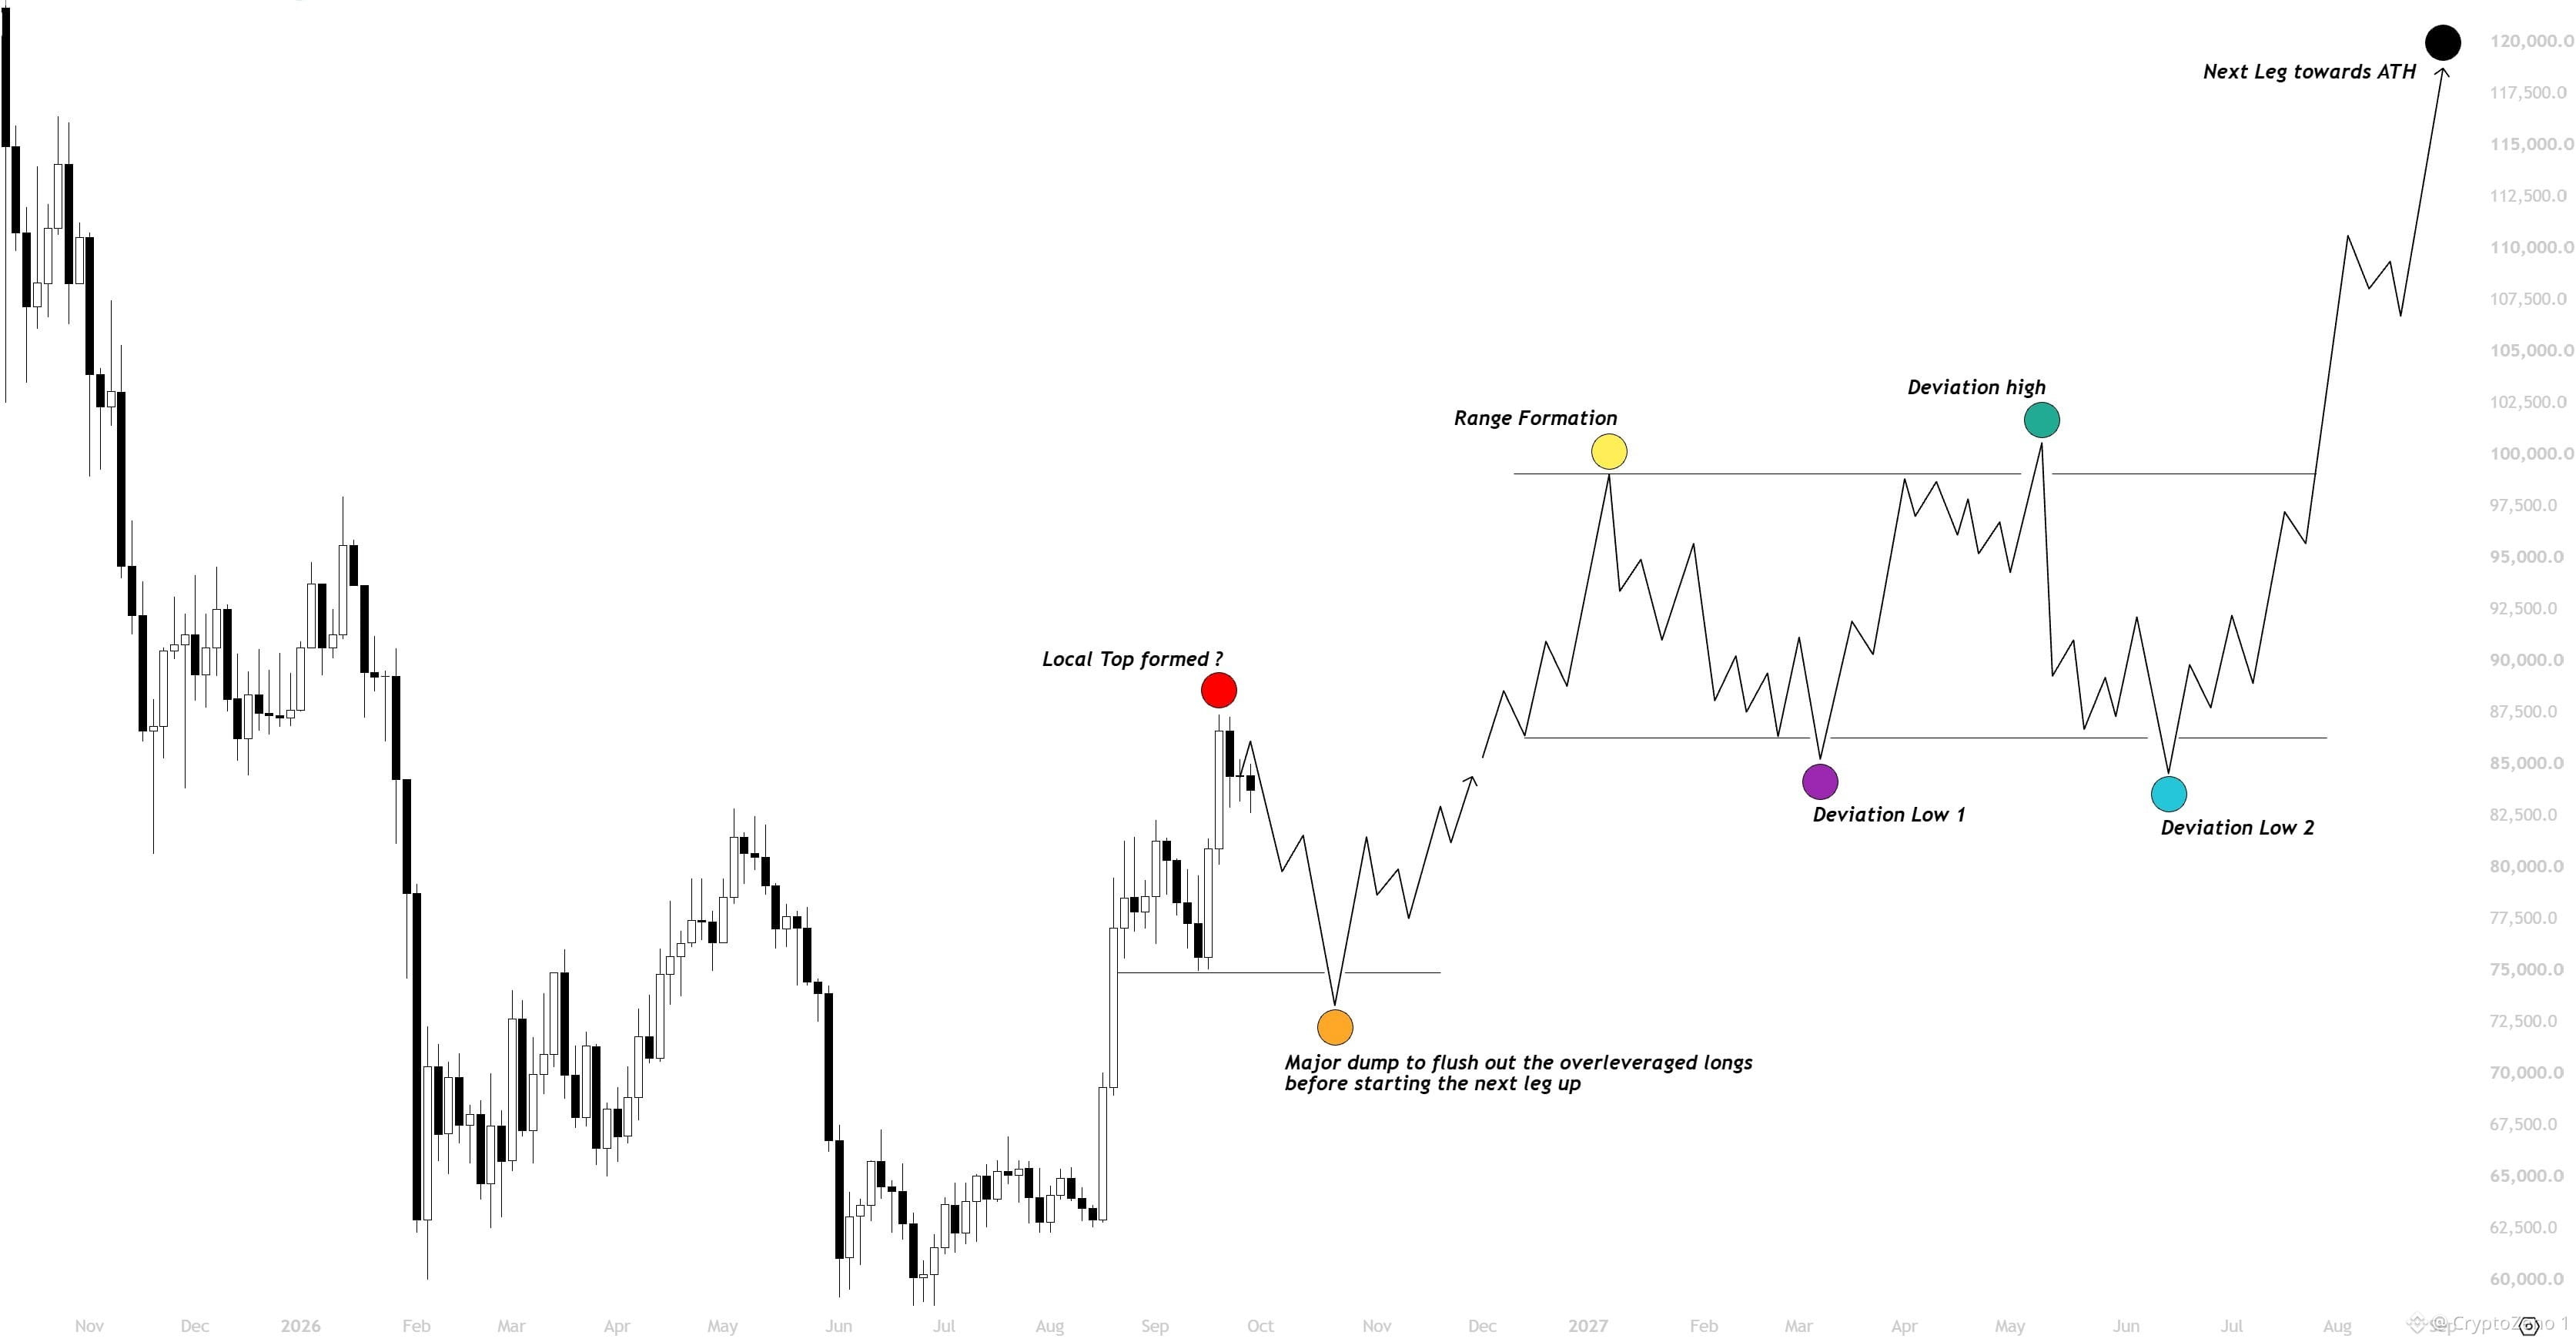
$BTC 予想されるトップ付近で、価格が勢いを失い始めています。
ただし、ベアリッシュなリテストとして85.5kまで、もう一度上昇(ポンプ)が見られるかもしれません。
しかしその後は、下方向の流動性へ向けて価格が下落し始めることを想定しています。
この下落は、新しい月次のローソク足の開始に合わせて、今後1〜2週間の間に起きると見ています。
つまり基本的に、10月は完全に放物線状(パラボリック)に突入する前の、最後の良い蓄積(アキュム)月になるはずです。
価格が100kに到達するには、今年は難しいと思います。もしくは2027年の第1四半期になるかもしれません。
全体として、これが今のところ次のQ4に向けた私の計画です。 #BTC Price Analysis# #Macro Insights# #Meme Alpha#
$BTC 予想されるトップ付近で、価格が勢いを失い始めています。
ただし、ベアリッシュなリテストとして85.5kまで、もう一度上昇(ポンプ)が見られるかもしれません。
しかしその後は、下方向の流動性へ向けて価格が下落し始めることを想定しています。
この下落は、新しい月次のローソク足の開始に合わせて、今後1〜2週間の間に起きると見ています。
つまり基本的に、10月は完全に放物線状(パラボリック)に突入する前の、最後の良い蓄積(アキュム)月になるはずです。
価格が100kに到達するには、今年は難しいと思います。もしくは2027年の第1四半期になるかもしれません。
全体として、これが今のところ次のQ4に向けた私の計画です。 #BTC Price Analysis# #Macro Insights# #Meme Alpha#
ただし、ベアリッシュなリテストとして85.5kまで、もう一度上昇(ポンプ)が見られるかもしれません。
しかしその後は、下方向の流動性へ向けて価格が下落し始めることを想定しています。
この下落は、新しい月次のローソク足の開始に合わせて、今後1〜2週間の間に起きると見ています。
つまり基本的に、10月は完全に放物線状(パラボリック)に突入する前の、最後の良い蓄積(アキュム)月になるはずです。
価格が100kに到達するには、今年は難しいと思います。もしくは2027年の第1四半期になるかもしれません。
全体として、これが今のところ次のQ4に向けた私の計画です。 #BTC Price Analysis# #Macro Insights# #Meme Alpha#
55
·
--
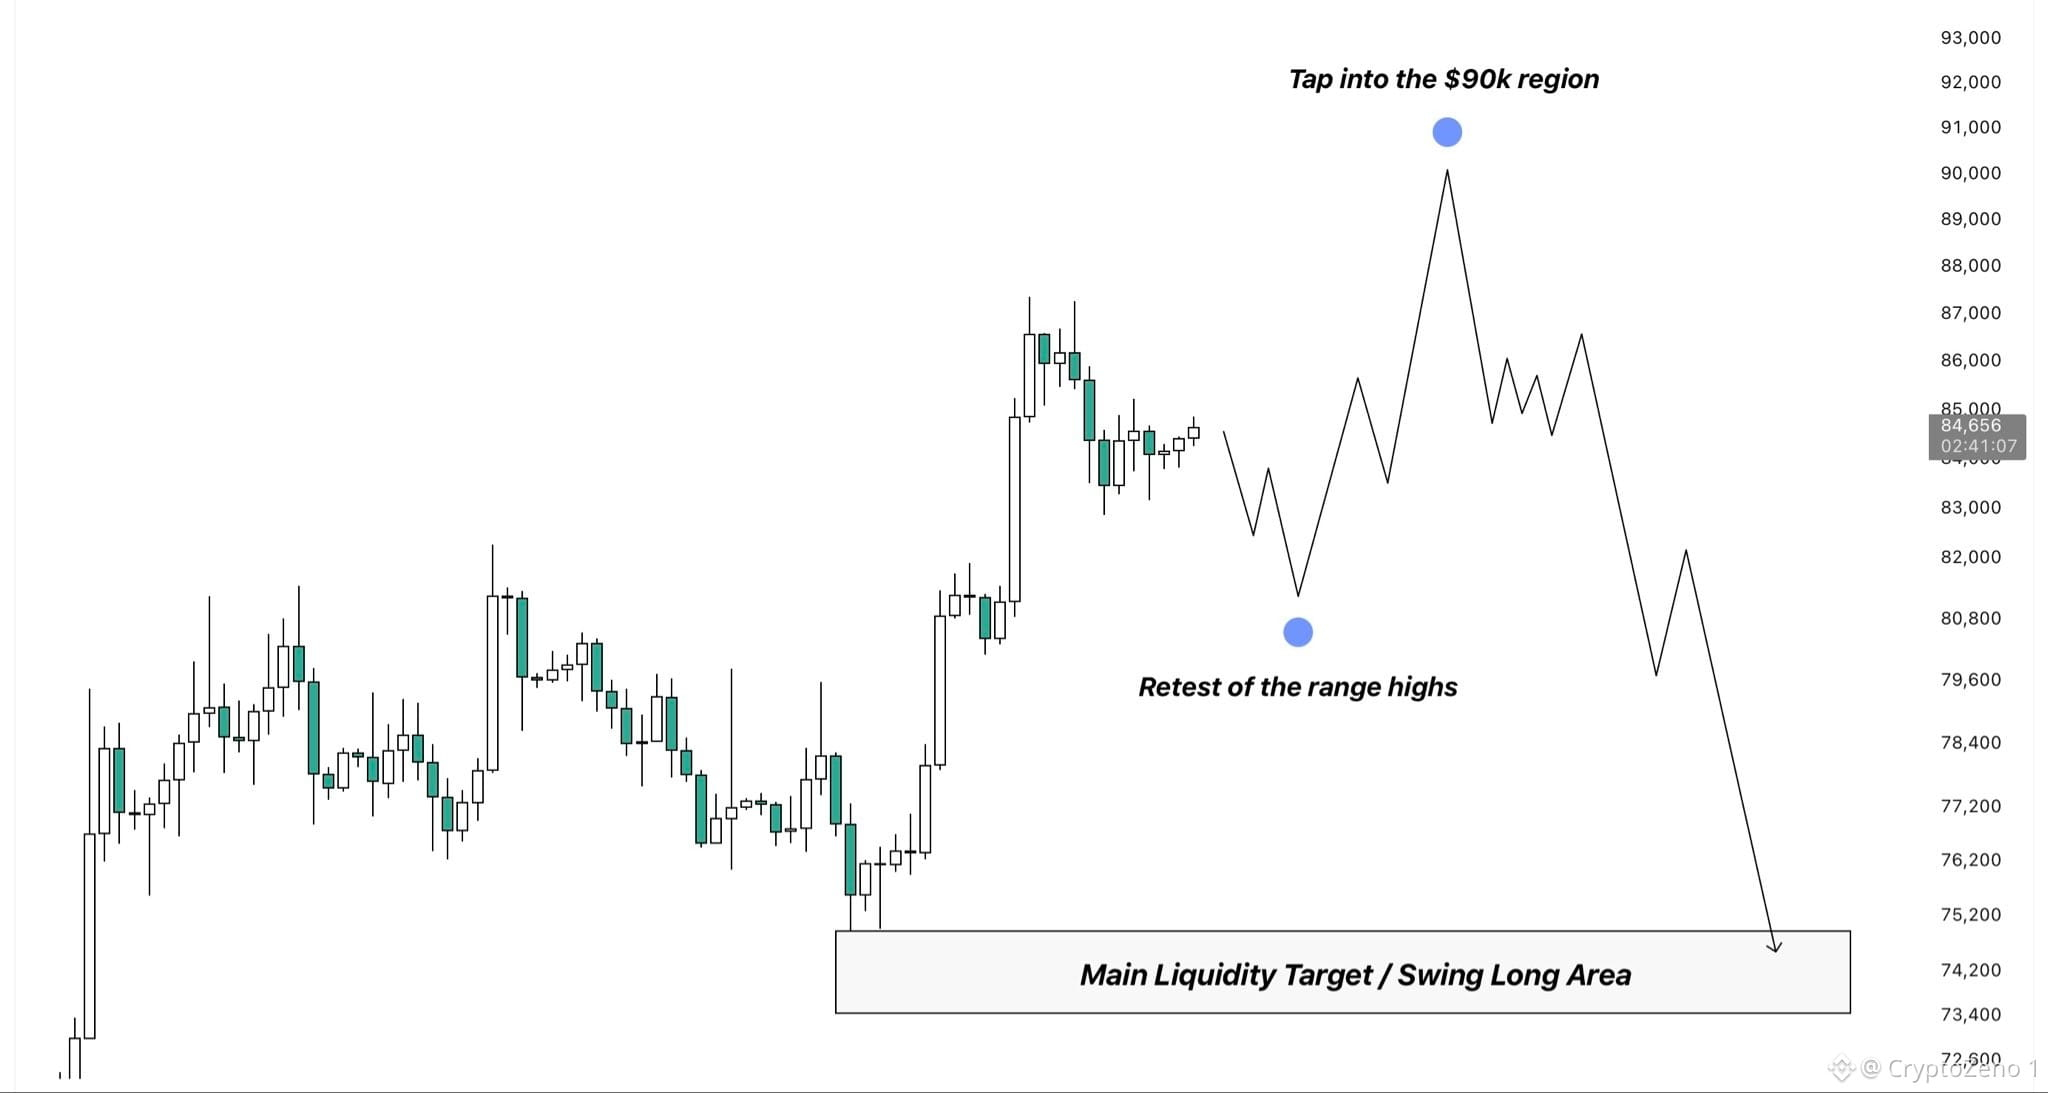
$BTC 今後数週間のためのブループリントはこちらです。
まず、HTFで強気の市場構造への転換が起きたことを確認するために、$82.8kを上回る週足クローズを見たいです。
その後、BTCが直前のレンジ上限を再テストして、さらにいくつかのロングの清算(ロング・リキディティ)を刈り取りに行き、その後、上方向へもう一段の拡大が起きて$90k付近へ到達する展開が見えてきます。
私が注目しているのは、ここでの可能性のあるスイングショートです。直近の上昇の安値をターゲットにします。あの下側のゾーンは、現在私のメインの下落目標であり、流動性の観点から根拠があるだけでなく、同時に次のスイングロングのための優先エリアでもあります。
これはチャート目線ではとても現実的なシナリオであるだけでなく、流動性の観点からも理にかなっています。つまり、次の上昇局面が始まる前に、BTCが左右どちら側の流動性もクリアできるためです。 #BTC Price Analysis# #Macro Insights#
$BTC 今後数週間のためのブループリントはこちらです。
まず、HTFで強気の市場構造への転換が起きたことを確認するために、$82.8kを上回る週足クローズを見たいです。
その後、BTCが直前のレンジ上限を再テストして、さらにいくつかのロングの清算(ロング・リキディティ)を刈り取りに行き、その後、上方向へもう一段の拡大が起きて$90k付近へ到達する展開が見えてきます。
私が注目しているのは、ここでの可能性のあるスイングショートです。直近の上昇の安値をターゲットにします。あの下側のゾーンは、現在私のメインの下落目標であり、流動性の観点から根拠があるだけでなく、同時に次のスイングロングのための優先エリアでもあります。
これはチャート目線ではとても現実的なシナリオであるだけでなく、流動性の観点からも理にかなっています。つまり、次の上昇局面が始まる前に、BTCが左右どちら側の流動性もクリアできるためです。 #BTC Price Analysis# #Macro Insights#
まず、HTFで強気の市場構造への転換が起きたことを確認するために、$82.8kを上回る週足クローズを見たいです。
その後、BTCが直前のレンジ上限を再テストして、さらにいくつかのロングの清算(ロング・リキディティ)を刈り取りに行き、その後、上方向へもう一段の拡大が起きて$90k付近へ到達する展開が見えてきます。
私が注目しているのは、ここでの可能性のあるスイングショートです。直近の上昇の安値をターゲットにします。あの下側のゾーンは、現在私のメインの下落目標であり、流動性の観点から根拠があるだけでなく、同時に次のスイングロングのための優先エリアでもあります。
これはチャート目線ではとても現実的なシナリオであるだけでなく、流動性の観点からも理にかなっています。つまり、次の上昇局面が始まる前に、BTCが左右どちら側の流動性もクリアできるためです。 #BTC Price Analysis# #Macro Insights#
76
·
--
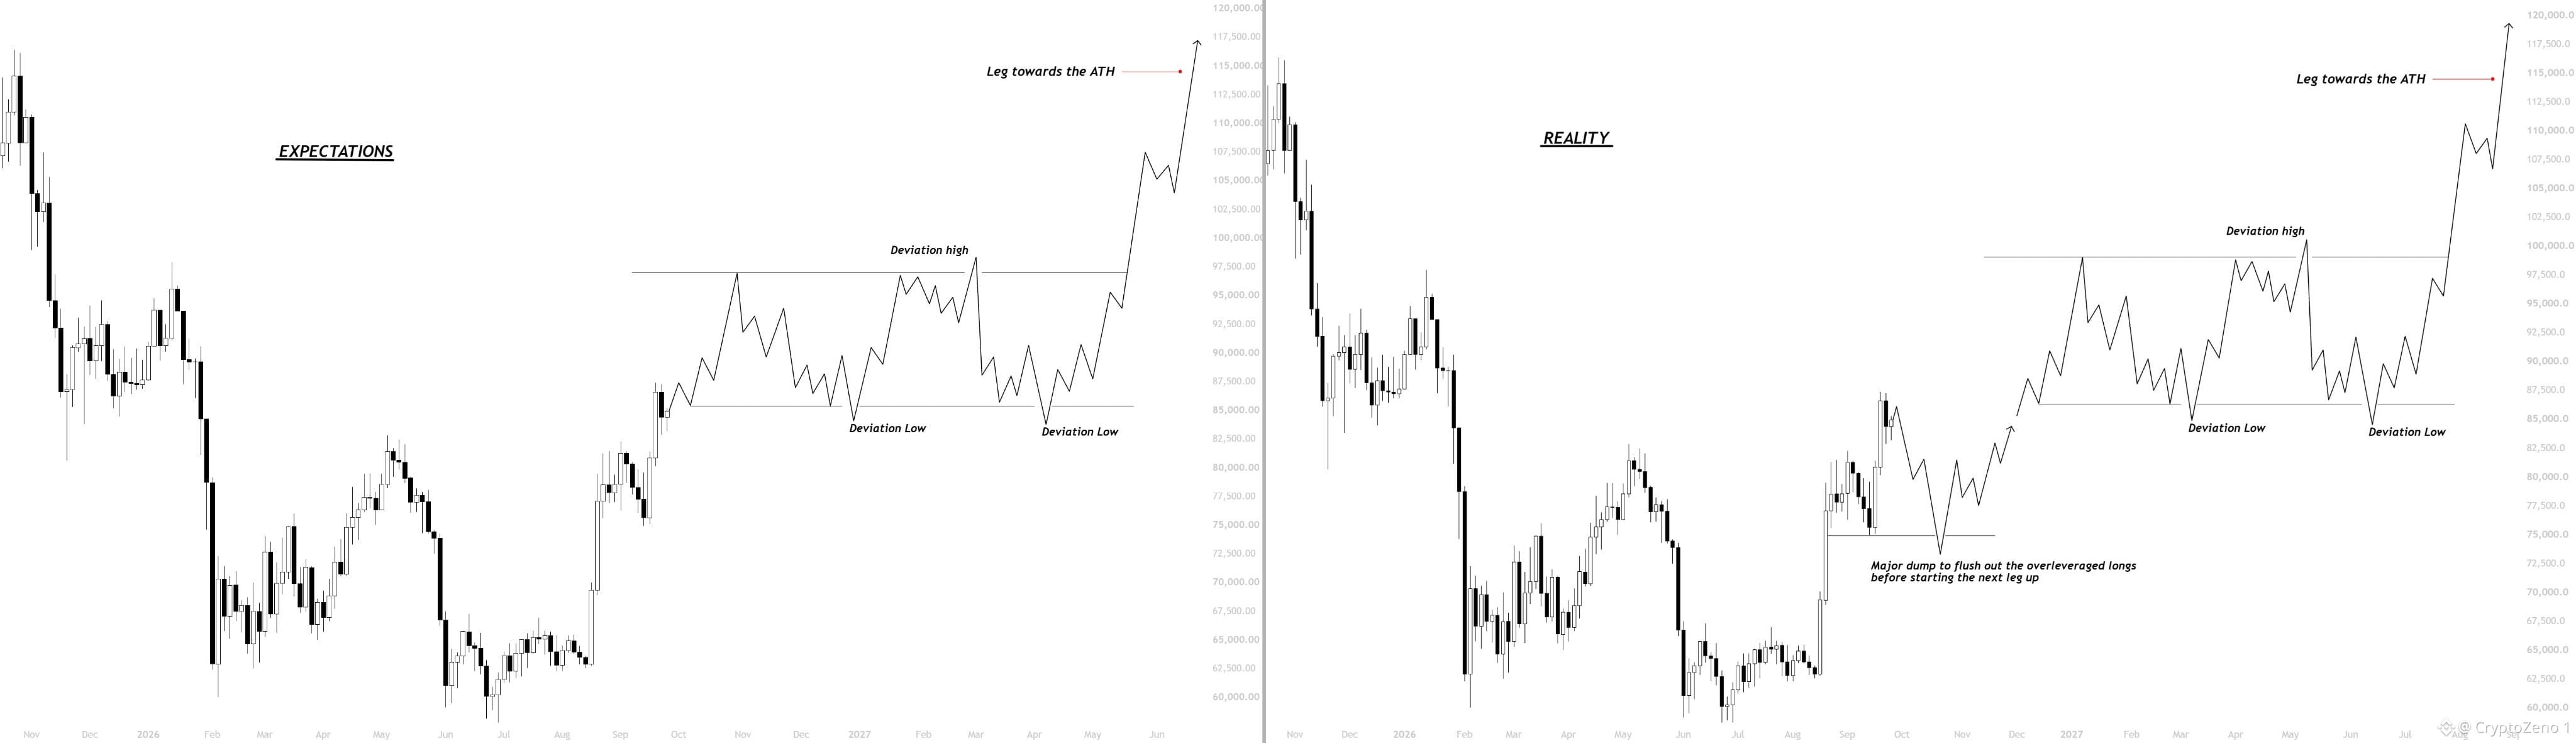
$BTC 価格が83kを上抜け、今や誰もが押し目なしで100kを狙っている。
一帯のCTは、まず巨大な蓄積(アキュムレーション)レンジを直接形成し、その後ATHへ向けて次のレグ(上昇局面)に入ることを想定している。
しかし、またしても言うように、これらの市場では大多数の計画どおりに物事が進むことはない。
そして特に、足元の高値をめぐって見えているこのFOMO(恐怖の買い遅れ)によって、現実は当然まったく別のものになるだろう。
私はまず、過剰なレバレッジ/FOMOでロングしている層を、75kまでの下落で一度フラッシュ(清算)するはずだと見ている。
その後、次の上昇レグとして95-100kへ到達し、そこで巨大な蓄積レンジを形成してからATHへ向かう。
全体として、75kまでのフラッシュが起きるまで、私の見方(バイアス)は依然として弱気だ。 #BTC Price Analysis# #Macro Insights#
$BTC 価格が83kを上抜け、今や誰もが押し目なしで100kを狙っている。
一帯のCTは、まず巨大な蓄積(アキュムレーション)レンジを直接形成し、その後ATHへ向けて次のレグ(上昇局面)に入ることを想定している。
しかし、またしても言うように、これらの市場では大多数の計画どおりに物事が進むことはない。
そして特に、足元の高値をめぐって見えているこのFOMO(恐怖の買い遅れ)によって、現実は当然まったく別のものになるだろう。
私はまず、過剰なレバレッジ/FOMOでロングしている層を、75kまでの下落で一度フラッシュ(清算)するはずだと見ている。
その後、次の上昇レグとして95-100kへ到達し、そこで巨大な蓄積レンジを形成してからATHへ向かう。
全体として、75kまでのフラッシュが起きるまで、私の見方(バイアス)は依然として弱気だ。 #BTC Price Analysis# #Macro Insights#
一帯のCTは、まず巨大な蓄積(アキュムレーション)レンジを直接形成し、その後ATHへ向けて次のレグ(上昇局面)に入ることを想定している。
しかし、またしても言うように、これらの市場では大多数の計画どおりに物事が進むことはない。
そして特に、足元の高値をめぐって見えているこのFOMO(恐怖の買い遅れ)によって、現実は当然まったく別のものになるだろう。
私はまず、過剰なレバレッジ/FOMOでロングしている層を、75kまでの下落で一度フラッシュ(清算)するはずだと見ている。
その後、次の上昇レグとして95-100kへ到達し、そこで巨大な蓄積レンジを形成してからATHへ向かう。
全体として、75kまでのフラッシュが起きるまで、私の見方(バイアス)は依然として弱気だ。 #BTC Price Analysis# #Macro Insights#
78
·
--
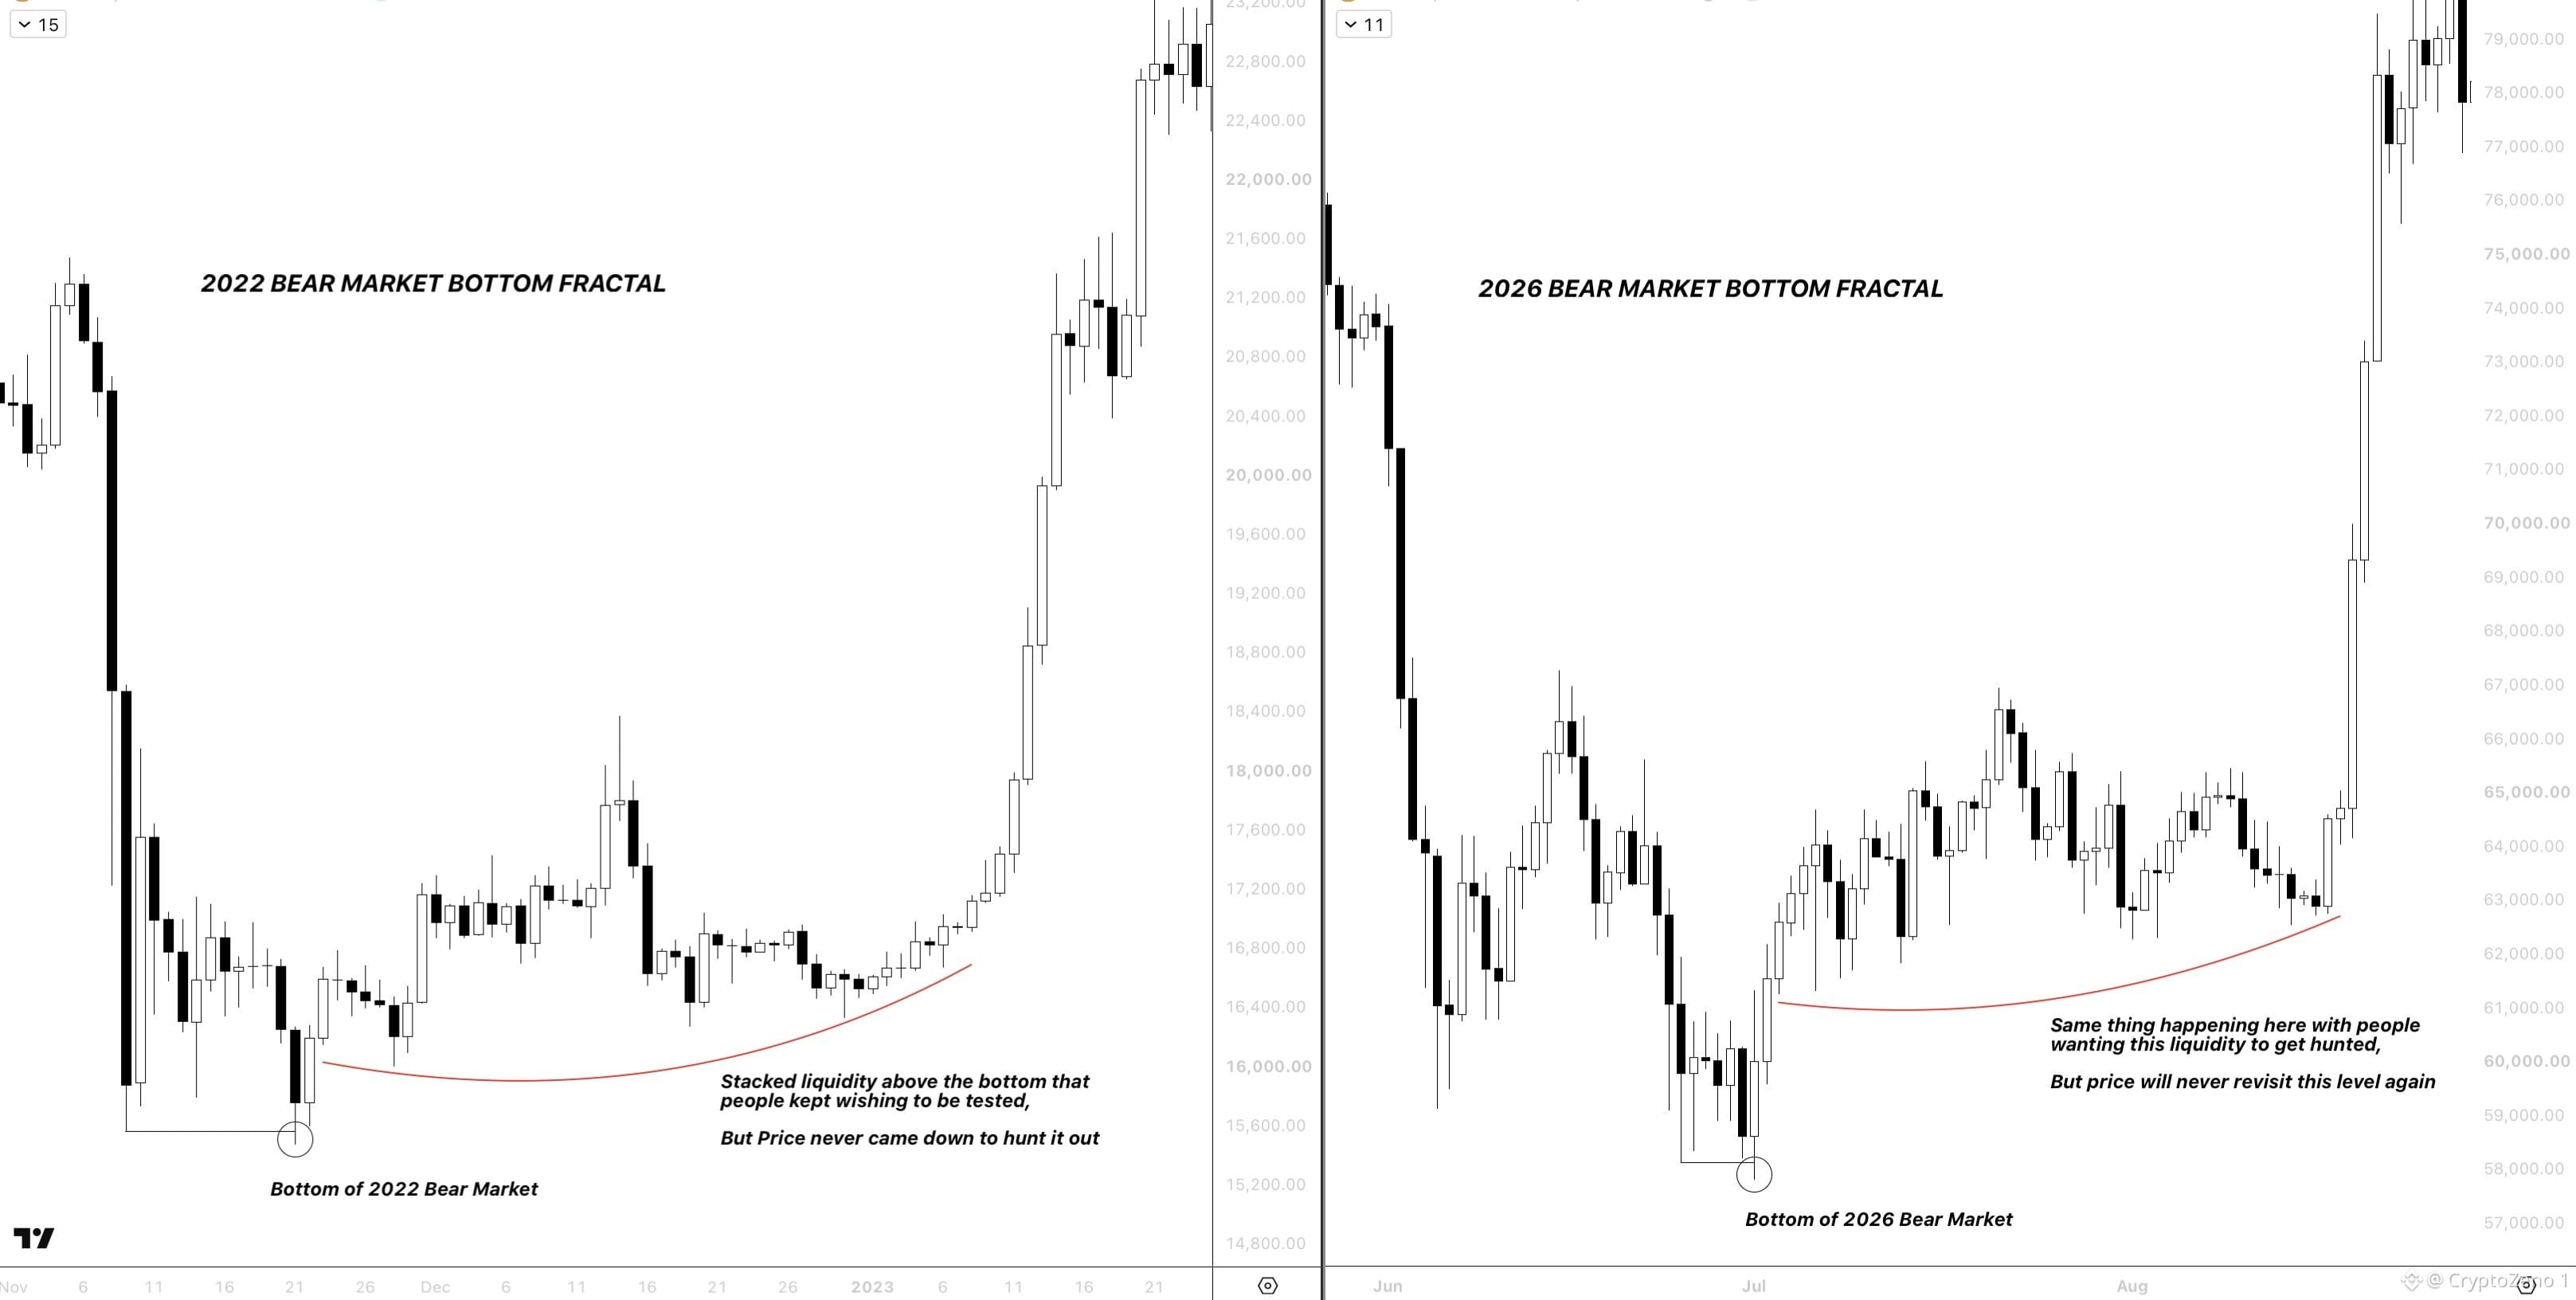
$BTC ここから、価格がもう一段低い安値を作らないと考える理由
多くの人が、60年代のあたりに積み上がっている巨大な流動性のクラスターを狙っています。
しかし、今回のベア相場の底の構造を、前回のベア相場の底の構造と比べてみると、
とてもよく似た底固めの構造を形成しており、そこにも未回収(未スイープ)の安値が積み上がっていました。つまり、そこにも流動性が積まれていたということです。
ですが今回もまた、価格はそれらの水準に戻ってスイープすることはなく、大きなフラッシュの後、そのまま上方向へ続きました。
結論としては、あなたたちがサイドラインにいるからという理由だけで新たな安値を望んでいるなら、それは得られないということです。
だから、来ない水準を待つよりも、次の大きな押し目を待ってそこで追加してください。まだ上昇の全走程が残っています。 #BTC 価格分析# #マクロ洞察#
$BTC ここから、価格がもう一段低い安値を作らないと考える理由
多くの人が、60年代のあたりに積み上がっている巨大な流動性のクラスターを狙っています。
しかし、今回のベア相場の底の構造を、前回のベア相場の底の構造と比べてみると、
とてもよく似た底固めの構造を形成しており、そこにも未回収(未スイープ)の安値が積み上がっていました。つまり、そこにも流動性が積まれていたということです。
ですが今回もまた、価格はそれらの水準に戻ってスイープすることはなく、大きなフラッシュの後、そのまま上方向へ続きました。
結論としては、あなたたちがサイドラインにいるからという理由だけで新たな安値を望んでいるなら、それは得られないということです。
だから、来ない水準を待つよりも、次の大きな押し目を待ってそこで追加してください。まだ上昇の全走程が残っています。 #BTC 価格分析# #マクロ洞察#
多くの人が、60年代のあたりに積み上がっている巨大な流動性のクラスターを狙っています。
しかし、今回のベア相場の底の構造を、前回のベア相場の底の構造と比べてみると、
とてもよく似た底固めの構造を形成しており、そこにも未回収(未スイープ)の安値が積み上がっていました。つまり、そこにも流動性が積まれていたということです。
ですが今回もまた、価格はそれらの水準に戻ってスイープすることはなく、大きなフラッシュの後、そのまま上方向へ続きました。
結論としては、あなたたちがサイドラインにいるからという理由だけで新たな安値を望んでいるなら、それは得られないということです。
だから、来ない水準を待つよりも、次の大きな押し目を待ってそこで追加してください。まだ上昇の全走程が残っています。 #BTC 価格分析# #マクロ洞察#
34
·
--
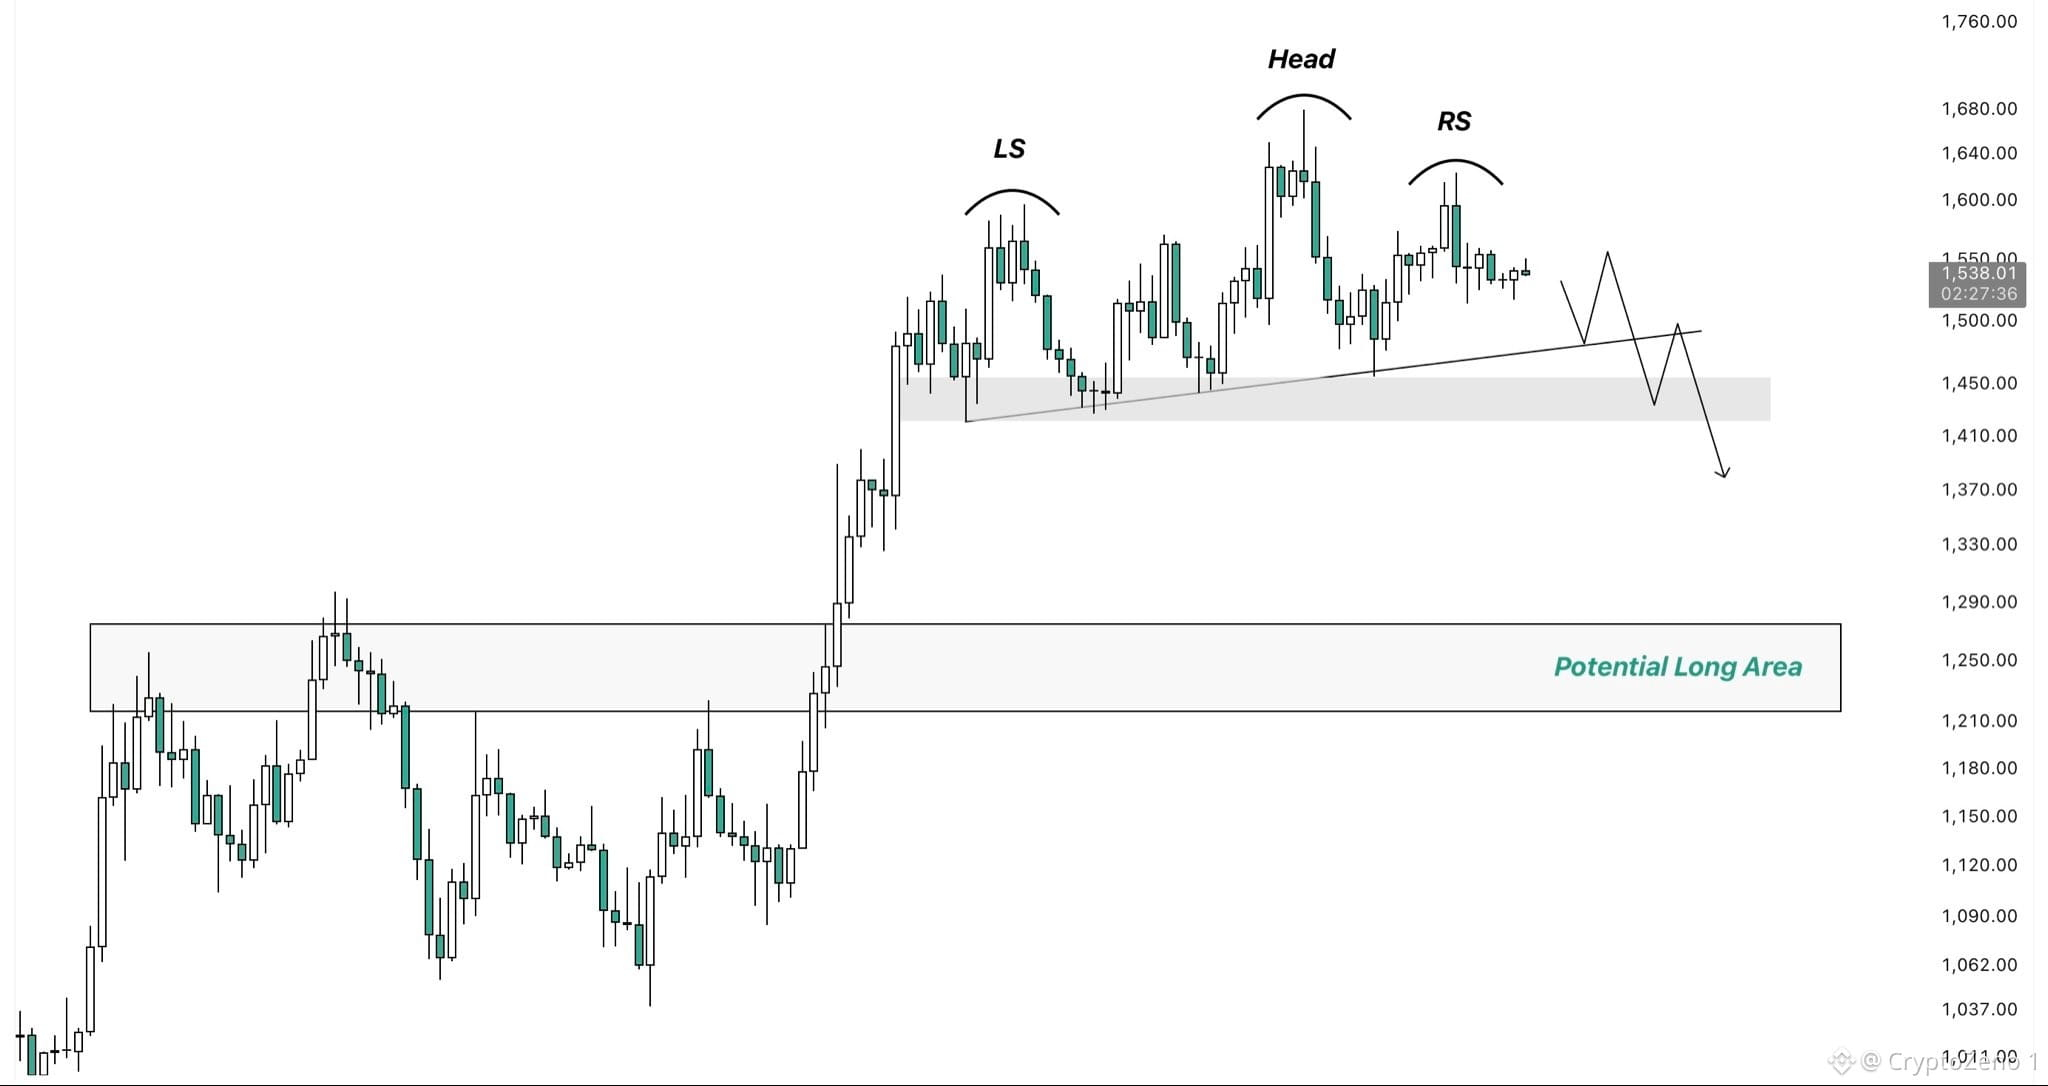
$ZEC
ここでショートの有望なセットアップが形成されつつあります。
現在、重要なサポートエリア直上で、かなりクリーンなヘッドアンドショルダーズの形を形成しているところです。
ネックライン/サポートを下抜けることが確認できたら、$1,200〜$1,300の領域をターゲットにしたショートを狙いたいと考えています。
この価格帯は、直近でブレイクアウトした直前のレンジの高値と一致しており、反応が出るかどうかを注目すべきポイントです。
そこを再テストできれば、次の上方向への拡大に向けた堅実なロングチャンスにつながる可能性があります。 #BTC Price Analysis# #Macro Insights#
$ZEC
ここでショートの有望なセットアップが形成されつつあります。
現在、重要なサポートエリア直上で、かなりクリーンなヘッドアンドショルダーズの形を形成しているところです。
ネックライン/サポートを下抜けることが確認できたら、$1,200〜$1,300の領域をターゲットにしたショートを狙いたいと考えています。
この価格帯は、直近でブレイクアウトした直前のレンジの高値と一致しており、反応が出るかどうかを注目すべきポイントです。
そこを再テストできれば、次の上方向への拡大に向けた堅実なロングチャンスにつながる可能性があります。 #BTC Price Analysis# #Macro Insights#
ここでショートの有望なセットアップが形成されつつあります。
現在、重要なサポートエリア直上で、かなりクリーンなヘッドアンドショルダーズの形を形成しているところです。
ネックライン/サポートを下抜けることが確認できたら、$1,200〜$1,300の領域をターゲットにしたショートを狙いたいと考えています。
この価格帯は、直近でブレイクアウトした直前のレンジの高値と一致しており、反応が出るかどうかを注目すべきポイントです。
そこを再テストできれば、次の上方向への拡大に向けた堅実なロングチャンスにつながる可能性があります。 #BTC Price Analysis# #Macro Insights#
37
·
--
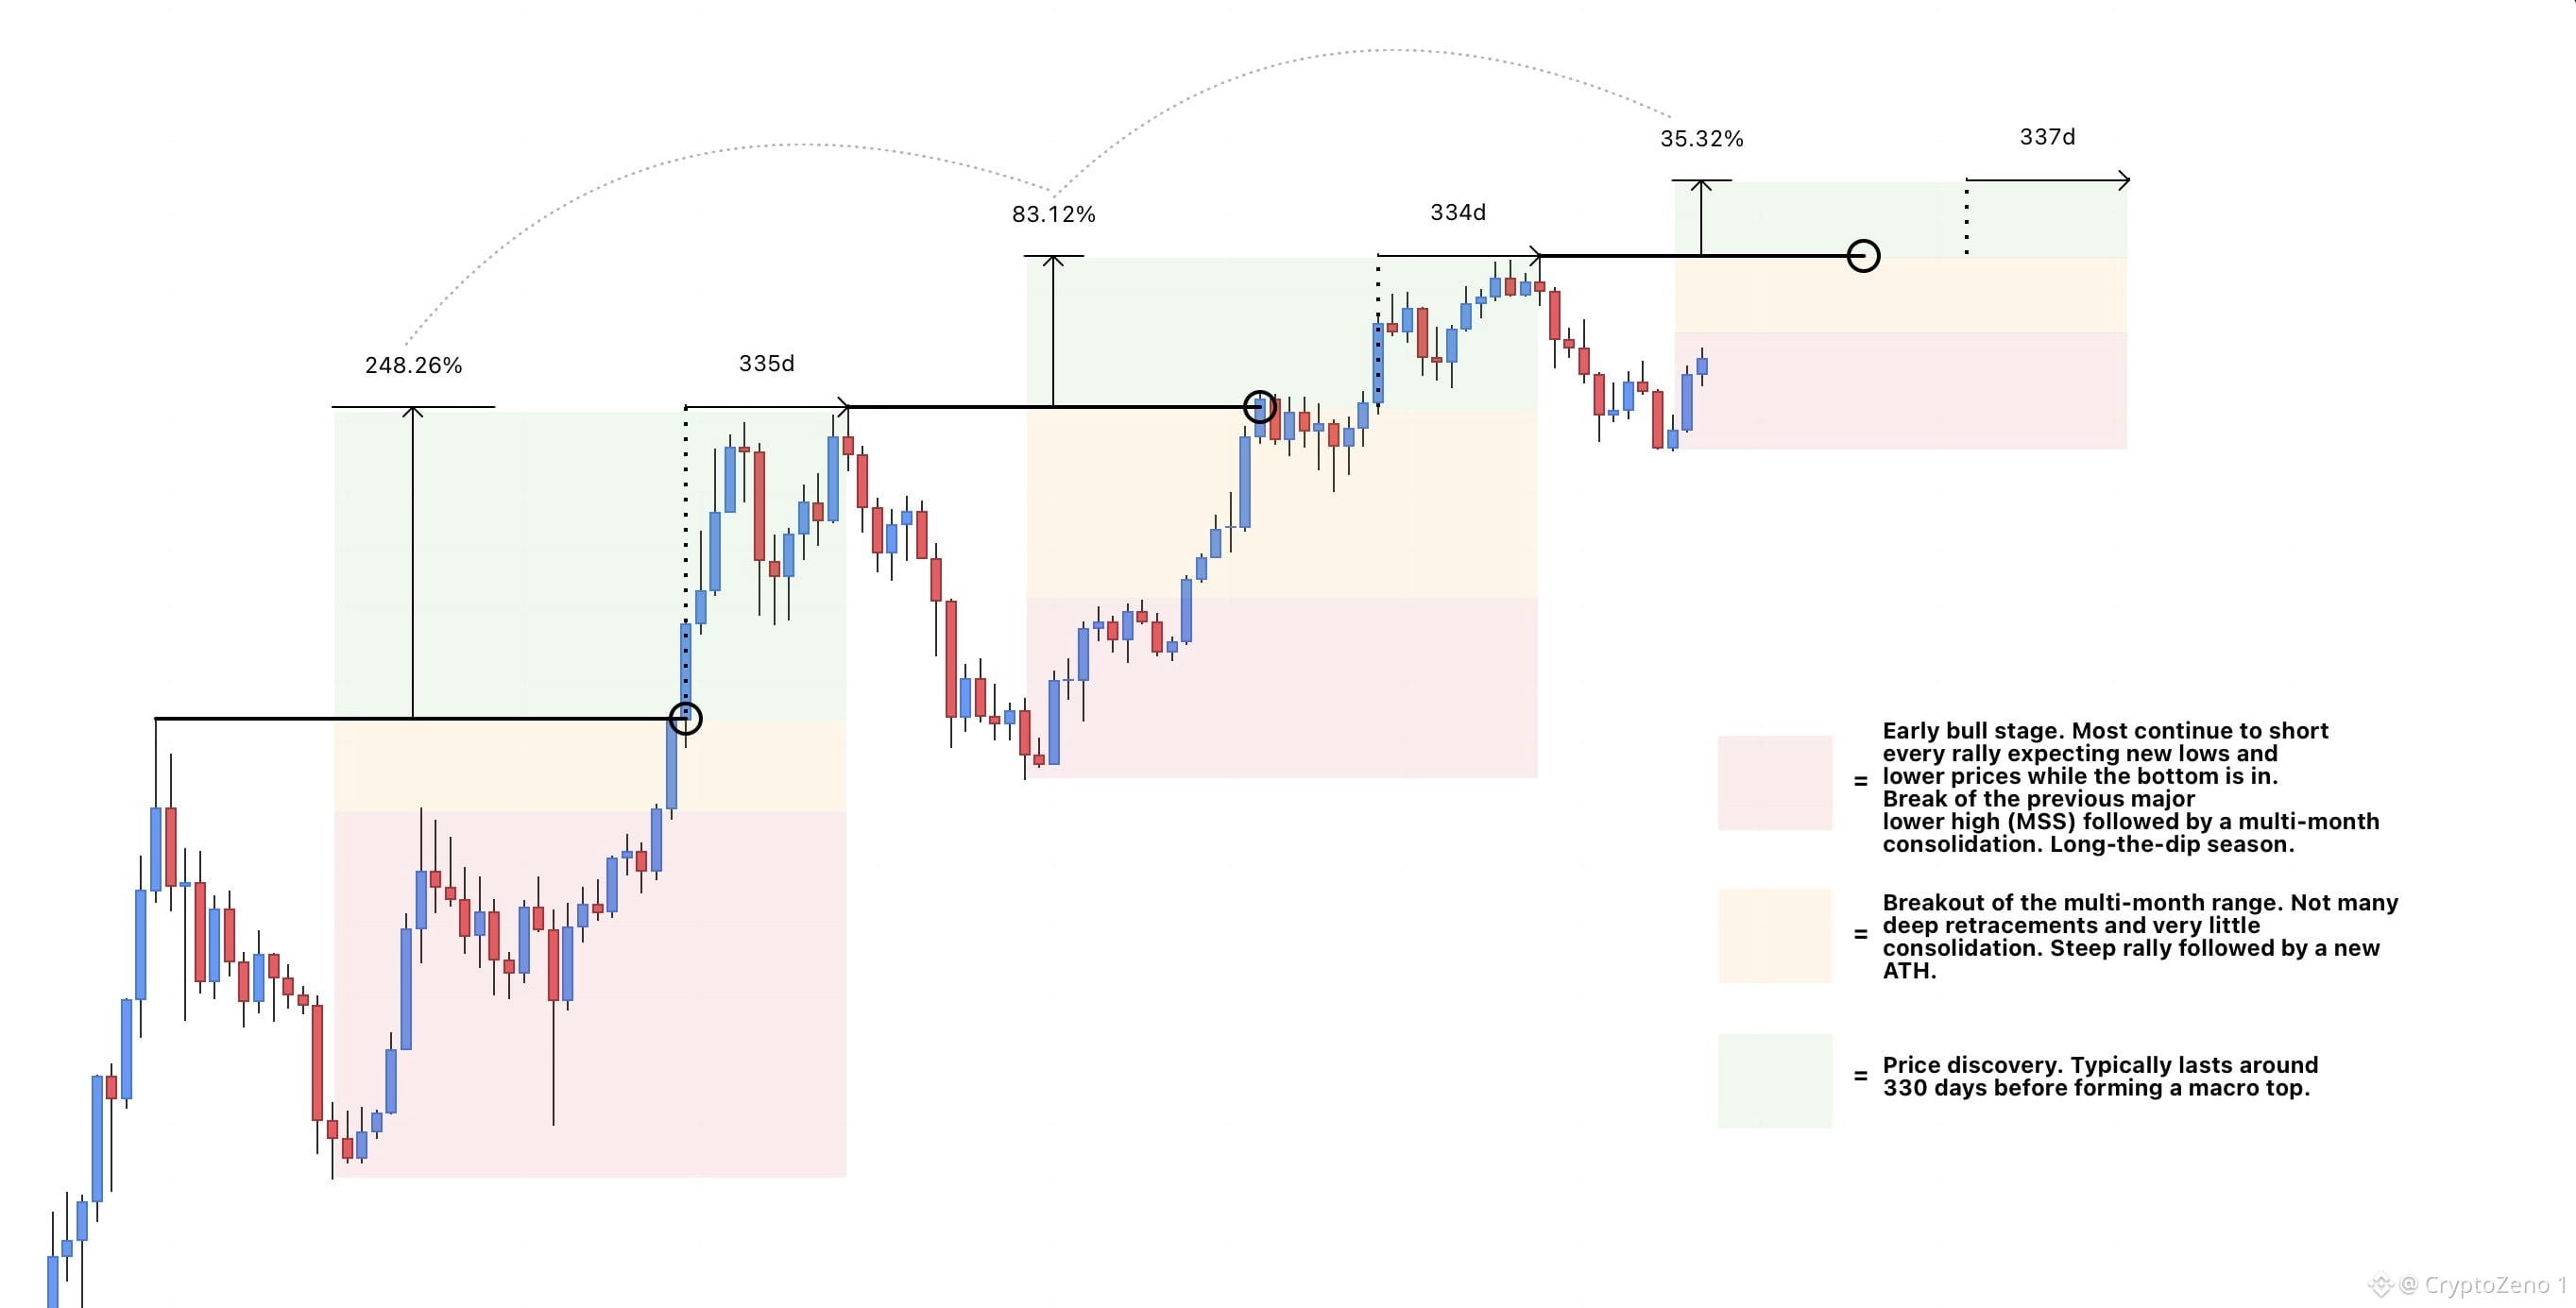
$BTC 後から見れば明らかになるよ...
これらの段階はすべて同じで、各サイクルを重ねるごとに進化していくだけ。
落ち込みを楽しんで、リバウンド(上昇)を味わおう。🎲 #BTC Price Analysis# #Macro Insights#
$BTC 後から見れば明らかになるよ...
これらの段階はすべて同じで、各サイクルを重ねるごとに進化していくだけ。
落ち込みを楽しんで、リバウンド(上昇)を味わおう。🎲 #BTC Price Analysis# #Macro Insights#
これらの段階はすべて同じで、各サイクルを重ねるごとに進化していくだけ。
落ち込みを楽しんで、リバウンド(上昇)を味わおう。🎲 #BTC Price Analysis# #Macro Insights#
63
·
--
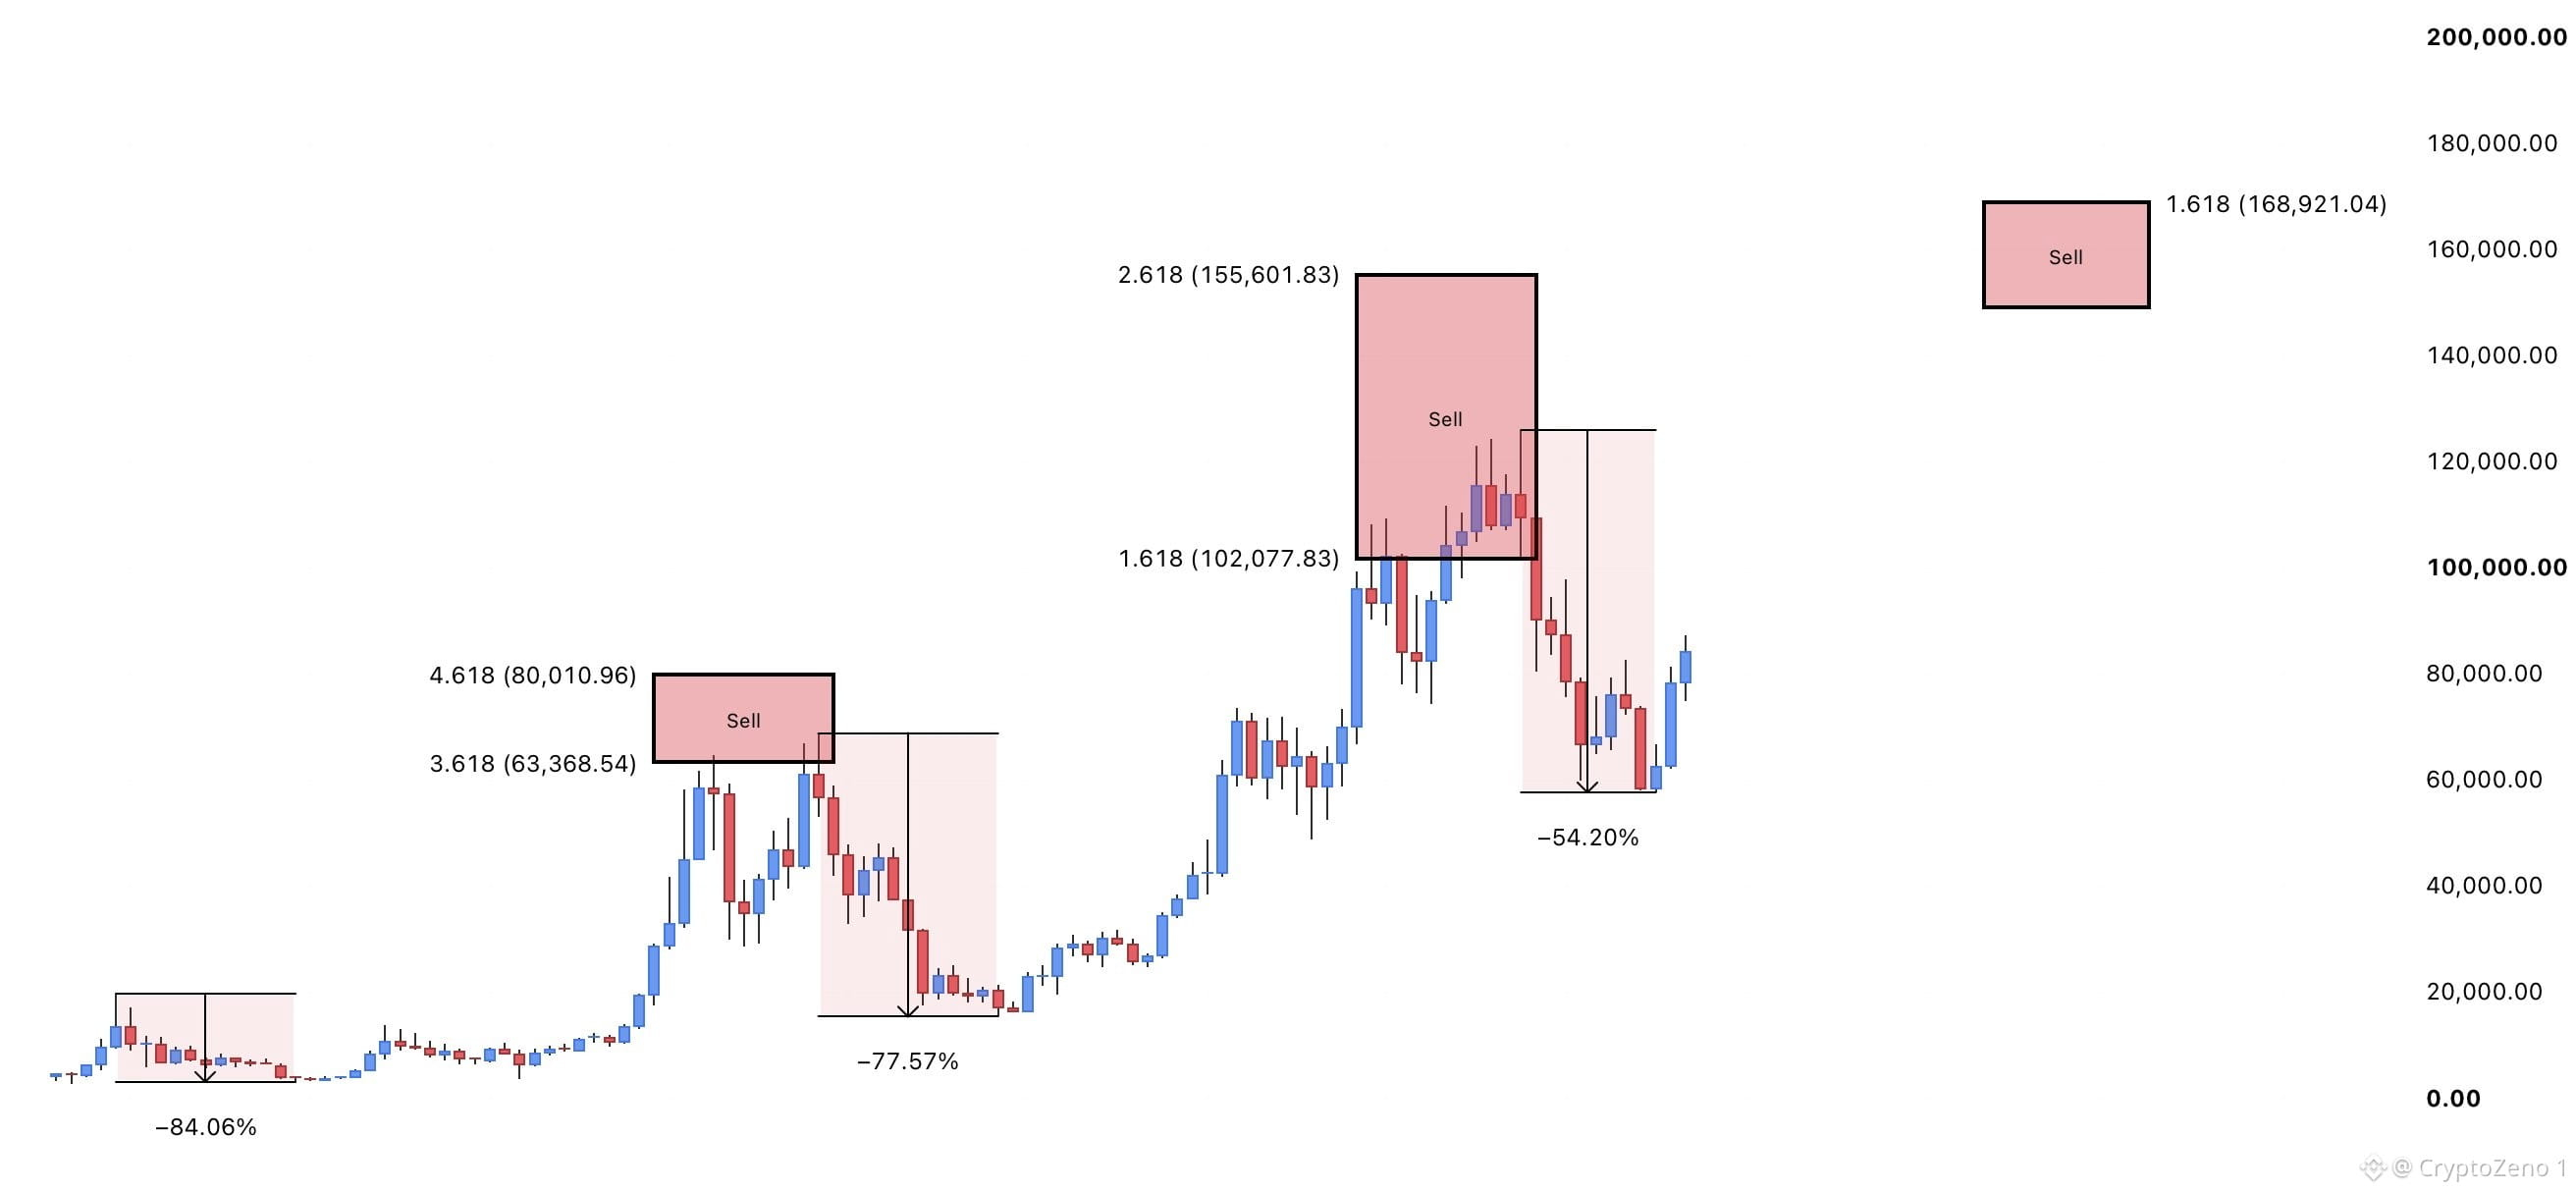
$BTC すべてのATH(史上最高値)は、前のものより浅くなってきており、最良の売りゾーンは異なる2つの .618フィボナッチ・エクステンションの間に一貫して形成されています。
直近の前回の強気相場では、2.618と1.618のエクステンションの間で天井を付けましたが、1.618の方にかなり近い位置でした。
今回のサイクルも同様の道筋をたどる可能性があります。
なぜ?
今回のサイクルと過去のものの主な違いは、弱気相場の底が約20〜30%浅かったことです。
つまり、1.618エクステンションに到達するために必要な上昇幅が大幅に少なくて済むということです。
価格が同じパターンを維持し続けるなら、1.618は最終的なマクロ天井にかなり近い位置に来るはずです。
さらに、各サイクルにおける逓減収益(ダミニッシング・リターンズ)の理論とも整合しており、$160Kの領域にもう一つの根拠(コンフルエンス)が加わります。
私が次のマクロ天井が形成されると見込んでいるのは、まさにそこです。 #BTC Price Analysis# #Macro Insights#
$BTC すべてのATH(史上最高値)は、前のものより浅くなってきており、最良の売りゾーンは異なる2つの .618フィボナッチ・エクステンションの間に一貫して形成されています。
直近の前回の強気相場では、2.618と1.618のエクステンションの間で天井を付けましたが、1.618の方にかなり近い位置でした。
今回のサイクルも同様の道筋をたどる可能性があります。
なぜ?
今回のサイクルと過去のものの主な違いは、弱気相場の底が約20〜30%浅かったことです。
つまり、1.618エクステンションに到達するために必要な上昇幅が大幅に少なくて済むということです。
価格が同じパターンを維持し続けるなら、1.618は最終的なマクロ天井にかなり近い位置に来るはずです。
さらに、各サイクルにおける逓減収益(ダミニッシング・リターンズ)の理論とも整合しており、$160Kの領域にもう一つの根拠(コンフルエンス)が加わります。
私が次のマクロ天井が形成されると見込んでいるのは、まさにそこです。 #BTC Price Analysis# #Macro Insights#
直近の前回の強気相場では、2.618と1.618のエクステンションの間で天井を付けましたが、1.618の方にかなり近い位置でした。
今回のサイクルも同様の道筋をたどる可能性があります。
なぜ?
今回のサイクルと過去のものの主な違いは、弱気相場の底が約20〜30%浅かったことです。
つまり、1.618エクステンションに到達するために必要な上昇幅が大幅に少なくて済むということです。
価格が同じパターンを維持し続けるなら、1.618は最終的なマクロ天井にかなり近い位置に来るはずです。
さらに、各サイクルにおける逓減収益(ダミニッシング・リターンズ)の理論とも整合しており、$160Kの領域にもう一つの根拠(コンフルエンス)が加わります。
私が次のマクロ天井が形成されると見込んでいるのは、まさにそこです。 #BTC Price Analysis# #Macro Insights#
43
·
--
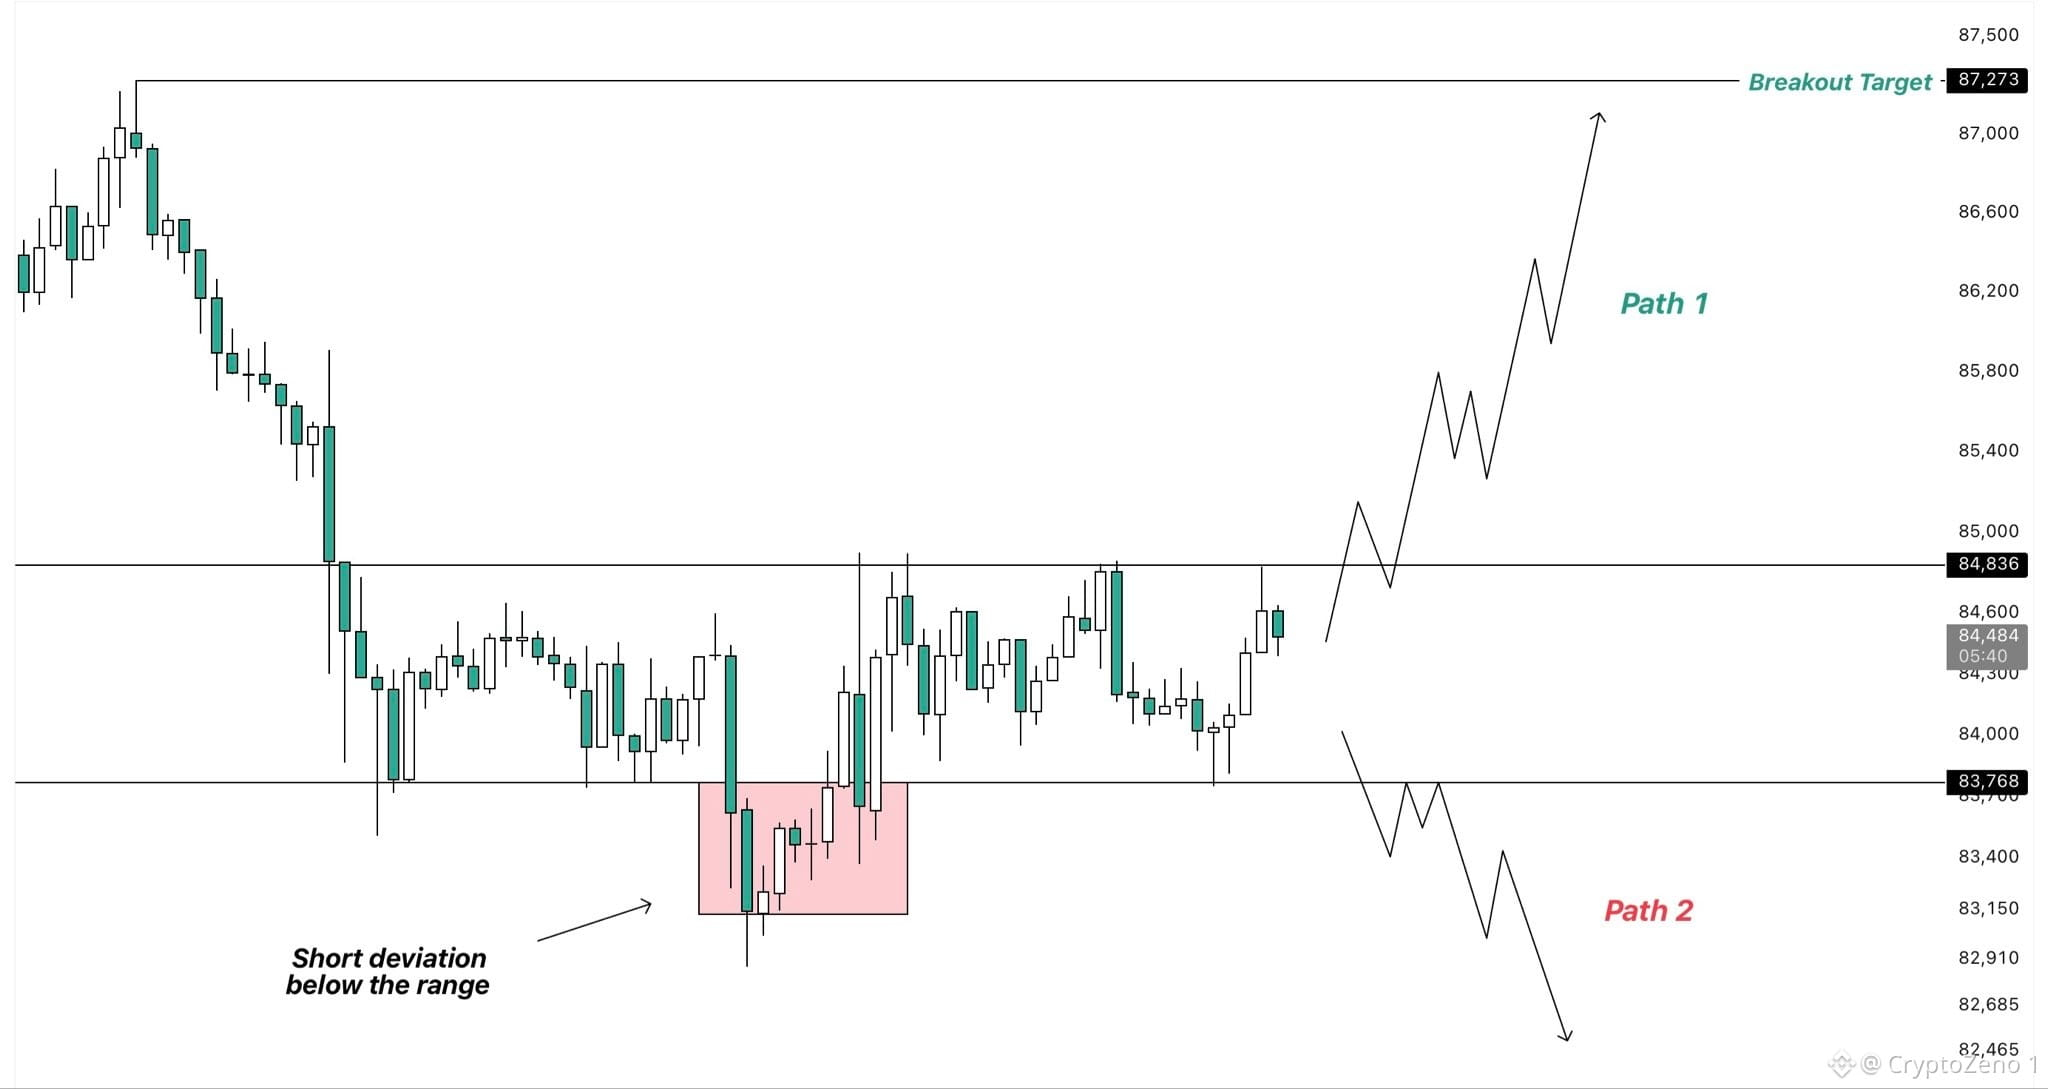
$BTC は現在、この狭い LTF レンジ内で圧縮しています。
ここから今日はもう少しの調整(揉み合い)が続く可能性があり、その場合は週末にかけても継続する見込みです。
それとも価格がブレイクして、2つの方向のいずれかで決定的な動きが見られるでしょう。
BTC がより長く整理(レンジでの統合)を続けるほど、最終的なブレイクはより決定的になる可能性が高まります。つまり、その場合は来週に向けてさらに鋭い値動きが見られるかもしれません。
高値を上抜けると、ローカル高値である約 $87K 付近へ再び向かい、さらなる上昇の確率が高まります。
一方で、下落(ブレイクダウン)なら、価格は下がって過去の上位時間軸(HTF)の高値を再確認しに行き、場合によっては $80k–$82k のゾーンまで伸びる可能性があります。
ブレイクダウンは、こちらの方が私が現在より注目しているシナリオです。これが起きれば、私の最初のロングシナリオが発動します。
もし BTC が代わりに上方向へブレイクするなら、その場合は私はポジションをフラットのままにして、次の良い機会が来るのを待ちます。 #BTC 価格分析# #マクロ洞察#
$BTC は現在、この狭い LTF レンジ内で圧縮しています。
ここから今日はもう少しの調整(揉み合い)が続く可能性があり、その場合は週末にかけても継続する見込みです。
それとも価格がブレイクして、2つの方向のいずれかで決定的な動きが見られるでしょう。
BTC がより長く整理(レンジでの統合)を続けるほど、最終的なブレイクはより決定的になる可能性が高まります。つまり、その場合は来週に向けてさらに鋭い値動きが見られるかもしれません。
高値を上抜けると、ローカル高値である約 $87K 付近へ再び向かい、さらなる上昇の確率が高まります。
一方で、下落(ブレイクダウン)なら、価格は下がって過去の上位時間軸(HTF)の高値を再確認しに行き、場合によっては $80k–$82k のゾーンまで伸びる可能性があります。
ブレイクダウンは、こちらの方が私が現在より注目しているシナリオです。これが起きれば、私の最初のロングシナリオが発動します。
もし BTC が代わりに上方向へブレイクするなら、その場合は私はポジションをフラットのままにして、次の良い機会が来るのを待ちます。 #BTC 価格分析# #マクロ洞察#
ここから今日はもう少しの調整(揉み合い)が続く可能性があり、その場合は週末にかけても継続する見込みです。
それとも価格がブレイクして、2つの方向のいずれかで決定的な動きが見られるでしょう。
BTC がより長く整理(レンジでの統合)を続けるほど、最終的なブレイクはより決定的になる可能性が高まります。つまり、その場合は来週に向けてさらに鋭い値動きが見られるかもしれません。
高値を上抜けると、ローカル高値である約 $87K 付近へ再び向かい、さらなる上昇の確率が高まります。
一方で、下落(ブレイクダウン)なら、価格は下がって過去の上位時間軸(HTF)の高値を再確認しに行き、場合によっては $80k–$82k のゾーンまで伸びる可能性があります。
ブレイクダウンは、こちらの方が私が現在より注目しているシナリオです。これが起きれば、私の最初のロングシナリオが発動します。
もし BTC が代わりに上方向へブレイクするなら、その場合は私はポジションをフラットのままにして、次の良い機会が来るのを待ちます。 #BTC 価格分析# #マクロ洞察#
57
ログインして、さらにコンテンツを読む
厳選トピックで世界の暗号資産トレーダーの仲間入り
⚡️ 暗号資産に関する最新かつ有益な情報が見つかります。
💬 世界最大の暗号資産取引所から信頼されています。
👍 認証を受けたクリエイターから、有益なインサイトを得られます。
メール / 電話番号
トレンドトピック
BinanceLaunchesBinanceIntelligence
閲覧回数 313,626
2,650人が討論中
#BinanceLaunchesBinanceIntelligence
BINANCE INTELLIGENCEが登場。🧠
最も注目すべき点は、Binanceが単にAIを取り入れたということではありません。
市場を分析するだけの技術から、ユーザーが戦略を実際のアクションに移せるよう支援する技術へと進化したことです。
Binance Intelligenceには、以下が含まれます。
🧠 Binance AI:市場に関するパーソナライズされたインサイトを生成
⚡ Binance AI Pro:アイデアをトレーディングのワークフローに変換
🤖 Agent OS:開発者が金融インテリジェンスに特化したエージェントを構築
私の見解では、この進化によって、ユーザーが取引所と関わる方法が変わる可能性があります。
次世代のトレーディングは、もはや「何を買えばいい?」から始まるのではないかもしれません。
それよりも、「これが私の戦略です。実行してください。」から始まるのではないでしょうか。
$BNB
Investidor gifted person AH SD
·いいね:0件
·閲覧回数 401
BitcoinTargets2026OpenAt$87570
閲覧回数 945
46人が討論中
BitcoinRejectedAt$87KThirdTime
閲覧回数 1,145
45人が討論中