

produmanni 1
39 投稿

produmanni 1
報告
ユーザーをブロック
derivative journey | founder, creator, trader
0 フォロー
0 フォロワー
0 いいね
投稿
·
--
恐怖と欲望は、ただの指標や取引の原始的なものではありません。人生のあらゆる場面における意思決定の基盤そのものです。
意思決定は必ず、恐怖と欲望の間のどこかの線上で行われます。
欲望が勝てば、恐怖は後ろに押しやられます。たとえば、チップを1ドルもらったメイドは次回ももっともらえるはずだと期待する一方で、清掃の質は同じか、それどころかもっと悪くなるかもしれません。逆に恐怖が主導権を握れば、どれほど論理的でも、脳が本来すべき大胆な一手をするのを助けられません。だからこそ、あなたが買った期限切れの商品は、公共の場での面倒を恐れて返品せず、そのままゴミ箱に捨てられてしまうのです。社会の作法、いったいどうすればいいのでしょう。
恐怖と欲望は、ただの指標や取引の原始的なものではありません。人生のあらゆる場面における意思決定の基盤そのものです。
意思決定は必ず、恐怖と欲望の間のどこかの線上で行われます。
欲望が勝てば、恐怖は後ろに押しやられます。たとえば、チップを1ドルもらったメイドは次回ももっともらえるはずだと期待する一方で、清掃の質は同じか、それどころかもっと悪くなるかもしれません。逆に恐怖が主導権を握れば、どれほど論理的でも、脳が本来すべき大胆な一手をするのを助けられません。だからこそ、あなたが買った期限切れの商品は、公共の場での面倒を恐れて返品せず、そのままゴミ箱に捨てられてしまうのです。社会の作法、いったいどうすればいいのでしょう。
意思決定は必ず、恐怖と欲望の間のどこかの線上で行われます。
欲望が勝てば、恐怖は後ろに押しやられます。たとえば、チップを1ドルもらったメイドは次回ももっともらえるはずだと期待する一方で、清掃の質は同じか、それどころかもっと悪くなるかもしれません。逆に恐怖が主導権を握れば、どれほど論理的でも、脳が本来すべき大胆な一手をするのを助けられません。だからこそ、あなたが買った期限切れの商品は、公共の場での面倒を恐れて返品せず、そのままゴミ箱に捨てられてしまうのです。社会の作法、いったいどうすればいいのでしょう。

57
·
--
BTC 週次レビュー | トレーディングプラン
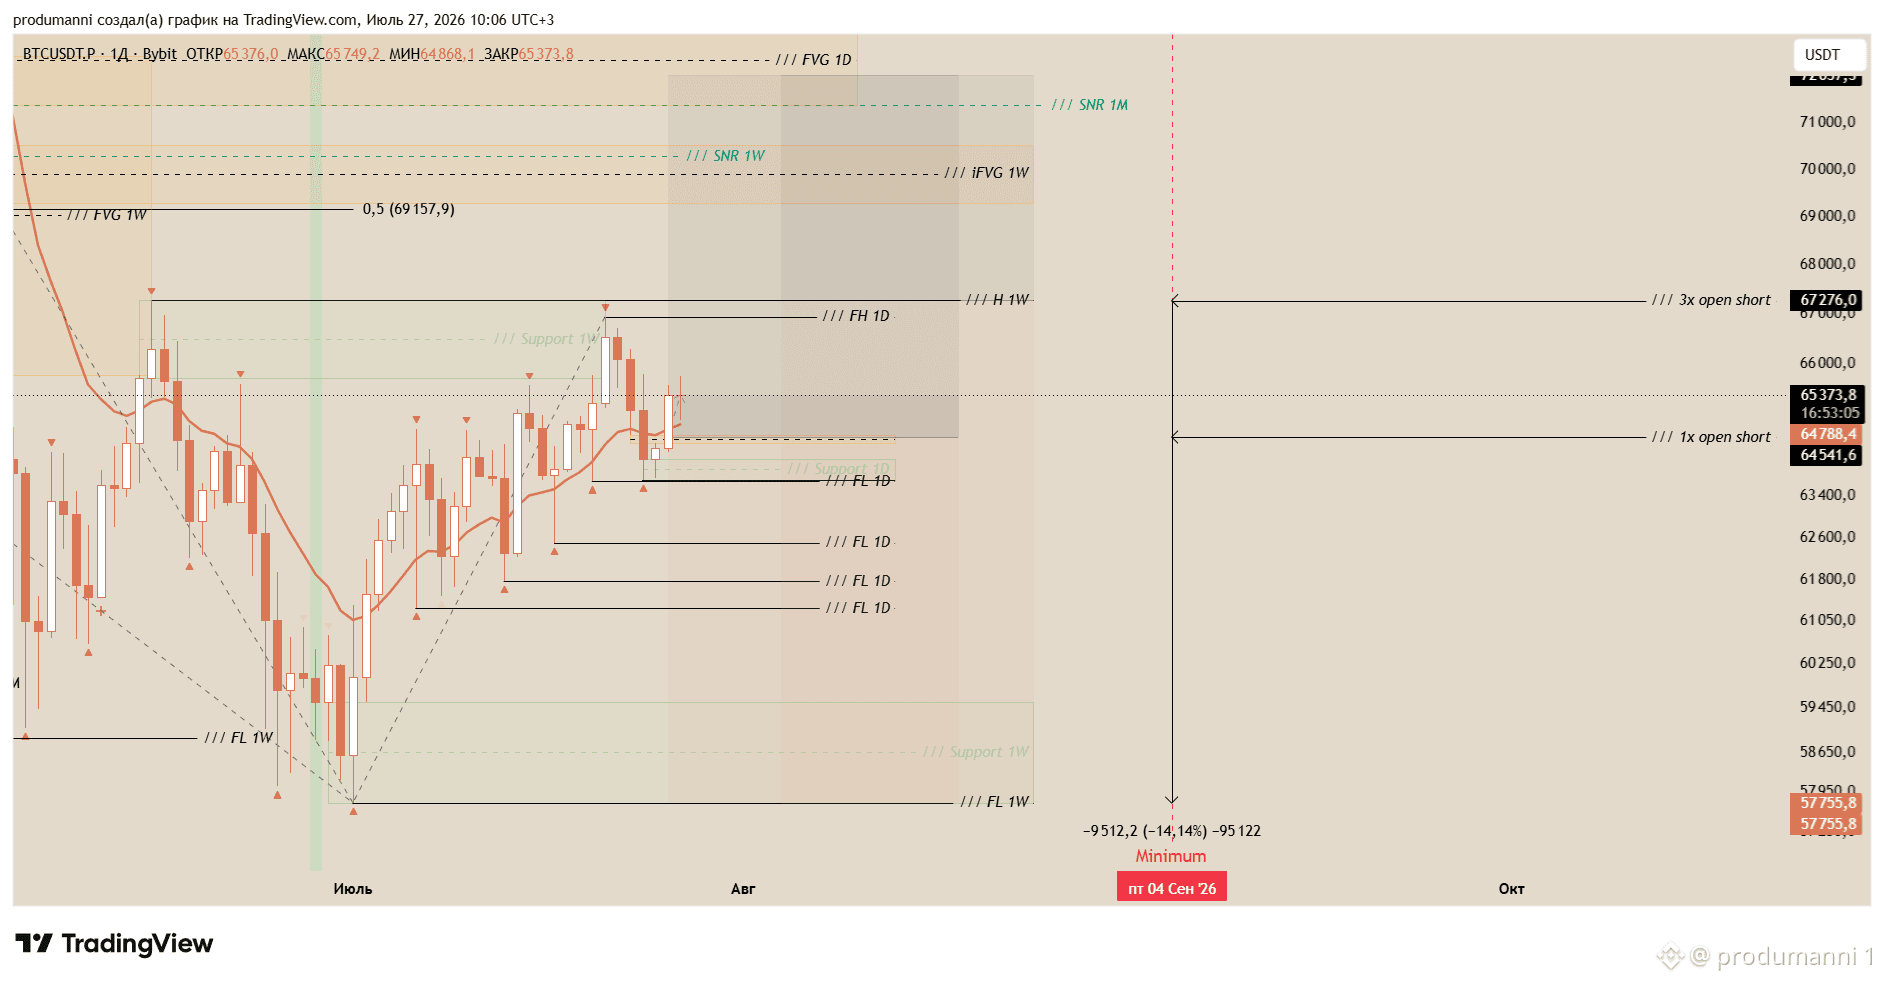
図は変わっておらず、これは前回レビューでのトレード案への追加のようなものです ↓
先ほど私が、週次の要素として優先度を下げたと印をつけた RB は、一時的な反応は示しました。それが 1D VC が生まれた理由です ↓
私は 1x のリスクでアンチFOMOのショートを建てましたが、ストップロスはかなり遠くに置きました。そのためトレードの RR はマイナスです。つまり「より多くを賭けて、より少なく得る」形です。それでもショートの上限は $67,278 に維持しており、通常のリスクの x3 で、メイントレードの考え方に沿っています。
週次 RB($65,710 - $67,276)からの反応があり、そこで VC が入った後、多くの主要取引所で 1D の価格はデイリー・フラクタルをクローズしました。その他の取引所では、ほぼ同じところに安値が設定されました。私はこれをローカルな再燃と、EQL(Equal Lows:イコール・ロー)=同値の安値が形成されたこととして読みました。その後、新たに形成された 1D FVG($64,422 - $64,581)—これも VC ですが—は、昨日のローソク足(出来高デルタがプラス)によって反転させられました。これは 1D の強気 VC を示しており、メイン目標である $67,276 へ向かうストーリーにつながります。私が使っている主要な指標のいくつかも、ローカルな上昇の継続の可能性を後押ししています。
ローカル安値の $57,775 がついてからは、1W の VC は入ってきていません。これは、HTF(上位足)の弱気シナリオがまだ生きていることを意味します。そして、この月次の逆張り移動は、(ちなみに)すでに 5 つ目のフラクタル深さまで到達している、流動性のカスケードを組み立てているだけです。ここに“何も理由なく”仕込んでいるわけではありません。アルゴリズムが作物を刈り取る時は、そのうち来ます。
BTC 週次レビュー | トレーディングプラン
図は変わっておらず、これは前回レビューでのトレード案への追加のようなものです ↓
先ほど私が、週次の要素として優先度を下げたと印をつけた RB は、一時的な反応は示しました。それが 1D VC が生まれた理由です ↓
私は 1x のリスクでアンチFOMOのショートを建てましたが、ストップロスはかなり遠くに置きました。そのためトレードの RR はマイナスです。つまり「より多くを賭けて、より少なく得る」形です。それでもショートの上限は $67,278 に維持しており、通常のリスクの x3 で、メイントレードの考え方に沿っています。
週次 RB($65,710 - $67,276)からの反応があり、そこで VC が入った後、多くの主要取引所で 1D の価格はデイリー・フラクタルをクローズしました。その他の取引所では、ほぼ同じところに安値が設定されました。私はこれをローカルな再燃と、EQL(Equal Lows:イコール・ロー)=同値の安値が形成されたこととして読みました。その後、新たに形成された 1D FVG($64,422 - $64,581)—これも VC ですが—は、昨日のローソク足(出来高デルタがプラス)によって反転させられました。これは 1D の強気 VC を示しており、メイン目標である $67,276 へ向かうストーリーにつながります。私が使っている主要な指標のいくつかも、ローカルな上昇の継続の可能性を後押ししています。
ローカル安値の $57,775 がついてからは、1W の VC は入ってきていません。これは、HTF(上位足)の弱気シナリオがまだ生きていることを意味します。そして、この月次の逆張り移動は、(ちなみに)すでに 5 つ目のフラクタル深さまで到達している、流動性のカスケードを組み立てているだけです。ここに“何も理由なく”仕込んでいるわけではありません。アルゴリズムが作物を刈り取る時は、そのうち来ます。
図は変わっておらず、これは前回レビューでのトレード案への追加のようなものです ↓
先ほど私が、週次の要素として優先度を下げたと印をつけた RB は、一時的な反応は示しました。それが 1D VC が生まれた理由です ↓
私は 1x のリスクでアンチFOMOのショートを建てましたが、ストップロスはかなり遠くに置きました。そのためトレードの RR はマイナスです。つまり「より多くを賭けて、より少なく得る」形です。それでもショートの上限は $67,278 に維持しており、通常のリスクの x3 で、メイントレードの考え方に沿っています。
週次 RB($65,710 - $67,276)からの反応があり、そこで VC が入った後、多くの主要取引所で 1D の価格はデイリー・フラクタルをクローズしました。その他の取引所では、ほぼ同じところに安値が設定されました。私はこれをローカルな再燃と、EQL(Equal Lows:イコール・ロー)=同値の安値が形成されたこととして読みました。その後、新たに形成された 1D FVG($64,422 - $64,581)—これも VC ですが—は、昨日のローソク足(出来高デルタがプラス)によって反転させられました。これは 1D の強気 VC を示しており、メイン目標である $67,276 へ向かうストーリーにつながります。私が使っている主要な指標のいくつかも、ローカルな上昇の継続の可能性を後押ししています。
ローカル安値の $57,775 がついてからは、1W の VC は入ってきていません。これは、HTF(上位足)の弱気シナリオがまだ生きていることを意味します。そして、この月次の逆張り移動は、(ちなみに)すでに 5 つ目のフラクタル深さまで到達している、流動性のカスケードを組み立てているだけです。ここに“何も理由なく”仕込んでいるわけではありません。アルゴリズムが作物を刈り取る時は、そのうち来ます。
73
·
--
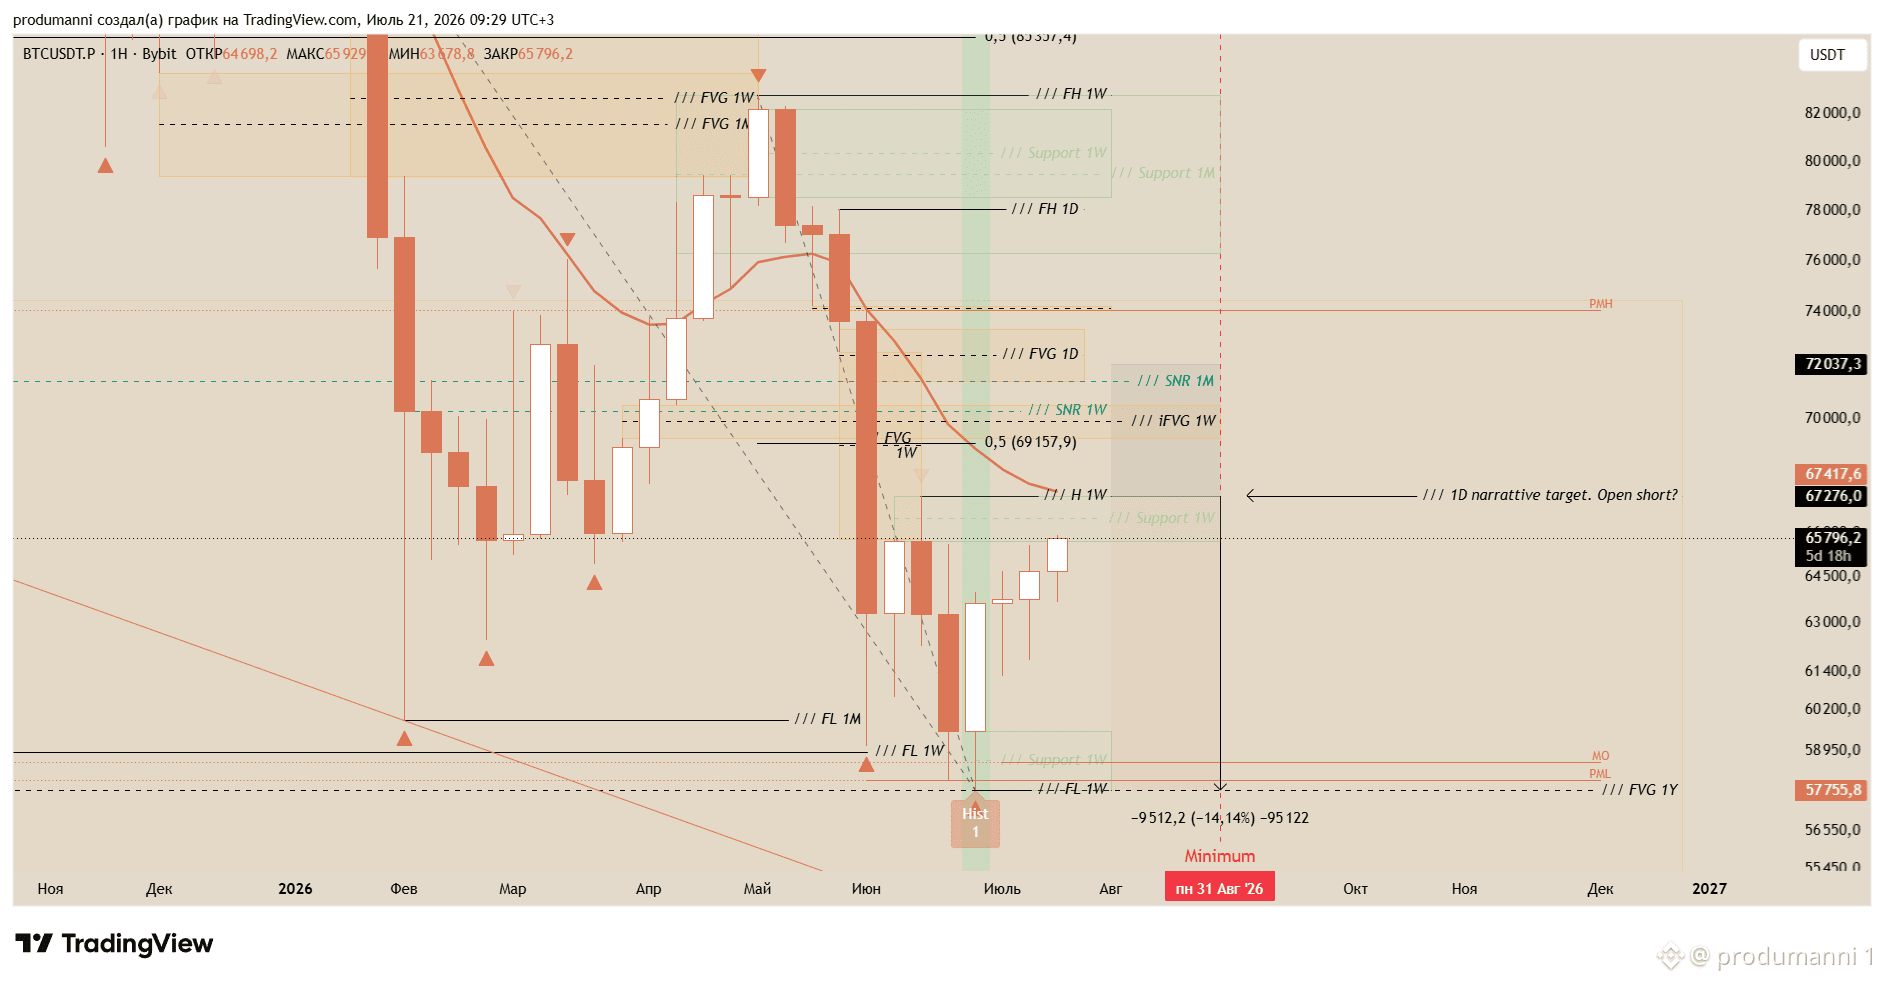
前回、見落としていた「監視しておく価値のある」週足の値動き要素を2つ挙げます。これは主要なものではありませんが、局所的にはよりクリアな絵を補ってくれます。
* RB 1W、$67,710 - $67,276 | このブロックは、価格が$72,460 - $65,770のFVGの下側で反応した後に形成され、その後、局所的な安値を作ったインパルスが始まりました。私が待っているのは、このRBの上限である$67,276のフラクタルのスイープです。とはいえ技術的には、このブロックからまっすぐ反応が出ることも期待できます。たとえそれがローカルなものだとしても、反応には変わりありません。
* iFVG 1W、$69,300 - $70,500 | 週足のインバートされたイムバランスです。反転した時点では、より大きい$72,460 - $65,770のFVGはまだ形成されていませんでした。当時はこのゾーンをかなり注意深く見ていました。より大きいブロックが出現した後、iFVGはその中央を通過してしまったためチャートから外しました。ですが、こうしたものの仕組み上、大きいFVGは消費されたとみなしてよい一方で、iFVGはまだ有効であり得ます。
* これらはすべて週足のプライスアクション要素であり、つまり現行のストーリーの潜在的なターゲットです。私のショートの指値はすでに$67,300付近にあり、プランに沿っています。
* ショートが発動したら、さらにPolymarketでBTCが2026年に55kを下回る賭けも倍にします。"Yes"側の価格は、私が数か月前に買った水準よりもすでに低くなっています。サイクルの底が入っているという見方が、明らかにますます強くなっています。
前回、見落としていた「監視しておく価値のある」週足の値動き要素を2つ挙げます。これは主要なものではありませんが、局所的にはよりクリアな絵を補ってくれます。
* RB 1W、$67,710 - $67,276 | このブロックは、価格が$72,460 - $65,770のFVGの下側で反応した後に形成され、その後、局所的な安値を作ったインパルスが始まりました。私が待っているのは、このRBの上限である$67,276のフラクタルのスイープです。とはいえ技術的には、このブロックからまっすぐ反応が出ることも期待できます。たとえそれがローカルなものだとしても、反応には変わりありません。
* iFVG 1W、$69,300 - $70,500 | 週足のインバートされたイムバランスです。反転した時点では、より大きい$72,460 - $65,770のFVGはまだ形成されていませんでした。当時はこのゾーンをかなり注意深く見ていました。より大きいブロックが出現した後、iFVGはその中央を通過してしまったためチャートから外しました。ですが、こうしたものの仕組み上、大きいFVGは消費されたとみなしてよい一方で、iFVGはまだ有効であり得ます。
* これらはすべて週足のプライスアクション要素であり、つまり現行のストーリーの潜在的なターゲットです。私のショートの指値はすでに$67,300付近にあり、プランに沿っています。
* ショートが発動したら、さらにPolymarketでBTCが2026年に55kを下回る賭けも倍にします。"Yes"側の価格は、私が数か月前に買った水準よりもすでに低くなっています。サイクルの底が入っているという見方が、明らかにますます強くなっています。
* RB 1W、$67,710 - $67,276 | このブロックは、価格が$72,460 - $65,770のFVGの下側で反応した後に形成され、その後、局所的な安値を作ったインパルスが始まりました。私が待っているのは、このRBの上限である$67,276のフラクタルのスイープです。とはいえ技術的には、このブロックからまっすぐ反応が出ることも期待できます。たとえそれがローカルなものだとしても、反応には変わりありません。
* iFVG 1W、$69,300 - $70,500 | 週足のインバートされたイムバランスです。反転した時点では、より大きい$72,460 - $65,770のFVGはまだ形成されていませんでした。当時はこのゾーンをかなり注意深く見ていました。より大きいブロックが出現した後、iFVGはその中央を通過してしまったためチャートから外しました。ですが、こうしたものの仕組み上、大きいFVGは消費されたとみなしてよい一方で、iFVGはまだ有効であり得ます。
* これらはすべて週足のプライスアクション要素であり、つまり現行のストーリーの潜在的なターゲットです。私のショートの指値はすでに$67,300付近にあり、プランに沿っています。
* ショートが発動したら、さらにPolymarketでBTCが2026年に55kを下回る賭けも倍にします。"Yes"側の価格は、私が数か月前に買った水準よりもすでに低くなっています。サイクルの底が入っているという見方が、明らかにますます強くなっています。
80
·
--
週次レビュー、週のトレードプラン | $BTC
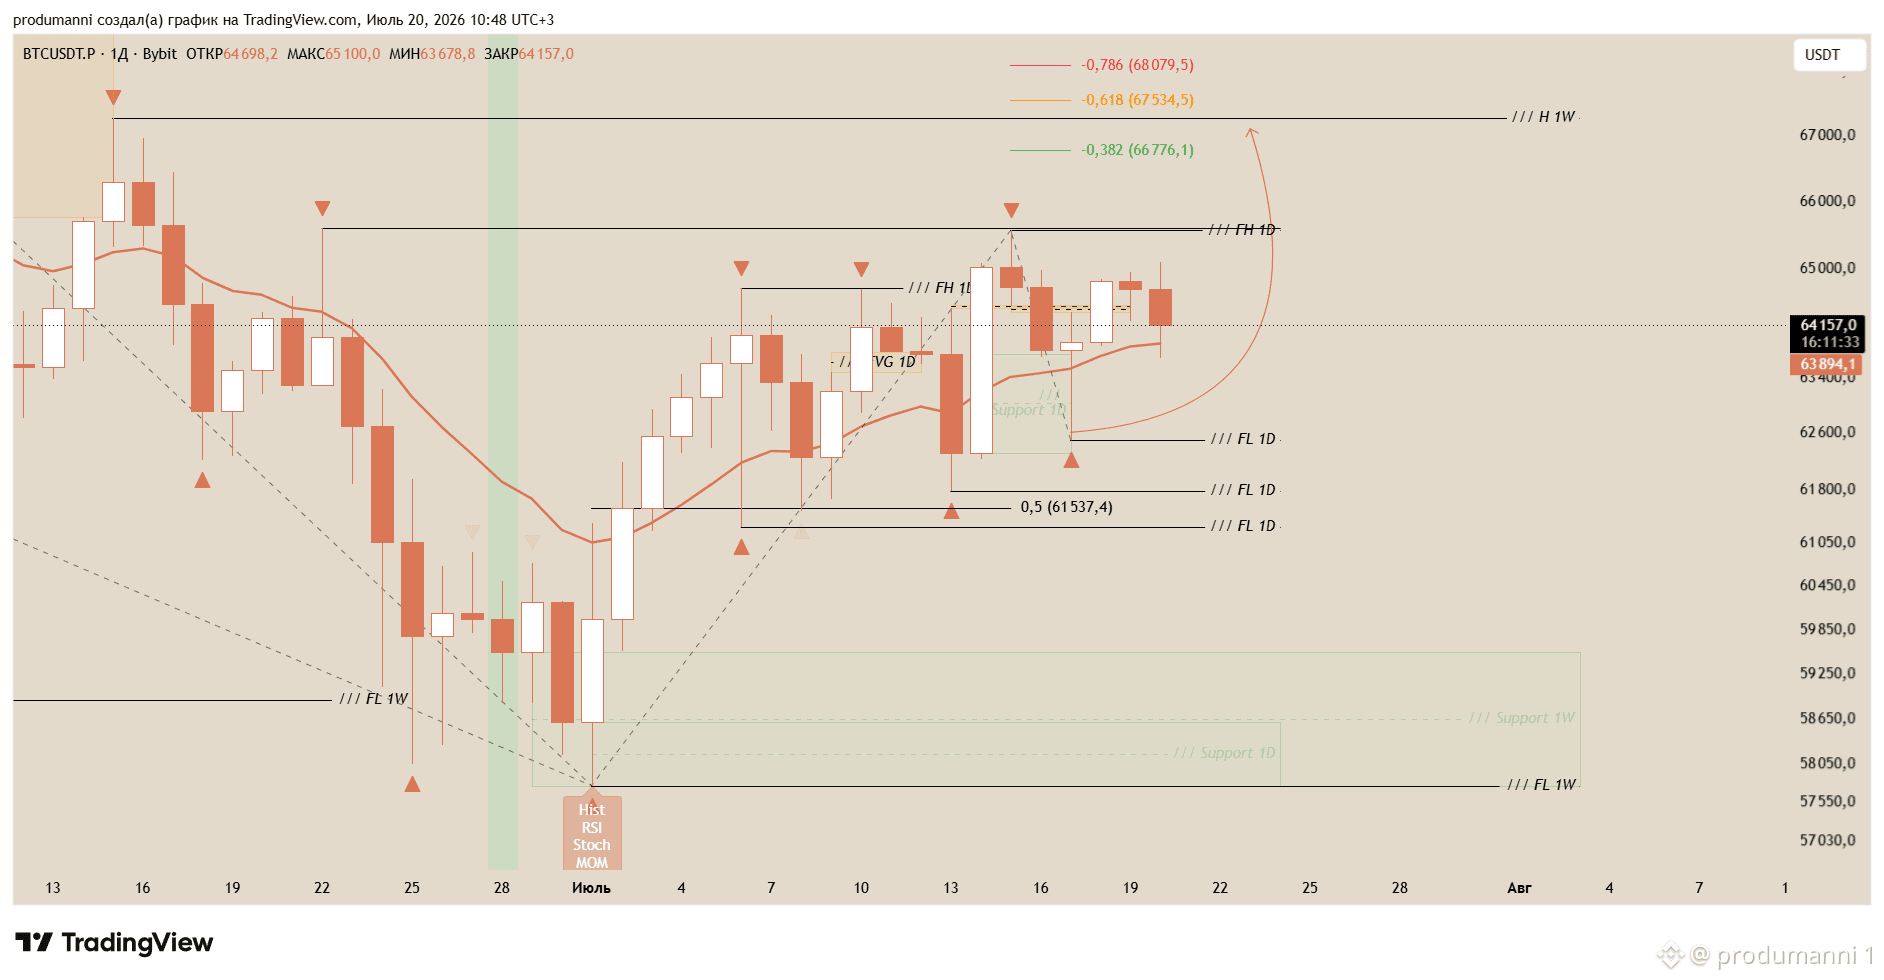
まず、別のサイクルロジックです。2022年と2018年、ベア局面のど真ん中で7月は強い下方向へのインパルスを出しました。2018年は-31%、2022年は-15%です。今後10日間でも同様の展開が起きるのは妥当だと思います。特に、それがメインプラン↓と一致しているからです。
前回の投稿では、上下どちらに動くかの条件を整理しました。メインターゲットは引き続き、週足の上昇トレンドである$67,300のフラクタルです。直近1週間では、$64,450 - $64,360という狭いレンジ内でいくつかの反転がありました。最新のものは買い手側で起きており、出来高デルタも一致していました。今はLTFを見ています。ロングを建てるには、1時間足のVC(バリューチェンジ)で十分でしょう。
リマインド:HTFはまだ月足のベアなナラティブの中です。ターゲットは月足の要素に位置しています。実際に意味を持つ最初のラインは$48,900です。これらのレビューでは、$71,400 - $48,900の月足SNRブロックを参照し続けてきました。すでに消化されていて先例があるなら、最初のターゲットはおそらく$48,900です。まだ有効なら、$57,750と$52,500も依然として射程に入っています。これらのどれかの水準へ向かう動きが今後10日間で起きれば、私が最初に示したパターンに合致します。そして$67,300が抜けた後の1D VCは、テクニカル面でそれを裏付け、サイクル最後のスイングショートを建てる判断材料になります。
週次レビュー、週のトレードプラン | $BTC
まず、別のサイクルロジックです。2022年と2018年、ベア局面のど真ん中で7月は強い下方向へのインパルスを出しました。2018年は-31%、2022年は-15%です。今後10日間でも同様の展開が起きるのは妥当だと思います。特に、それがメインプラン↓と一致しているからです。
前回の投稿では、上下どちらに動くかの条件を整理しました。メインターゲットは引き続き、週足の上昇トレンドである$67,300のフラクタルです。直近1週間では、$64,450 - $64,360という狭いレンジ内でいくつかの反転がありました。最新のものは買い手側で起きており、出来高デルタも一致していました。今はLTFを見ています。ロングを建てるには、1時間足のVC(バリューチェンジ)で十分でしょう。
リマインド:HTFはまだ月足のベアなナラティブの中です。ターゲットは月足の要素に位置しています。実際に意味を持つ最初のラインは$48,900です。これらのレビューでは、$71,400 - $48,900の月足SNRブロックを参照し続けてきました。すでに消化されていて先例があるなら、最初のターゲットはおそらく$48,900です。まだ有効なら、$57,750と$52,500も依然として射程に入っています。これらのどれかの水準へ向かう動きが今後10日間で起きれば、私が最初に示したパターンに合致します。そして$67,300が抜けた後の1D VCは、テクニカル面でそれを裏付け、サイクル最後のスイングショートを建てる判断材料になります。
まず、別のサイクルロジックです。2022年と2018年、ベア局面のど真ん中で7月は強い下方向へのインパルスを出しました。2018年は-31%、2022年は-15%です。今後10日間でも同様の展開が起きるのは妥当だと思います。特に、それがメインプラン↓と一致しているからです。
前回の投稿では、上下どちらに動くかの条件を整理しました。メインターゲットは引き続き、週足の上昇トレンドである$67,300のフラクタルです。直近1週間では、$64,450 - $64,360という狭いレンジ内でいくつかの反転がありました。最新のものは買い手側で起きており、出来高デルタも一致していました。今はLTFを見ています。ロングを建てるには、1時間足のVC(バリューチェンジ)で十分でしょう。
リマインド:HTFはまだ月足のベアなナラティブの中です。ターゲットは月足の要素に位置しています。実際に意味を持つ最初のラインは$48,900です。これらのレビューでは、$71,400 - $48,900の月足SNRブロックを参照し続けてきました。すでに消化されていて先例があるなら、最初のターゲットはおそらく$48,900です。まだ有効なら、$57,750と$52,500も依然として射程に入っています。これらのどれかの水準へ向かう動きが今後10日間で起きれば、私が最初に示したパターンに合致します。そして$67,300が抜けた後の1D VCは、テクニカル面でそれを裏付け、サイクル最後のスイングショートを建てる判断材料になります。
83
·
--
尊重はしないが、考慮する | $BTC
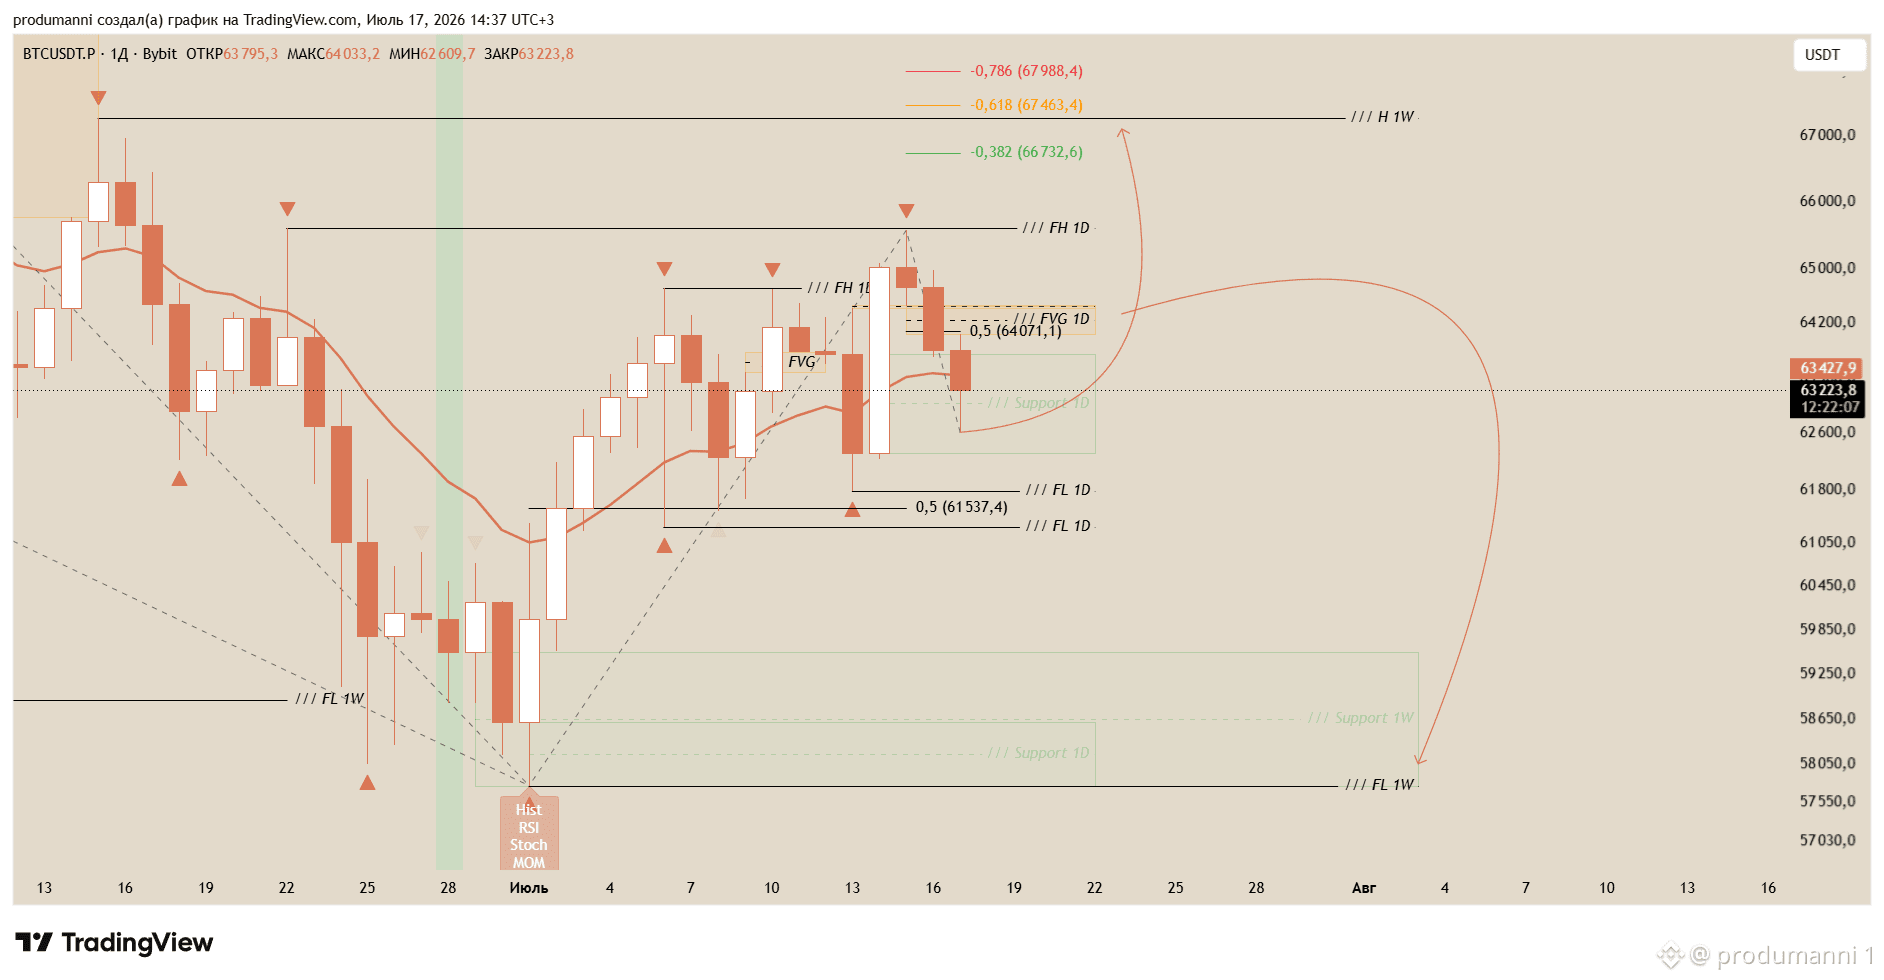
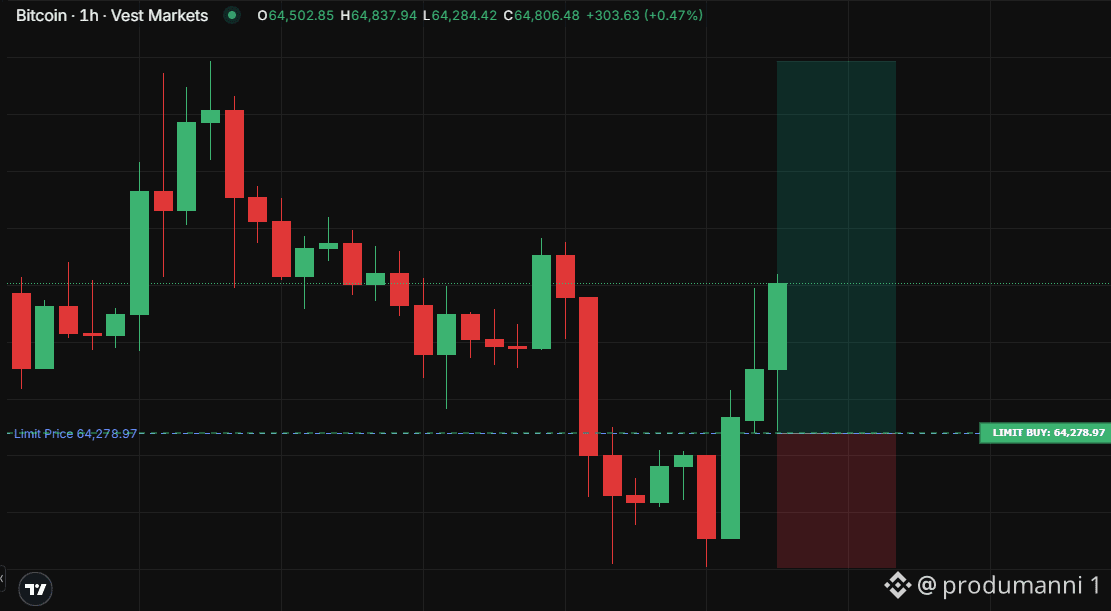
予告:私はリバウンド局面の目標が約$67,300あたりで推移するのを見ています。ですが、今日は日足のセラーFVGがチャートに出てくる可能性があります。これは「私たちはもう反転したのか?」と問い直す十分な根拠です。
有効な売り出来高は$64,700の日足フラクタルの地点で出現しました。技術的には、これは$67,300を目指す動きのキャンセルと、その後の下落が週足のエリアへ向けて再開すること(まずは$58,600あたり)として読めます。
私はこれを無視していません。FVGが形成されるなら、下限(目安として$64,000付近)から通常のリスクでショートを入れます。もし損切りに遭ったら、$67,300がスイープされるのを確認してから再エントリーします。
損切り $65,566 • 利確 $58,600
尊重はしないが、考慮する | $BTC
予告:私はリバウンド局面の目標が約$67,300あたりで推移するのを見ています。ですが、今日は日足のセラーFVGがチャートに出てくる可能性があります。これは「私たちはもう反転したのか?」と問い直す十分な根拠です。
有効な売り出来高は$64,700の日足フラクタルの地点で出現しました。技術的には、これは$67,300を目指す動きのキャンセルと、その後の下落が週足のエリアへ向けて再開すること(まずは$58,600あたり)として読めます。
私はこれを無視していません。FVGが形成されるなら、下限(目安として$64,000付近)から通常のリスクでショートを入れます。もし損切りに遭ったら、$67,300がスイープされるのを確認してから再エントリーします。
損切り $65,566 • 利確 $58,600
予告:私はリバウンド局面の目標が約$67,300あたりで推移するのを見ています。ですが、今日は日足のセラーFVGがチャートに出てくる可能性があります。これは「私たちはもう反転したのか?」と問い直す十分な根拠です。
有効な売り出来高は$64,700の日足フラクタルの地点で出現しました。技術的には、これは$67,300を目指す動きのキャンセルと、その後の下落が週足のエリアへ向けて再開すること(まずは$58,600あたり)として読めます。
私はこれを無視していません。FVGが形成されるなら、下限(目安として$64,000付近)から通常のリスクでショートを入れます。もし損切りに遭ったら、$67,300がスイープされるのを確認してから再エントリーします。
損切り $65,566 • 利確 $58,600
94
·
--
66
·
--
ああ、この逆張りみたいなナンセンス | $BTC BTC
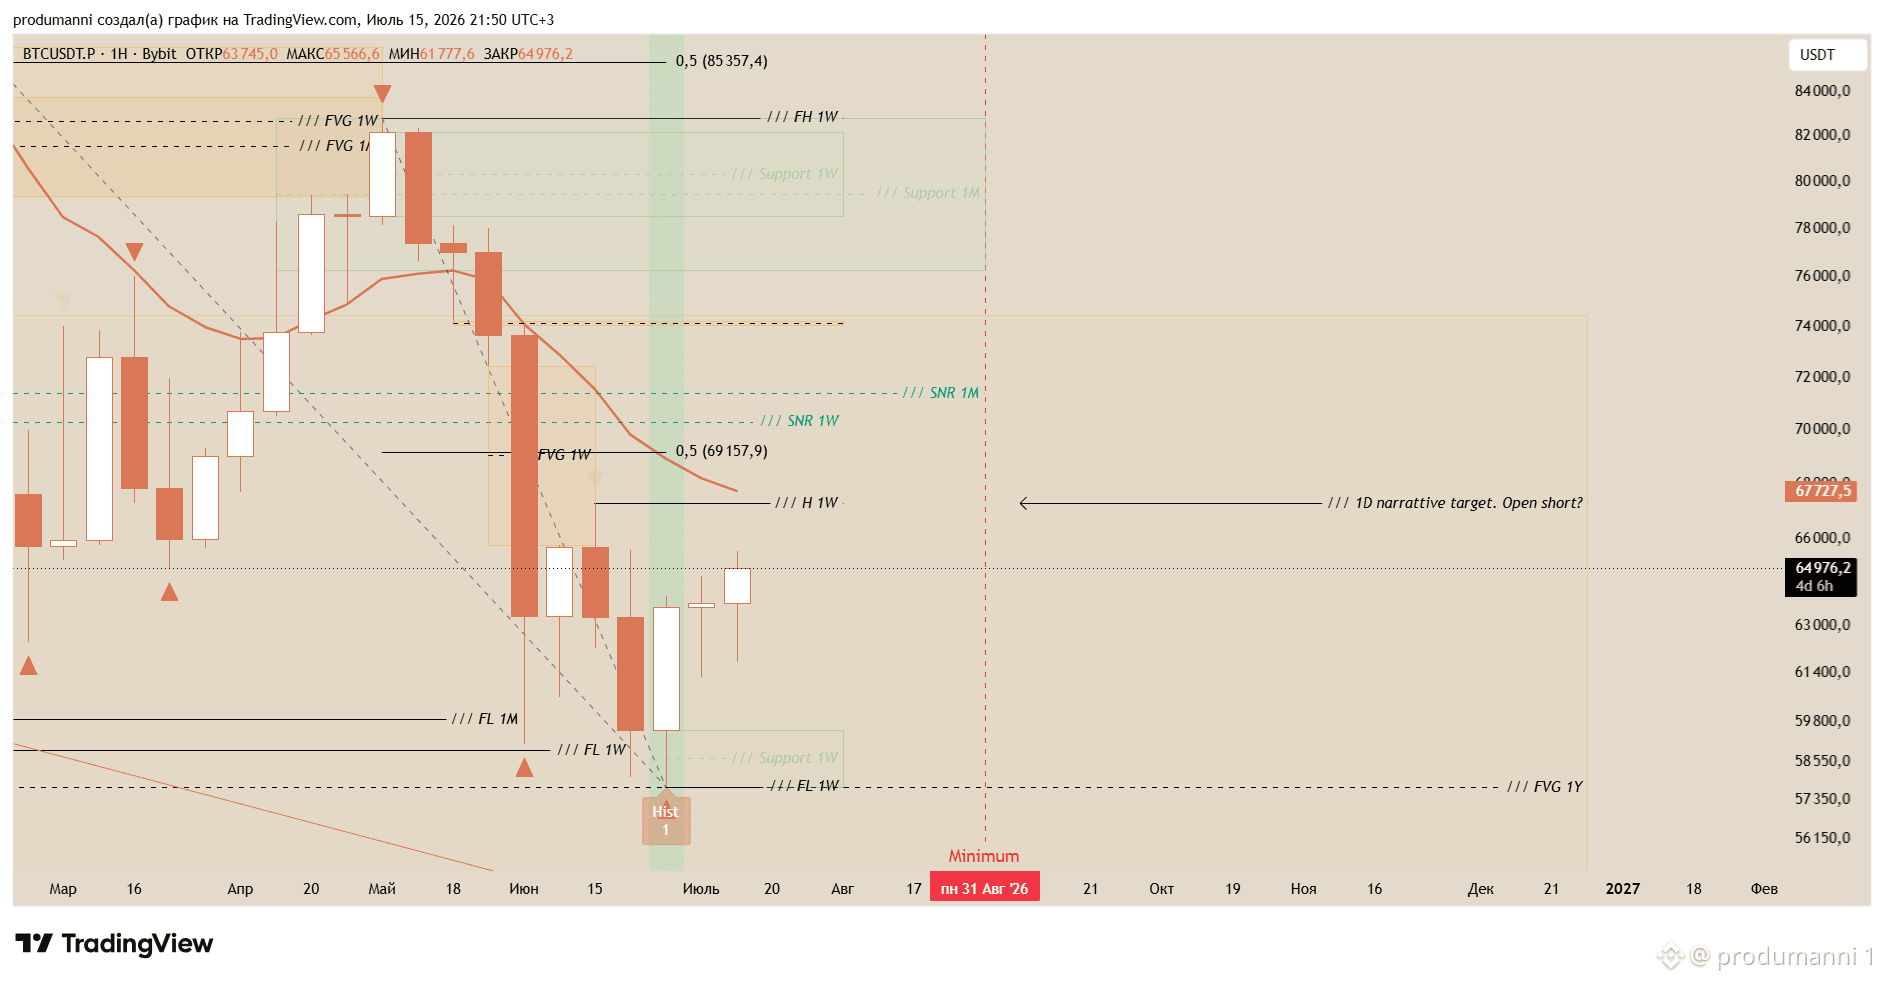
予定どおりに週次の振り返りをする理由は見当たりませんでした。何も変わっていません。値動きはまだ、以前の取引プランに沿って動いていて、つまり週次の水準に向かっています。私が最初に印を付けたのは$67,730で、いま価格が向かっているのはそこです。
ここに地政学を持ち込むのは、理由があります。中東の見出しとBTCの価格との結びつきは本物です。ビットコインはいつも通りです。平和なら上がり、緊張が高まれば下がる。ここから先を見れば見るほど、景色はもっと醜くなります。米国とその取り巻きは損失を受け入れて、そして安い原油の時代は終わった。いま起きているのは、要するに—直接引用ですが—トランプ大統領のオフィスの発言として、すべてを元の位置に押し戻して、原油価格を押さえ込むことです。言い換えれば、市場が上がるための根本的な材料はありません ↓
それが、私を一番気にさせる点です。私はBTCのサイクルのタイミングを固く信じていますが、同様に、成功するたびに乖離が遠ざかるわけではなく、むしろ近づいていくことも分かっています。市場はフラクタルです。完成したトレンドに見えるものは、いつだってより大きな動きのほんの一部にすぎません。BTCはスーパ―サイクルの調整をするでしょう。そして、これまでにやったことのない何か—完璧な4年サイクルの構造を崩すこと—を確実にやります。それが今なのかどうかが問題です。
ローカルでは、前にも言った通り、私は$67,730を待っています。そこからLTFでもショートのエントリーを探します。ちなみに$ETHはBTCを大きく引き離していて、すでに反転パターンが狙える水準まで到達しています。以前も言ったように、これはサイクル最後の大きな下落スイングに向けた、しっかりした布陣です。リスクを増やして、いつもの2:1の比率は捨てるつもりです。
ああ、この逆張りみたいなナンセンス | $BTC BTC
予定どおりに週次の振り返りをする理由は見当たりませんでした。何も変わっていません。値動きはまだ、以前の取引プランに沿って動いていて、つまり週次の水準に向かっています。私が最初に印を付けたのは$67,730で、いま価格が向かっているのはそこです。
ここに地政学を持ち込むのは、理由があります。中東の見出しとBTCの価格との結びつきは本物です。ビットコインはいつも通りです。平和なら上がり、緊張が高まれば下がる。ここから先を見れば見るほど、景色はもっと醜くなります。米国とその取り巻きは損失を受け入れて、そして安い原油の時代は終わった。いま起きているのは、要するに—直接引用ですが—トランプ大統領のオフィスの発言として、すべてを元の位置に押し戻して、原油価格を押さえ込むことです。言い換えれば、市場が上がるための根本的な材料はありません ↓
それが、私を一番気にさせる点です。私はBTCのサイクルのタイミングを固く信じていますが、同様に、成功するたびに乖離が遠ざかるわけではなく、むしろ近づいていくことも分かっています。市場はフラクタルです。完成したトレンドに見えるものは、いつだってより大きな動きのほんの一部にすぎません。BTCはスーパ―サイクルの調整をするでしょう。そして、これまでにやったことのない何か—完璧な4年サイクルの構造を崩すこと—を確実にやります。それが今なのかどうかが問題です。
ローカルでは、前にも言った通り、私は$67,730を待っています。そこからLTFでもショートのエントリーを探します。ちなみに$ETHはBTCを大きく引き離していて、すでに反転パターンが狙える水準まで到達しています。以前も言ったように、これはサイクル最後の大きな下落スイングに向けた、しっかりした布陣です。リスクを増やして、いつもの2:1の比率は捨てるつもりです。
予定どおりに週次の振り返りをする理由は見当たりませんでした。何も変わっていません。値動きはまだ、以前の取引プランに沿って動いていて、つまり週次の水準に向かっています。私が最初に印を付けたのは$67,730で、いま価格が向かっているのはそこです。
ここに地政学を持ち込むのは、理由があります。中東の見出しとBTCの価格との結びつきは本物です。ビットコインはいつも通りです。平和なら上がり、緊張が高まれば下がる。ここから先を見れば見るほど、景色はもっと醜くなります。米国とその取り巻きは損失を受け入れて、そして安い原油の時代は終わった。いま起きているのは、要するに—直接引用ですが—トランプ大統領のオフィスの発言として、すべてを元の位置に押し戻して、原油価格を押さえ込むことです。言い換えれば、市場が上がるための根本的な材料はありません ↓
それが、私を一番気にさせる点です。私はBTCのサイクルのタイミングを固く信じていますが、同様に、成功するたびに乖離が遠ざかるわけではなく、むしろ近づいていくことも分かっています。市場はフラクタルです。完成したトレンドに見えるものは、いつだってより大きな動きのほんの一部にすぎません。BTCはスーパ―サイクルの調整をするでしょう。そして、これまでにやったことのない何か—完璧な4年サイクルの構造を崩すこと—を確実にやります。それが今なのかどうかが問題です。
ローカルでは、前にも言った通り、私は$67,730を待っています。そこからLTFでもショートのエントリーを探します。ちなみに$ETHはBTCを大きく引き離していて、すでに反転パターンが狙える水準まで到達しています。以前も言ったように、これはサイクル最後の大きな下落スイングに向けた、しっかりした布陣です。リスクを増やして、いつもの2:1の比率は捨てるつもりです。
70
·
--
カウントダウン、残り2か月 | $BTC
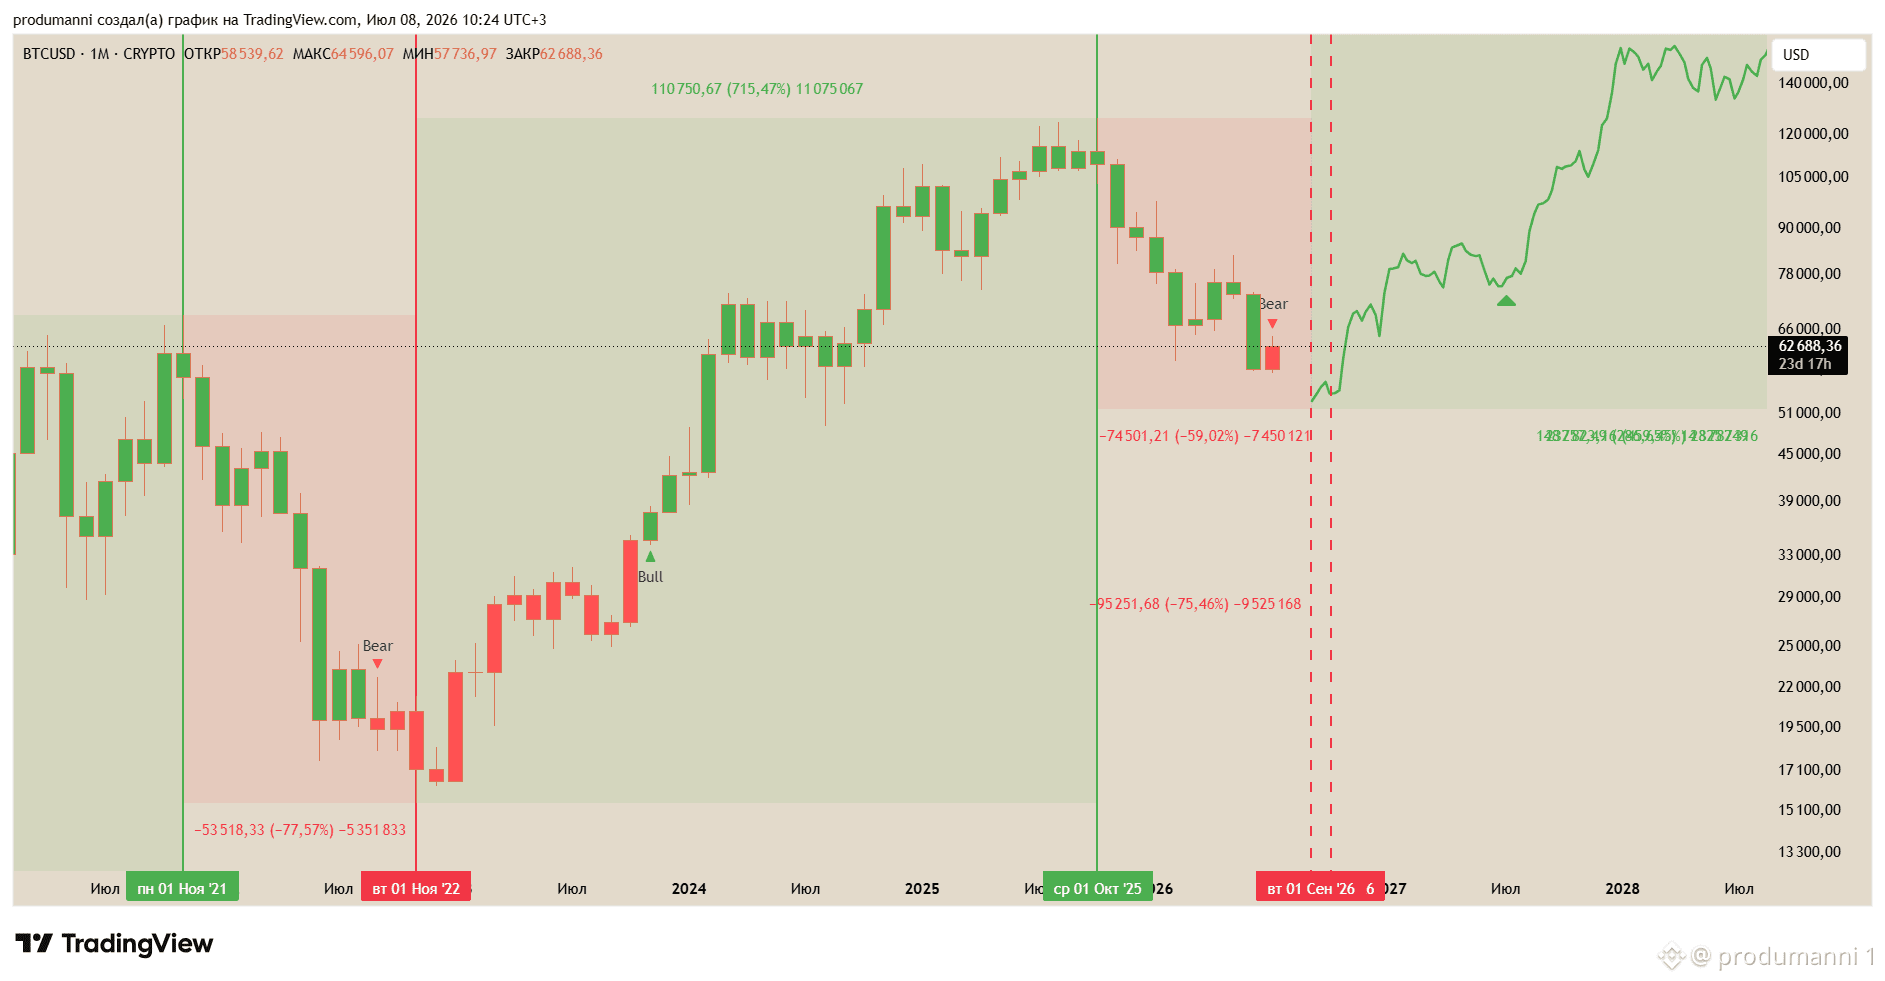
以前、Trader XO マクロ・トレンド・スキャナーについて触れました。当時は2週間の時間軸の話をしていましたが、今回は月足を見ています。
前回のサイクルでは、指標が実際の安値の約2か月前に弱気シグナルを出しました。同じシグナルが今回、7月のローソク足の中に表示されたところです。おおよそ同じタイミングは、私がすでにマッピングしていたボトム・ウィンドウの最初の数日を示唆しています。
このケースは、複数の要因の束として見ています。関連しているのは前回サイクルとのみであり、1つの指標だけに頼るのは愚かです。私は、すでに提示した時間枠——2026年9月4日から2026年10月21日まで——に対する追加の裏付けとしてのみ扱います。
カウントダウン、残り2か月 | $BTC
以前、Trader XO マクロ・トレンド・スキャナーについて触れました。当時は2週間の時間軸の話をしていましたが、今回は月足を見ています。
前回のサイクルでは、指標が実際の安値の約2か月前に弱気シグナルを出しました。同じシグナルが今回、7月のローソク足の中に表示されたところです。おおよそ同じタイミングは、私がすでにマッピングしていたボトム・ウィンドウの最初の数日を示唆しています。
このケースは、複数の要因の束として見ています。関連しているのは前回サイクルとのみであり、1つの指標だけに頼るのは愚かです。私は、すでに提示した時間枠——2026年9月4日から2026年10月21日まで——に対する追加の裏付けとしてのみ扱います。
以前、Trader XO マクロ・トレンド・スキャナーについて触れました。当時は2週間の時間軸の話をしていましたが、今回は月足を見ています。
前回のサイクルでは、指標が実際の安値の約2か月前に弱気シグナルを出しました。同じシグナルが今回、7月のローソク足の中に表示されたところです。おおよそ同じタイミングは、私がすでにマッピングしていたボトム・ウィンドウの最初の数日を示唆しています。
このケースは、複数の要因の束として見ています。関連しているのは前回サイクルとのみであり、1つの指標だけに頼るのは愚かです。私は、すでに提示した時間枠——2026年9月4日から2026年10月21日まで——に対する追加の裏付けとしてのみ扱います。
71
·
--
週次のマーケットアップデート、$BTC
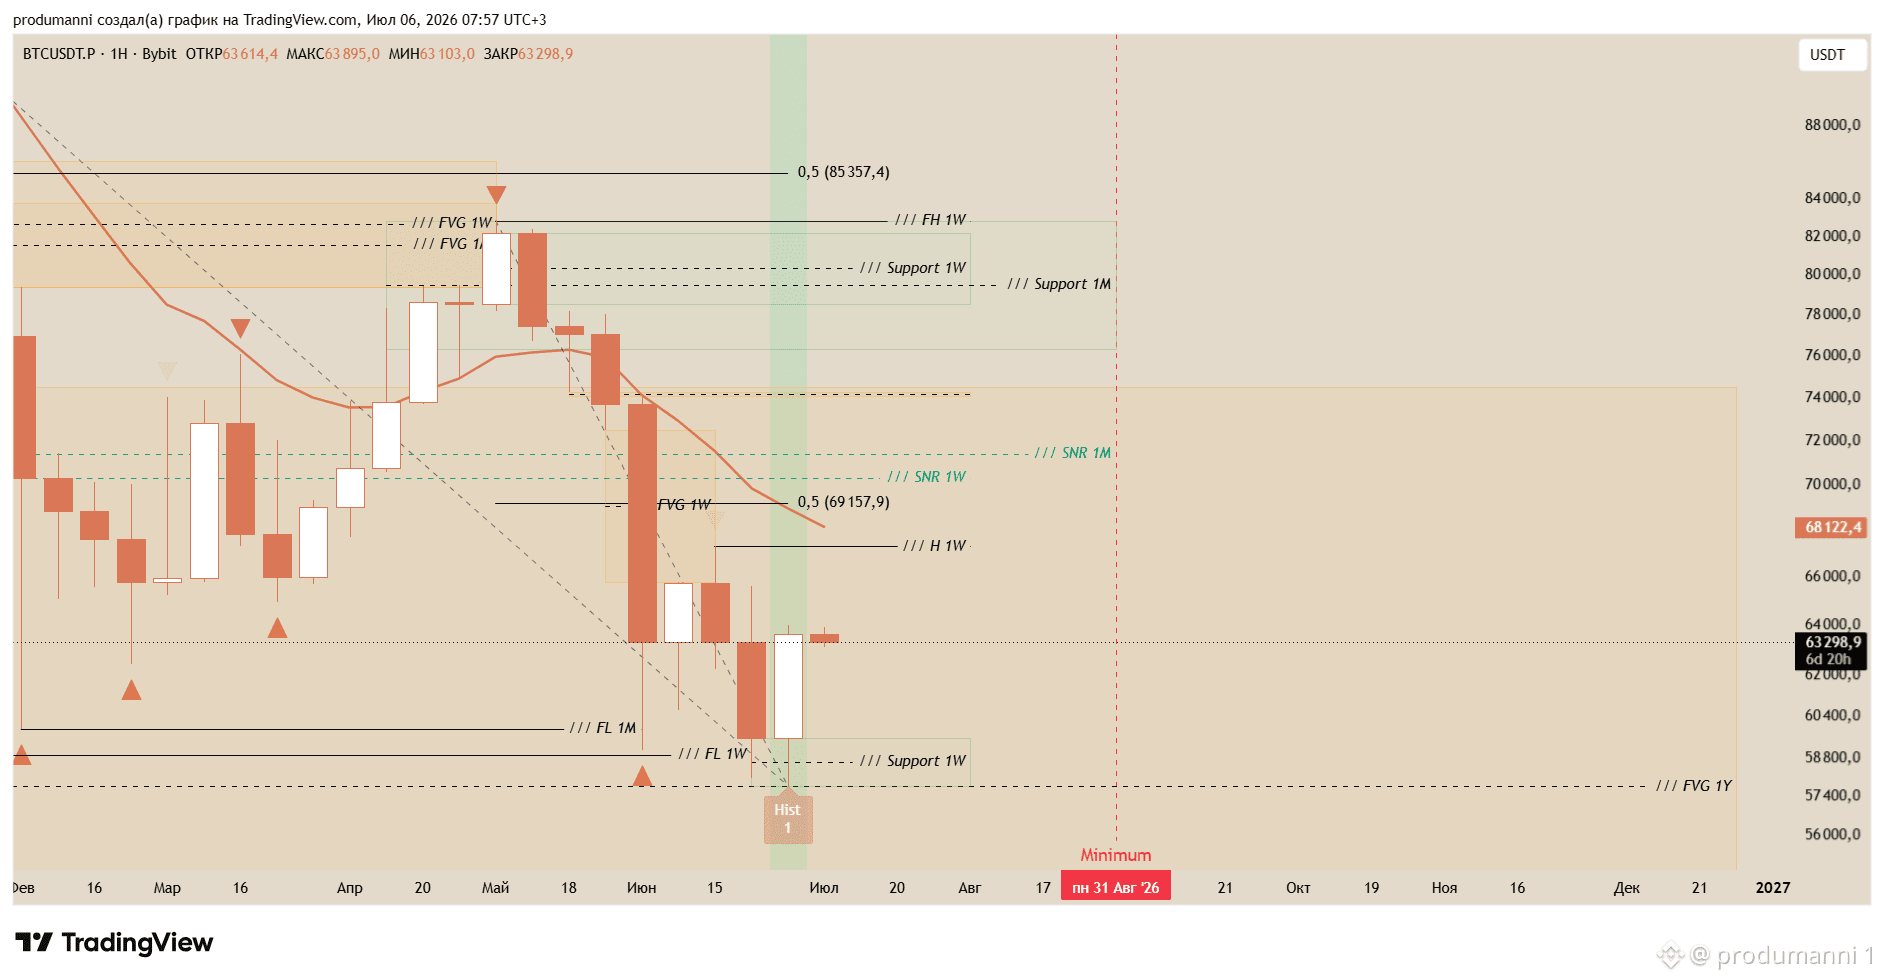
月次・週次の目標が$58,900で達成された後、買い手が現れました。$62,188から$62,311の間にFVGが形成されました。これはストレートなVCシグナルです。今回の新しい値動きには週次の要素に対するターゲットがあり、最初のものは明確に$67,276の3本足フラクタルです。このフラクタルは、週次の3本足パターンとしてよりも、まだ適切に埋められていない週次FVGの中にある5本足の日次トリガーとして重要です。その上、$69,158には直近の下落インパルスの0.5の水準もあります。
他のターゲットについては、週次のSNRブロック内($70,300〜$82,811)のいずれかの日次要素が機能し得ます。例えば$72,000あたりです。すでにかなり高い水準で、しかもセカンダリーターゲットなので、私は$67,276と、それに向かう途中の日次要素だけを見ています。なぜなら、それらのどれかが強気の物語を打ち消し、価格を週次の要素へ再び引き戻す可能性があるからです。ただし今回は下方向にです。そのターゲットは、新たに形成されたRB($59,550〜$57,755)で、そしてそのRBをブレイクすることになります。
日次要素による無効化(インバリデーション)という見方は、私がずっと持ち出している移動平均によっても裏付けられています。現時点ではそれが約$64,300にあり、ちょうどその日次RBの中に位置しています。このアルゴリズムの水準は、何度も強いサポートまたはレジスタンスのように機能します。価格がそれをブレイクして終値で抜けるまでは、ショートのほうが有利です。
そして、窓(ウィンドウ)を正確に特定できないのは事実ですが、そもそも窓とはレンジであり、不確実性と「外れ値の動き」への余地が常にあります。それでも、弱気フェーズがこの早い段階で終わると仮定するのは、たった2か月後であれば尚更、無謀です。
週次のマーケットアップデート、$BTC
月次・週次の目標が$58,900で達成された後、買い手が現れました。$62,188から$62,311の間にFVGが形成されました。これはストレートなVCシグナルです。今回の新しい値動きには週次の要素に対するターゲットがあり、最初のものは明確に$67,276の3本足フラクタルです。このフラクタルは、週次の3本足パターンとしてよりも、まだ適切に埋められていない週次FVGの中にある5本足の日次トリガーとして重要です。その上、$69,158には直近の下落インパルスの0.5の水準もあります。
他のターゲットについては、週次のSNRブロック内($70,300〜$82,811)のいずれかの日次要素が機能し得ます。例えば$72,000あたりです。すでにかなり高い水準で、しかもセカンダリーターゲットなので、私は$67,276と、それに向かう途中の日次要素だけを見ています。なぜなら、それらのどれかが強気の物語を打ち消し、価格を週次の要素へ再び引き戻す可能性があるからです。ただし今回は下方向にです。そのターゲットは、新たに形成されたRB($59,550〜$57,755)で、そしてそのRBをブレイクすることになります。
日次要素による無効化(インバリデーション)という見方は、私がずっと持ち出している移動平均によっても裏付けられています。現時点ではそれが約$64,300にあり、ちょうどその日次RBの中に位置しています。このアルゴリズムの水準は、何度も強いサポートまたはレジスタンスのように機能します。価格がそれをブレイクして終値で抜けるまでは、ショートのほうが有利です。
そして、窓(ウィンドウ)を正確に特定できないのは事実ですが、そもそも窓とはレンジであり、不確実性と「外れ値の動き」への余地が常にあります。それでも、弱気フェーズがこの早い段階で終わると仮定するのは、たった2か月後であれば尚更、無謀です。
月次・週次の目標が$58,900で達成された後、買い手が現れました。$62,188から$62,311の間にFVGが形成されました。これはストレートなVCシグナルです。今回の新しい値動きには週次の要素に対するターゲットがあり、最初のものは明確に$67,276の3本足フラクタルです。このフラクタルは、週次の3本足パターンとしてよりも、まだ適切に埋められていない週次FVGの中にある5本足の日次トリガーとして重要です。その上、$69,158には直近の下落インパルスの0.5の水準もあります。
他のターゲットについては、週次のSNRブロック内($70,300〜$82,811)のいずれかの日次要素が機能し得ます。例えば$72,000あたりです。すでにかなり高い水準で、しかもセカンダリーターゲットなので、私は$67,276と、それに向かう途中の日次要素だけを見ています。なぜなら、それらのどれかが強気の物語を打ち消し、価格を週次の要素へ再び引き戻す可能性があるからです。ただし今回は下方向にです。そのターゲットは、新たに形成されたRB($59,550〜$57,755)で、そしてそのRBをブレイクすることになります。
日次要素による無効化(インバリデーション)という見方は、私がずっと持ち出している移動平均によっても裏付けられています。現時点ではそれが約$64,300にあり、ちょうどその日次RBの中に位置しています。このアルゴリズムの水準は、何度も強いサポートまたはレジスタンスのように機能します。価格がそれをブレイクして終値で抜けるまでは、ショートのほうが有利です。
そして、窓(ウィンドウ)を正確に特定できないのは事実ですが、そもそも窓とはレンジであり、不確実性と「外れ値の動き」への余地が常にあります。それでも、弱気フェーズがこの早い段階で終わると仮定するのは、たった2か月後であれば尚更、無謀です。
72
·
--
重要な $BTC の潜在HTF目標の内訳
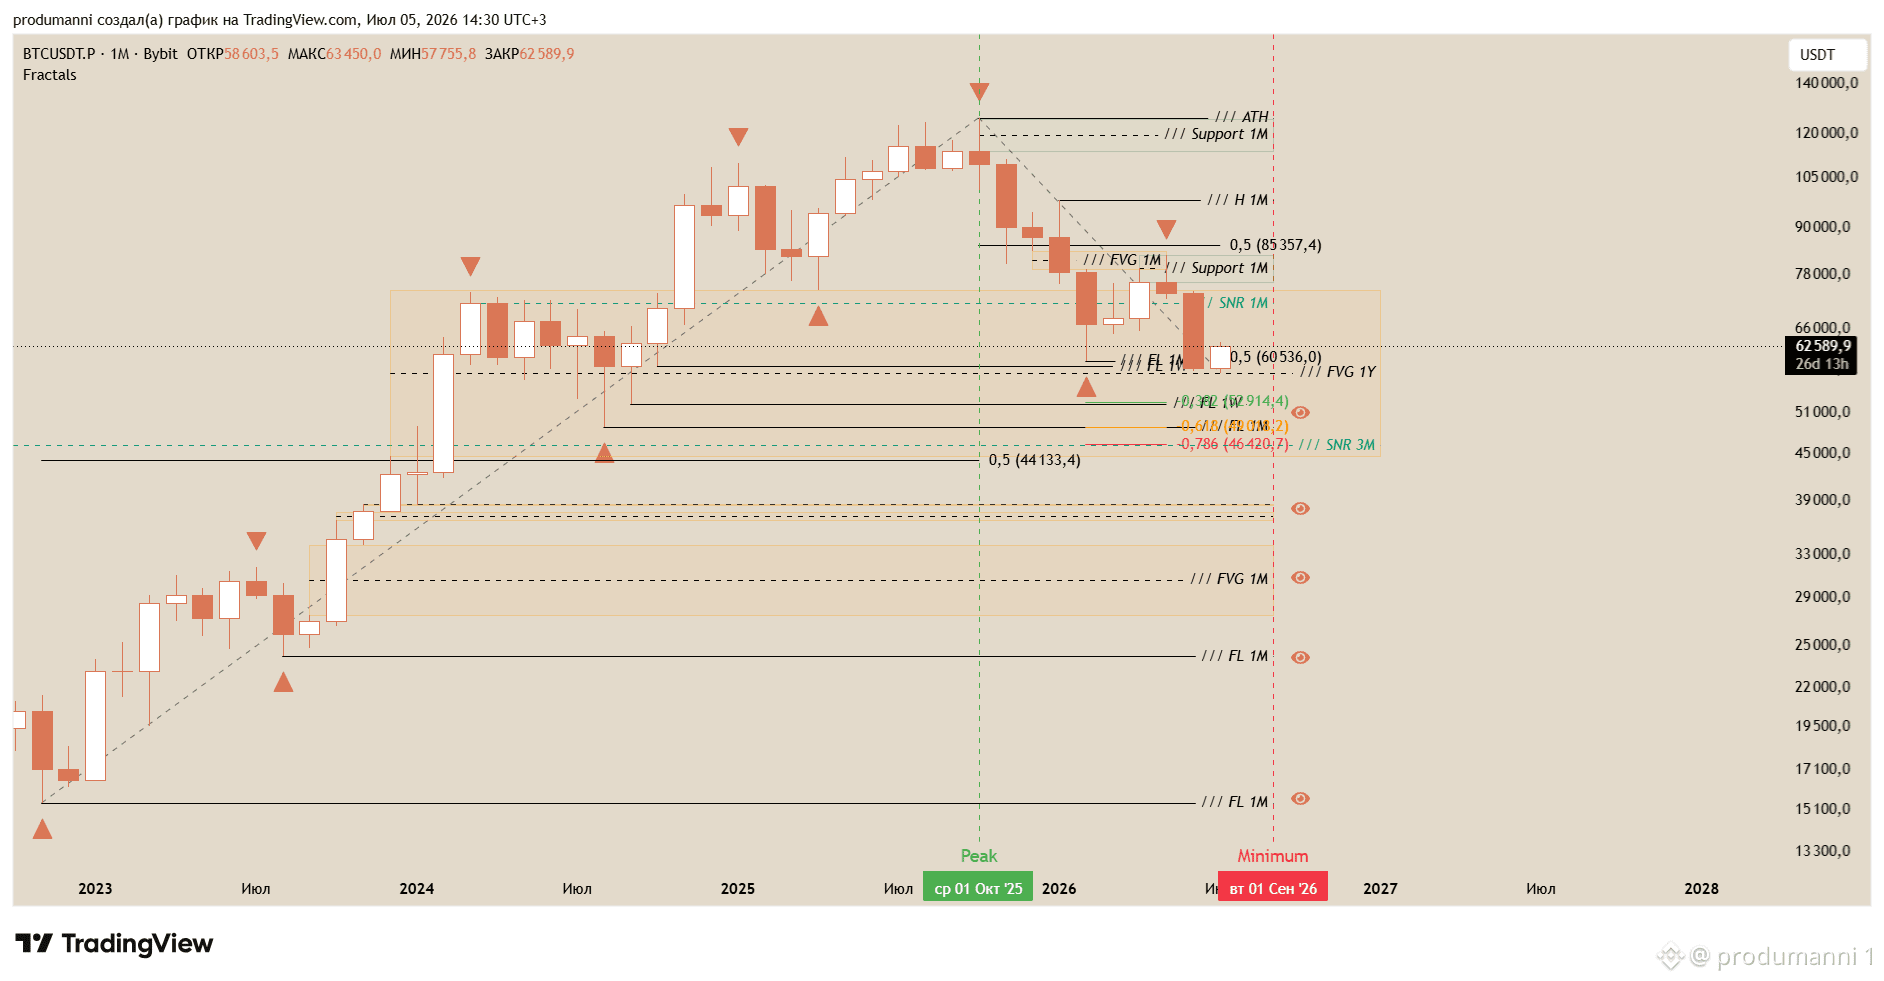
4年サイクルのベア局面が、明確なオーダーフロー構造を伴って進行中です。鋭く下落した後に月次のセラーFVGが形成され、価格アクションがそのゾーンをテストし、VCを得て、同じ台本を繰り返すことで引き続き投げ続けます。
現在のナラティブにおけるターゲットは月次タイムフレームに位置しています。しかし、単にレベルに到達するだけでは不十分です。重要なのは確認、つまりVCです。その後で初めて反転について語れます。実際には、これは特定のタイムフレーム内の要素同士の往復にすぎません。価格が1Mのエレメントに到達し、1WのVCを形成してから、反対方向に次の1Mエレメントへ向かいます。ポイントはシンプルです。X-1のVCが形成されるまで、1Mに対して1Wで到達したとは言えません。メインのタイムフレームにおける次のエレメントから作業する必要があります。
現在の月次下方向ナラティブの潜在ターゲット:
* $59,888 | このレベルはすでに到達済みで、併せて有効な $58,900 ターゲットにも到達しています。ここから 1W のVCが出て構造を反転させる可能性は十分にあります。それは許容しています。9月に下部ウィンドウがマークされており、価格ウィンドウは $52,000 未満で開くとはいえ、このようなレンジが存在するという事実は、各サイクルに固有の変動性があることを示しています。つまり、今回のサイクルも、予想された枠を上下どちらにでも伸び得るということです。
* $52,500 | 次の稼働中のターゲット。これは週足フラクタルですが、月次のSNRブロック($71,400 - $48,900)の中にあります。SNRブロックの狙いは、その境界の内側では X-1 タイムフレームのエレメントを有効として扱えることです。つまり、週足エレメントは月次のものとして読み替えられます。注意点は、2月の修正がすでにこのSNRブロックと相互作用しており、その後に1WのVCが形成されているため、実務上そのエレメントはすでに完全に提供(到達)済みである、という点です。
1/2
重要な $BTC の潜在HTF目標の内訳
4年サイクルのベア局面が、明確なオーダーフロー構造を伴って進行中です。鋭く下落した後に月次のセラーFVGが形成され、価格アクションがそのゾーンをテストし、VCを得て、同じ台本を繰り返すことで引き続き投げ続けます。
現在のナラティブにおけるターゲットは月次タイムフレームに位置しています。しかし、単にレベルに到達するだけでは不十分です。重要なのは確認、つまりVCです。その後で初めて反転について語れます。実際には、これは特定のタイムフレーム内の要素同士の往復にすぎません。価格が1Mのエレメントに到達し、1WのVCを形成してから、反対方向に次の1Mエレメントへ向かいます。ポイントはシンプルです。X-1のVCが形成されるまで、1Mに対して1Wで到達したとは言えません。メインのタイムフレームにおける次のエレメントから作業する必要があります。
現在の月次下方向ナラティブの潜在ターゲット:
* $59,888 | このレベルはすでに到達済みで、併せて有効な $58,900 ターゲットにも到達しています。ここから 1W のVCが出て構造を反転させる可能性は十分にあります。それは許容しています。9月に下部ウィンドウがマークされており、価格ウィンドウは $52,000 未満で開くとはいえ、このようなレンジが存在するという事実は、各サイクルに固有の変動性があることを示しています。つまり、今回のサイクルも、予想された枠を上下どちらにでも伸び得るということです。
* $52,500 | 次の稼働中のターゲット。これは週足フラクタルですが、月次のSNRブロック($71,400 - $48,900)の中にあります。SNRブロックの狙いは、その境界の内側では X-1 タイムフレームのエレメントを有効として扱えることです。つまり、週足エレメントは月次のものとして読み替えられます。注意点は、2月の修正がすでにこのSNRブロックと相互作用しており、その後に1WのVCが形成されているため、実務上そのエレメントはすでに完全に提供(到達)済みである、という点です。
1/2
4年サイクルのベア局面が、明確なオーダーフロー構造を伴って進行中です。鋭く下落した後に月次のセラーFVGが形成され、価格アクションがそのゾーンをテストし、VCを得て、同じ台本を繰り返すことで引き続き投げ続けます。
現在のナラティブにおけるターゲットは月次タイムフレームに位置しています。しかし、単にレベルに到達するだけでは不十分です。重要なのは確認、つまりVCです。その後で初めて反転について語れます。実際には、これは特定のタイムフレーム内の要素同士の往復にすぎません。価格が1Mのエレメントに到達し、1WのVCを形成してから、反対方向に次の1Mエレメントへ向かいます。ポイントはシンプルです。X-1のVCが形成されるまで、1Mに対して1Wで到達したとは言えません。メインのタイムフレームにおける次のエレメントから作業する必要があります。
現在の月次下方向ナラティブの潜在ターゲット:
* $59,888 | このレベルはすでに到達済みで、併せて有効な $58,900 ターゲットにも到達しています。ここから 1W のVCが出て構造を反転させる可能性は十分にあります。それは許容しています。9月に下部ウィンドウがマークされており、価格ウィンドウは $52,000 未満で開くとはいえ、このようなレンジが存在するという事実は、各サイクルに固有の変動性があることを示しています。つまり、今回のサイクルも、予想された枠を上下どちらにでも伸び得るということです。
* $52,500 | 次の稼働中のターゲット。これは週足フラクタルですが、月次のSNRブロック($71,400 - $48,900)の中にあります。SNRブロックの狙いは、その境界の内側では X-1 タイムフレームのエレメントを有効として扱えることです。つまり、週足エレメントは月次のものとして読み替えられます。注意点は、2月の修正がすでにこのSNRブロックと相互作用しており、その後に1WのVCが形成されているため、実務上そのエレメントはすでに完全に提供(到達)済みである、という点です。
1/2
71
·
--
これを読んで!週次レビュー、月次の詳細 | $BTC
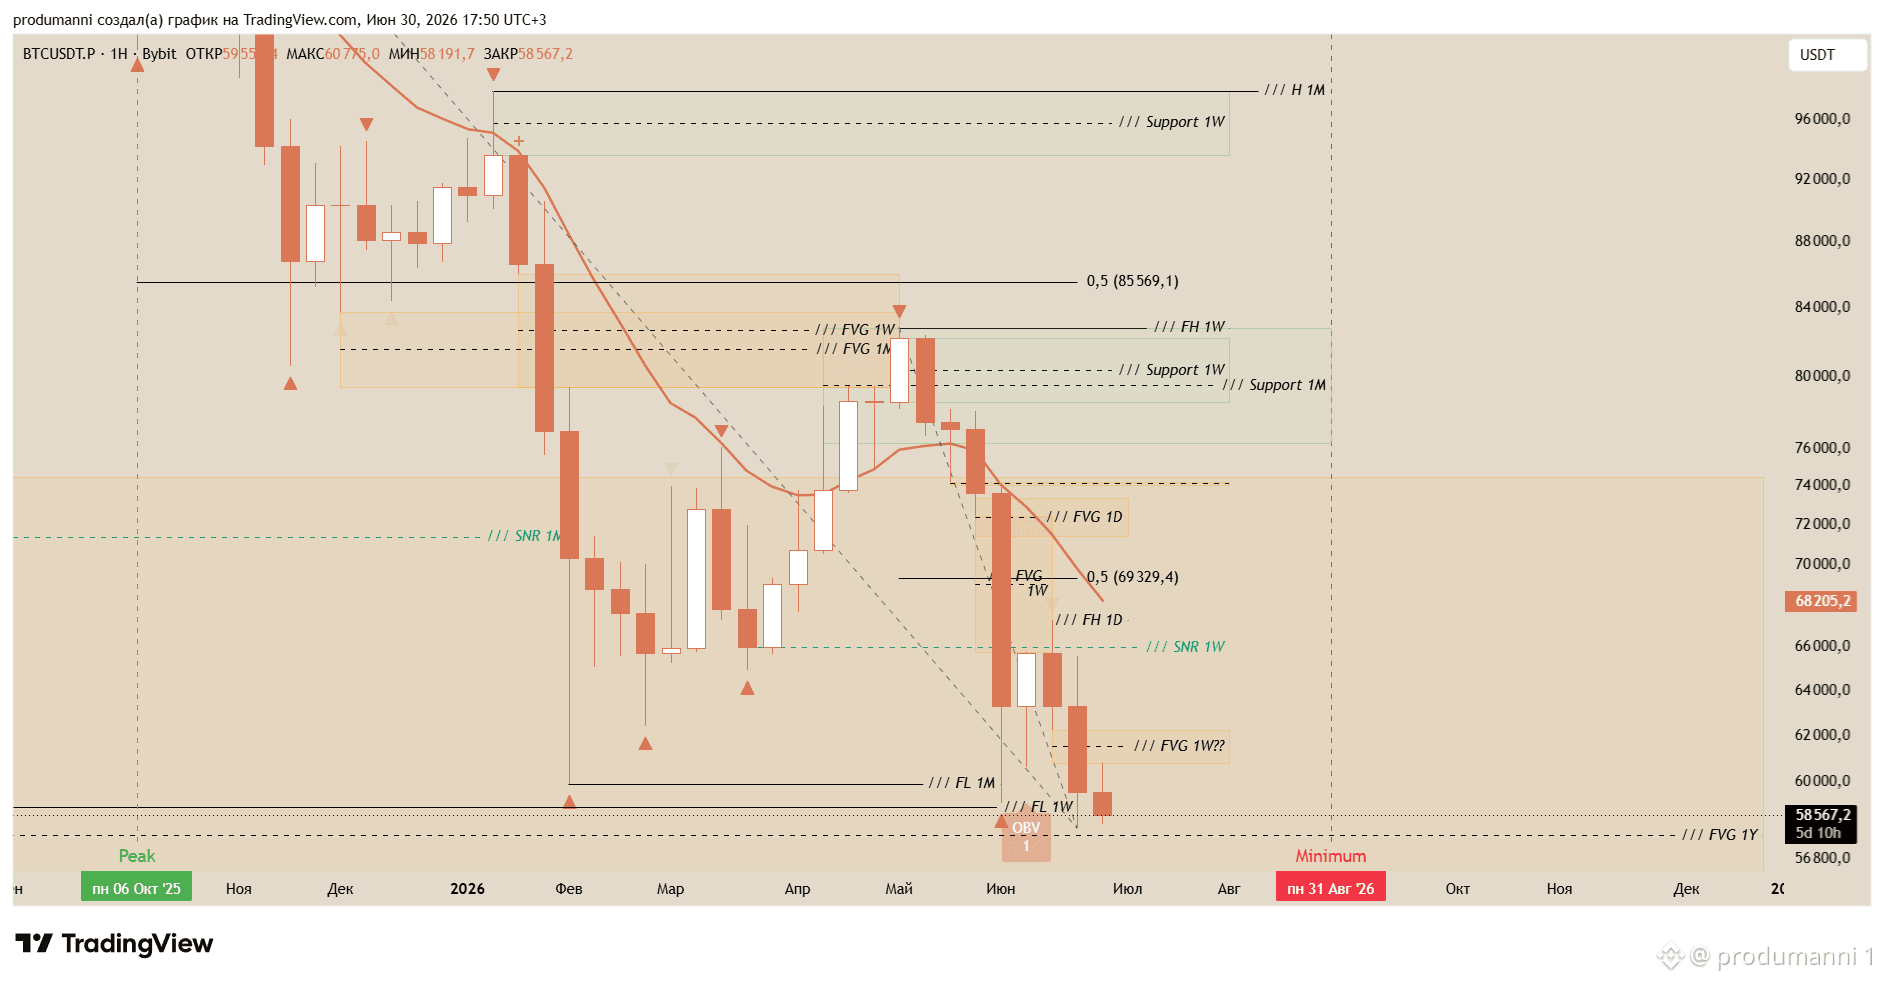
まず、メインの取引アイデアであるBTCの4年サイクルのタイミングに立ち返ります:
→ 2013年のサイクル天井から2015年の安値までは406日。
→ 2017年のサイクル天井から2018年の安値までは364日。
→ 2021年のサイクル天井から2022年の安値までは378日。
同じロジックは、サイクルトップの窓もかなりきれいに予測していました:
→ 2015年の安値から2017年の高値までは1064日。
→ 2018年の安値から2021年の高値までは1071日。
→ 2022年の安値から2025年の高値までは1043日。
私は9月4日から10月26日までを、異なる数学モデルで底の窓として示しました。重要!安値は早まったり遅れたりします。大事なのはその「範囲」そのものではなく、そこへどれだけ強く価格が押し込むかです ↓
サイクルのタイミングは、価格の見通しも与えてくれます。過去サイクルへの多数の数学的アプローチが、$50k - $30kレンジを示しています。それを裏づける指標のかたまりもあり、$45kが磁石のように現れています。さらに、その上には年次のFVGを軸にしたチャートパターンもあります。弱気サイクルでは、その下限である$44,729が常に支えになります ↓
だから私は2つの重要な要因を見ています。秋の前半、そして$50,000の上下数千ドルの範囲の「回廊」です。これが、終わりを迎えるサイクルの安値へBTCを運ぶ可能性が高いものです。
リスク?市場はフラクタルです。どれだけ大きいサイクルでも、それはスーパ−サイクルの一部にすぎません。ビットコインは現在、第4の弱気局面にあります。数え方によっては第5です。いずれにせよ、これはすべて1つのスーパ−サイクルであり、まだ本当の「調整」を受けていません。その調整はやって来ます。問題は「来るかどうか」ではなく、「いつ」来るかです。はっきりしているのは、それが経済の見通しと一致するはずだということ。そしてその見通しは、おそらく大きな危機へ向かっており、そうでなければはっきりしたデフレ(不況)です。
これを読んで!週次レビュー、月次の詳細 | $BTC
まず、メインの取引アイデアであるBTCの4年サイクルのタイミングに立ち返ります:
→ 2013年のサイクル天井から2015年の安値までは406日。
→ 2017年のサイクル天井から2018年の安値までは364日。
→ 2021年のサイクル天井から2022年の安値までは378日。
同じロジックは、サイクルトップの窓もかなりきれいに予測していました:
→ 2015年の安値から2017年の高値までは1064日。
→ 2018年の安値から2021年の高値までは1071日。
→ 2022年の安値から2025年の高値までは1043日。
私は9月4日から10月26日までを、異なる数学モデルで底の窓として示しました。重要!安値は早まったり遅れたりします。大事なのはその「範囲」そのものではなく、そこへどれだけ強く価格が押し込むかです ↓
サイクルのタイミングは、価格の見通しも与えてくれます。過去サイクルへの多数の数学的アプローチが、$50k - $30kレンジを示しています。それを裏づける指標のかたまりもあり、$45kが磁石のように現れています。さらに、その上には年次のFVGを軸にしたチャートパターンもあります。弱気サイクルでは、その下限である$44,729が常に支えになります ↓
だから私は2つの重要な要因を見ています。秋の前半、そして$50,000の上下数千ドルの範囲の「回廊」です。これが、終わりを迎えるサイクルの安値へBTCを運ぶ可能性が高いものです。
リスク?市場はフラクタルです。どれだけ大きいサイクルでも、それはスーパ−サイクルの一部にすぎません。ビットコインは現在、第4の弱気局面にあります。数え方によっては第5です。いずれにせよ、これはすべて1つのスーパ−サイクルであり、まだ本当の「調整」を受けていません。その調整はやって来ます。問題は「来るかどうか」ではなく、「いつ」来るかです。はっきりしているのは、それが経済の見通しと一致するはずだということ。そしてその見通しは、おそらく大きな危機へ向かっており、そうでなければはっきりしたデフレ(不況)です。
まず、メインの取引アイデアであるBTCの4年サイクルのタイミングに立ち返ります:
→ 2013年のサイクル天井から2015年の安値までは406日。
→ 2017年のサイクル天井から2018年の安値までは364日。
→ 2021年のサイクル天井から2022年の安値までは378日。
同じロジックは、サイクルトップの窓もかなりきれいに予測していました:
→ 2015年の安値から2017年の高値までは1064日。
→ 2018年の安値から2021年の高値までは1071日。
→ 2022年の安値から2025年の高値までは1043日。
私は9月4日から10月26日までを、異なる数学モデルで底の窓として示しました。重要!安値は早まったり遅れたりします。大事なのはその「範囲」そのものではなく、そこへどれだけ強く価格が押し込むかです ↓
サイクルのタイミングは、価格の見通しも与えてくれます。過去サイクルへの多数の数学的アプローチが、$50k - $30kレンジを示しています。それを裏づける指標のかたまりもあり、$45kが磁石のように現れています。さらに、その上には年次のFVGを軸にしたチャートパターンもあります。弱気サイクルでは、その下限である$44,729が常に支えになります ↓
だから私は2つの重要な要因を見ています。秋の前半、そして$50,000の上下数千ドルの範囲の「回廊」です。これが、終わりを迎えるサイクルの安値へBTCを運ぶ可能性が高いものです。
リスク?市場はフラクタルです。どれだけ大きいサイクルでも、それはスーパ−サイクルの一部にすぎません。ビットコインは現在、第4の弱気局面にあります。数え方によっては第5です。いずれにせよ、これはすべて1つのスーパ−サイクルであり、まだ本当の「調整」を受けていません。その調整はやって来ます。問題は「来るかどうか」ではなく、「いつ」来るかです。はっきりしているのは、それが経済の見通しと一致するはずだということ。そしてその見通しは、おそらく大きな危機へ向かっており、そうでなければはっきりしたデフレ(不況)です。
68
·
--
$APT 誰も待っていない | アルトコインについて少し
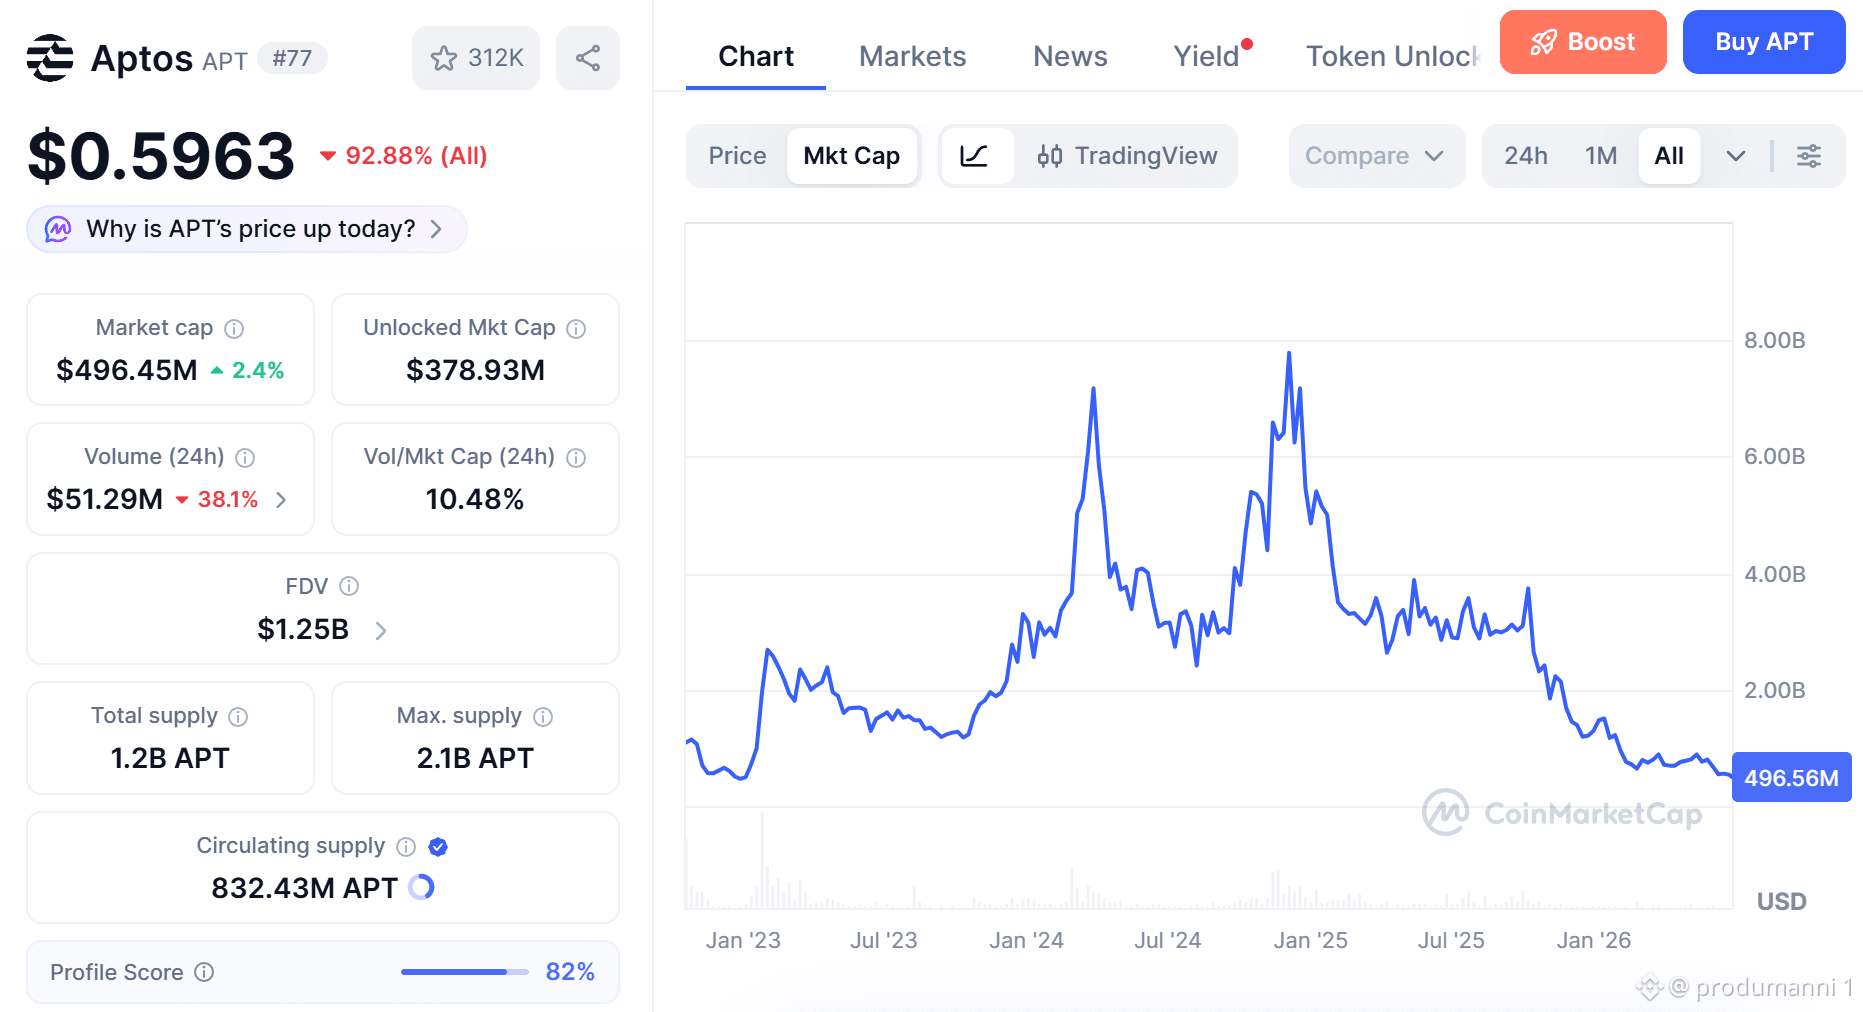
私のティッカー一覧で、秋の大掃除(壊滅)イベントの後に触りたくないチャートは $BTC 、$ETH 、そして $HYPE だけだ。$APT も時々そこに現れる。最初の3つは明らかだ。けれどもアプトスは、アルトコイン市場全体のきれいな鏡みたいなものだから、$APT の話をするときは、技術的にもファンダメンタル的にも、頭の中でだいたい別の任意のアルトコイン・ティッカーに置き換えていい。
技術的には、$APT ――つまり他のどんなティッカーでも同じだが――は目に見えて自由落下している、あるいは適正価格(フェアバリュー)を見つけている最中だ。そこにファンダメンタルが効いてくる。プロジェクト自身がまだ葬式(死)を宣言しておらず、チームが実際にはまだ存在している限り、それは生きたシステムであり、価格にも公正さがある。評価額が10億ドルでも、数百ドルでもね ↓
統計的にも、そして言うのが変に感じるくらいだが、トークンがプロジェクトにどれだけ密接に結びついていようと関係ない。良いニュースが出れば、チャート上で反応が起きる。それがまた、「買いにとっても売りにとっても、良い価格を見つける」ことが全体の主旨であることを裏づけている。
ファンダメンタル面では、$1B+ の評価額を支えるものは何もない。伝統的な領域には、その手の評価額を持つ会社がどう見えるはずなのかの例がいくらでもある。
力学として資産は抵抗の少ない道――つまり下方向――に沿って動く。前にも言った通り、大きな資金は株式(エクイティ)を買い、トークンはただのプレミアムだ。従業員がトークンボーナスを受け取れば、それも結局投げ売りする。私たちは、あるりんご畑の真ん中に立っていて、どういうわけか1個のりんごが新しい苗木そのものの値段になっているような状況だ。そして価格がほぼ無料になるところまで押し下げられるまでは、誰も買わない。
$APT 誰も待っていない | アルトコインについて少し
私のティッカー一覧で、秋の大掃除(壊滅)イベントの後に触りたくないチャートは $BTC 、$ETH 、そして $HYPE だけだ。$APT も時々そこに現れる。最初の3つは明らかだ。けれどもアプトスは、アルトコイン市場全体のきれいな鏡みたいなものだから、$APT の話をするときは、技術的にもファンダメンタル的にも、頭の中でだいたい別の任意のアルトコイン・ティッカーに置き換えていい。
技術的には、$APT ――つまり他のどんなティッカーでも同じだが――は目に見えて自由落下している、あるいは適正価格(フェアバリュー)を見つけている最中だ。そこにファンダメンタルが効いてくる。プロジェクト自身がまだ葬式(死)を宣言しておらず、チームが実際にはまだ存在している限り、それは生きたシステムであり、価格にも公正さがある。評価額が10億ドルでも、数百ドルでもね ↓
統計的にも、そして言うのが変に感じるくらいだが、トークンがプロジェクトにどれだけ密接に結びついていようと関係ない。良いニュースが出れば、チャート上で反応が起きる。それがまた、「買いにとっても売りにとっても、良い価格を見つける」ことが全体の主旨であることを裏づけている。
ファンダメンタル面では、$1B+ の評価額を支えるものは何もない。伝統的な領域には、その手の評価額を持つ会社がどう見えるはずなのかの例がいくらでもある。
力学として資産は抵抗の少ない道――つまり下方向――に沿って動く。前にも言った通り、大きな資金は株式(エクイティ)を買い、トークンはただのプレミアムだ。従業員がトークンボーナスを受け取れば、それも結局投げ売りする。私たちは、あるりんご畑の真ん中に立っていて、どういうわけか1個のりんごが新しい苗木そのものの値段になっているような状況だ。そして価格がほぼ無料になるところまで押し下げられるまでは、誰も買わない。
私のティッカー一覧で、秋の大掃除(壊滅)イベントの後に触りたくないチャートは $BTC 、$ETH 、そして $HYPE だけだ。$APT も時々そこに現れる。最初の3つは明らかだ。けれどもアプトスは、アルトコイン市場全体のきれいな鏡みたいなものだから、$APT の話をするときは、技術的にもファンダメンタル的にも、頭の中でだいたい別の任意のアルトコイン・ティッカーに置き換えていい。
技術的には、$APT ――つまり他のどんなティッカーでも同じだが――は目に見えて自由落下している、あるいは適正価格(フェアバリュー)を見つけている最中だ。そこにファンダメンタルが効いてくる。プロジェクト自身がまだ葬式(死)を宣言しておらず、チームが実際にはまだ存在している限り、それは生きたシステムであり、価格にも公正さがある。評価額が10億ドルでも、数百ドルでもね ↓
統計的にも、そして言うのが変に感じるくらいだが、トークンがプロジェクトにどれだけ密接に結びついていようと関係ない。良いニュースが出れば、チャート上で反応が起きる。それがまた、「買いにとっても売りにとっても、良い価格を見つける」ことが全体の主旨であることを裏づけている。
ファンダメンタル面では、$1B+ の評価額を支えるものは何もない。伝統的な領域には、その手の評価額を持つ会社がどう見えるはずなのかの例がいくらでもある。
力学として資産は抵抗の少ない道――つまり下方向――に沿って動く。前にも言った通り、大きな資金は株式(エクイティ)を買い、トークンはただのプレミアムだ。従業員がトークンボーナスを受け取れば、それも結局投げ売りする。私たちは、あるりんご畑の真ん中に立っていて、どういうわけか1個のりんごが新しい苗木そのものの値段になっているような状況だ。そして価格がほぼ無料になるところまで押し下げられるまでは、誰も買わない。
71
·
--
自信のあるBTCショート|週次アップデート
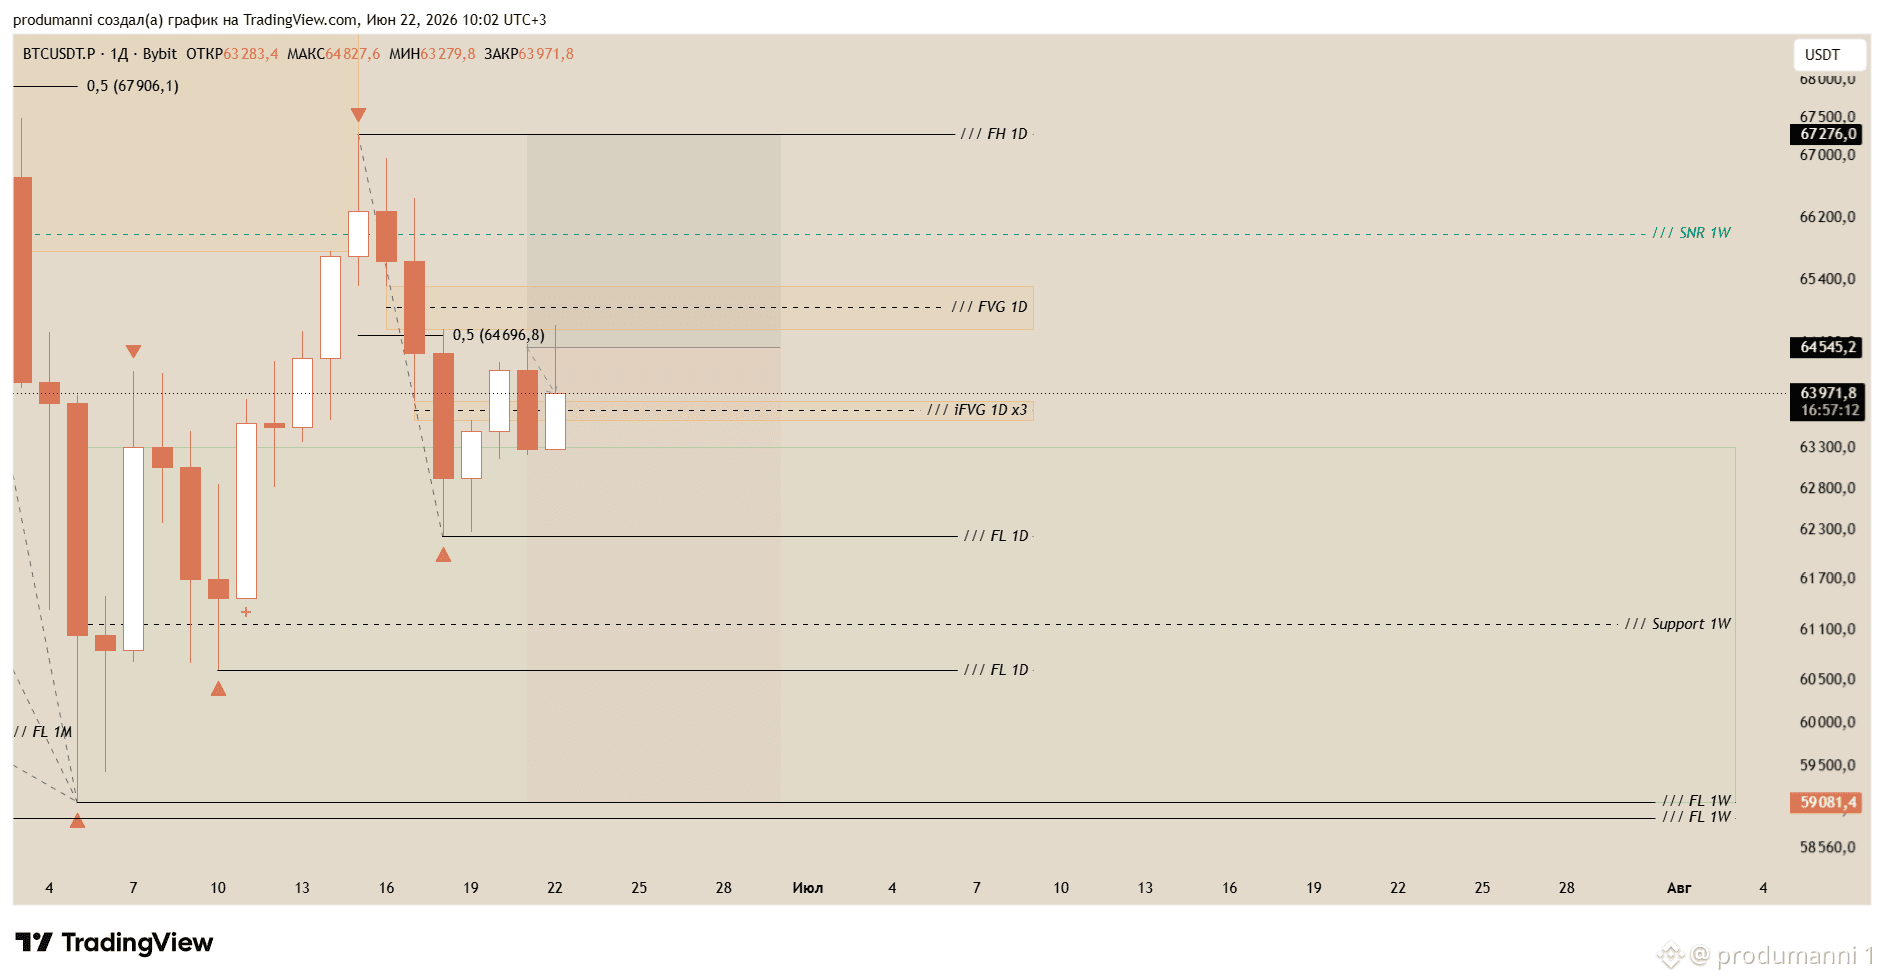
前回の更新では、$64,500 前後の水準でショートを仕掛けるのを待っていました。価格はそこまで到達したので、通常の3倍のリスクで $BTC の取引を開始し、ストップロスは $67,270、目標は $59,080 付近に設定しました。同様に $ETH の取引も開始しましたが、リスクはいつも通り ↓
ここからリスクについて。前回の更新で、私は $67,270 を上抜けるローカル転換(フリップ)なら許容できる、とすでに言っていました。つまり、ストップにかかることです。問題ありません。むしろ ↓
今のセットアップでは、VC は週足のFVG(フェアバリュー・ギャップ)エリアから来ています。$67,200 のフラクタルが、このゾーン内でのトリガーとして機能し、さらにそのエリアの0.5レベルはまだテストされていません。技術的には起こり得ますし、むしろ起こる必要があります。もし私をストップにかけるなら、より良いRR(リスクリワード)で再エントリーします。取引が生きている限り、私にとって最初に重要なのは $62,200 のフラクタルです。そこまで価格が来たら、取引を建値(ブレークイーブン)に移します。ETHも同じです。
残りの計画は変わりません。強調する価値があるのは、$62,200 のフラクタルでショートを建値に移すことの重要性だけです。これは $63,300 - $59,080 の 1W RB(週足レジスタンス/バース・レンジ)内でのトリガーのように働きます。そして、先ほども言った通り、その要素は週足でもあるため、デリバリー(到達)ターゲットとしても機能し得ます。
これがローカルの状況です。より大きな全体像は、別の投稿でまとめます。
自信のあるBTCショート|週次アップデート
前回の更新では、$64,500 前後の水準でショートを仕掛けるのを待っていました。価格はそこまで到達したので、通常の3倍のリスクで $BTC の取引を開始し、ストップロスは $67,270、目標は $59,080 付近に設定しました。同様に $ETH の取引も開始しましたが、リスクはいつも通り ↓
ここからリスクについて。前回の更新で、私は $67,270 を上抜けるローカル転換(フリップ)なら許容できる、とすでに言っていました。つまり、ストップにかかることです。問題ありません。むしろ ↓
今のセットアップでは、VC は週足のFVG(フェアバリュー・ギャップ)エリアから来ています。$67,200 のフラクタルが、このゾーン内でのトリガーとして機能し、さらにそのエリアの0.5レベルはまだテストされていません。技術的には起こり得ますし、むしろ起こる必要があります。もし私をストップにかけるなら、より良いRR(リスクリワード)で再エントリーします。取引が生きている限り、私にとって最初に重要なのは $62,200 のフラクタルです。そこまで価格が来たら、取引を建値(ブレークイーブン)に移します。ETHも同じです。
残りの計画は変わりません。強調する価値があるのは、$62,200 のフラクタルでショートを建値に移すことの重要性だけです。これは $63,300 - $59,080 の 1W RB(週足レジスタンス/バース・レンジ)内でのトリガーのように働きます。そして、先ほども言った通り、その要素は週足でもあるため、デリバリー(到達)ターゲットとしても機能し得ます。
これがローカルの状況です。より大きな全体像は、別の投稿でまとめます。
前回の更新では、$64,500 前後の水準でショートを仕掛けるのを待っていました。価格はそこまで到達したので、通常の3倍のリスクで $BTC の取引を開始し、ストップロスは $67,270、目標は $59,080 付近に設定しました。同様に $ETH の取引も開始しましたが、リスクはいつも通り ↓
ここからリスクについて。前回の更新で、私は $67,270 を上抜けるローカル転換(フリップ)なら許容できる、とすでに言っていました。つまり、ストップにかかることです。問題ありません。むしろ ↓
今のセットアップでは、VC は週足のFVG(フェアバリュー・ギャップ)エリアから来ています。$67,200 のフラクタルが、このゾーン内でのトリガーとして機能し、さらにそのエリアの0.5レベルはまだテストされていません。技術的には起こり得ますし、むしろ起こる必要があります。もし私をストップにかけるなら、より良いRR(リスクリワード)で再エントリーします。取引が生きている限り、私にとって最初に重要なのは $62,200 のフラクタルです。そこまで価格が来たら、取引を建値(ブレークイーブン)に移します。ETHも同じです。
残りの計画は変わりません。強調する価値があるのは、$62,200 のフラクタルでショートを建値に移すことの重要性だけです。これは $63,300 - $59,080 の 1W RB(週足レジスタンス/バース・レンジ)内でのトリガーのように働きます。そして、先ほども言った通り、その要素は週足でもあるため、デリバリー(到達)ターゲットとしても機能し得ます。
これがローカルの状況です。より大きな全体像は、別の投稿でまとめます。
83
·
--
たぶん明日 | $BTC
リマインダー:メインの計画のもとでは、週足要素へのデリバリーが想定されていました。最初は $65,770 - $72,460 のFVG ↓
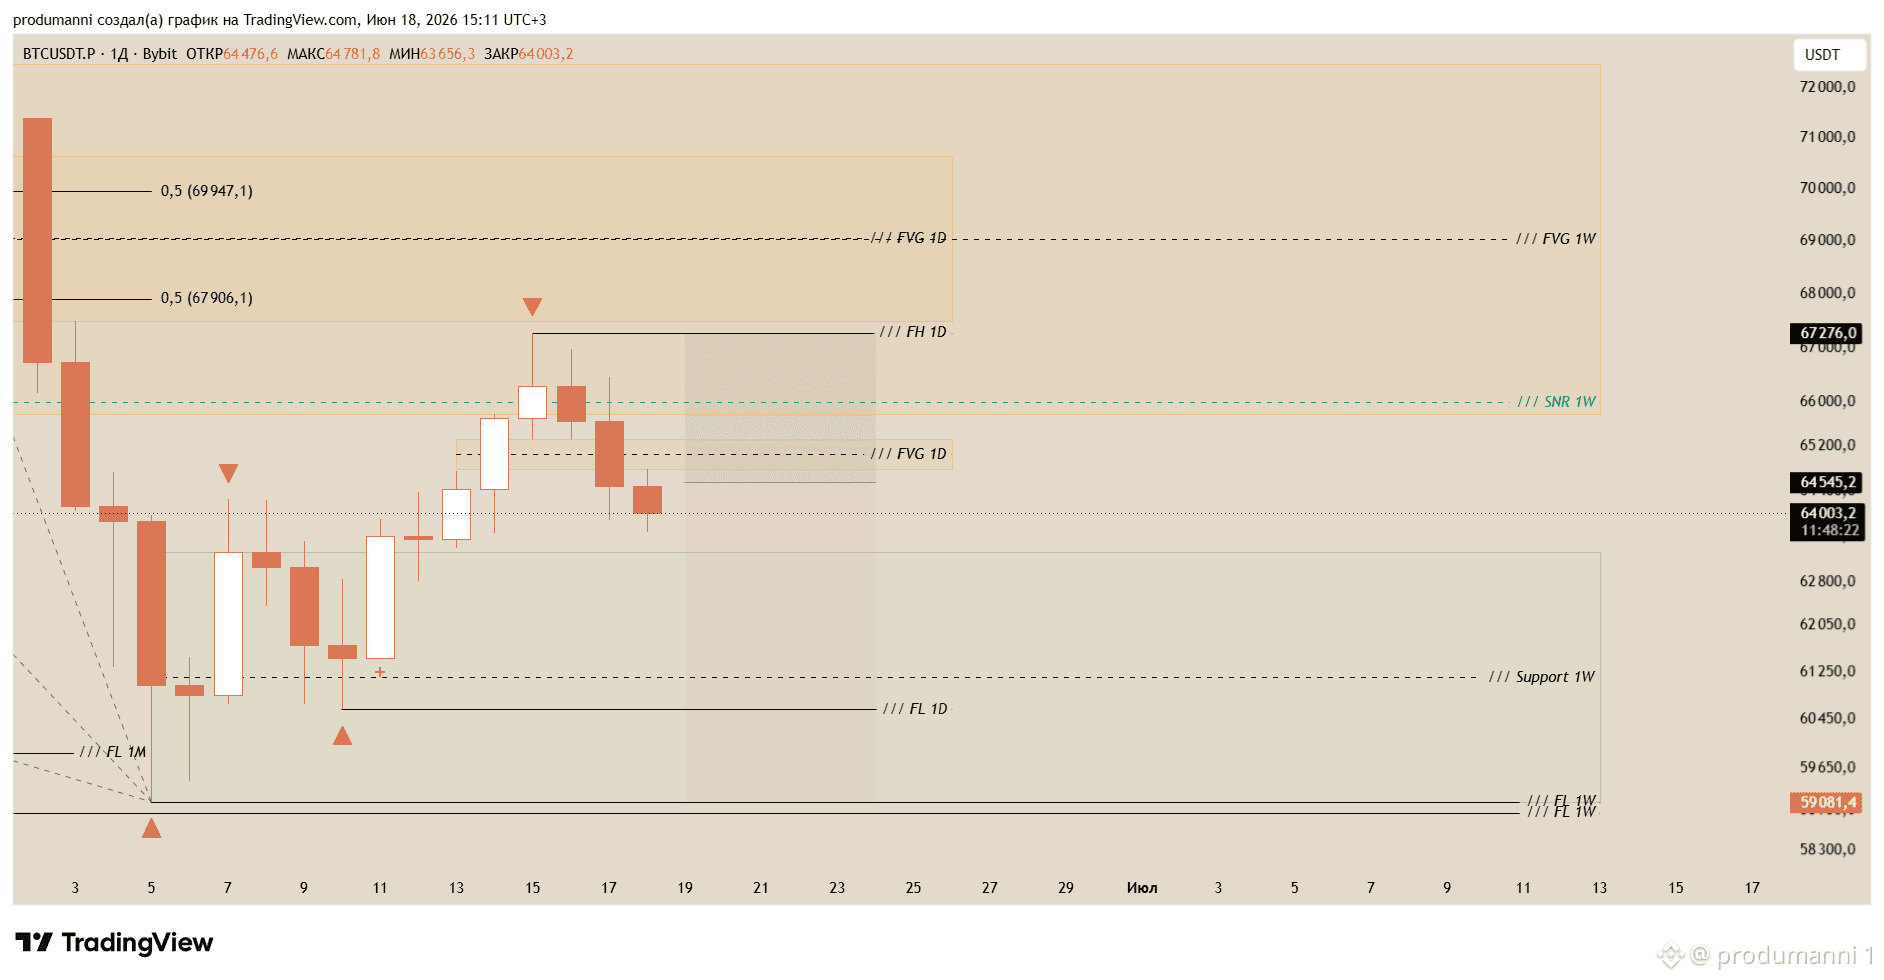
昨日のローソク足の終値までに、$65,317 と $64,781 の間にあるデイリーFVGが反転しました ↓
出来高デルタがマイナスなので、これは完全なVC(バリデーション・キャンセル)として読み取れます。つまり局所的な上方向への勢いのキャンセル、そして少なくとも最初の週足ターゲットである $59,081 のフラクタルまで、ドロップの継続を示すものです。さらにその直後に $58,900 があります。
今日の終値で、完全な売り手1D FVGが出現するかもしれません。それは到来するVCを直接的に裏付けます。私は、それを合図として、リスクを高めたショートのエントリーを検討します。重要な詳細:ポジションが $67 ,270 で損切りされる可能性は完全に織り込んでいますが、その水準はそれでもトリガーとして働き、下位タイムフレームでの新規エントリーを探すチャンスになります。
最後の一点。どのフラクタルにも、その中に下位タイムフレームのフラクタルが含まれるため、あるレベルのスイープは複数のタイムフレームにまたがって見られます。ですから、$59,888 の月足フラクタルがスイープされたとき、週足フラクタルも同様にスイープされ、その結果として $63,300 - $59,080 の範囲に週足RBが形成されました。このエリアが基本的な主要ターゲットで、$59,081 と $58,900 のフラクタルよりも、むしろ主POI(主要注目ポイント)として扱うほうがより正確です。あるいは、取引をブレークイーブンに移すためのゾーンとして使うこともできます。以上です。
たぶん明日 | $BTC
リマインダー:メインの計画のもとでは、週足要素へのデリバリーが想定されていました。最初は $65,770 - $72,460 のFVG ↓
昨日のローソク足の終値までに、$65,317 と $64,781 の間にあるデイリーFVGが反転しました ↓
出来高デルタがマイナスなので、これは完全なVC(バリデーション・キャンセル)として読み取れます。つまり局所的な上方向への勢いのキャンセル、そして少なくとも最初の週足ターゲットである $59,081 のフラクタルまで、ドロップの継続を示すものです。さらにその直後に $58,900 があります。
今日の終値で、完全な売り手1D FVGが出現するかもしれません。それは到来するVCを直接的に裏付けます。私は、それを合図として、リスクを高めたショートのエントリーを検討します。重要な詳細:ポジションが $67 ,270 で損切りされる可能性は完全に織り込んでいますが、その水準はそれでもトリガーとして働き、下位タイムフレームでの新規エントリーを探すチャンスになります。
最後の一点。どのフラクタルにも、その中に下位タイムフレームのフラクタルが含まれるため、あるレベルのスイープは複数のタイムフレームにまたがって見られます。ですから、$59,888 の月足フラクタルがスイープされたとき、週足フラクタルも同様にスイープされ、その結果として $63,300 - $59,080 の範囲に週足RBが形成されました。このエリアが基本的な主要ターゲットで、$59,081 と $58,900 のフラクタルよりも、むしろ主POI(主要注目ポイント)として扱うほうがより正確です。あるいは、取引をブレークイーブンに移すためのゾーンとして使うこともできます。以上です。
リマインダー:メインの計画のもとでは、週足要素へのデリバリーが想定されていました。最初は $65,770 - $72,460 のFVG ↓
昨日のローソク足の終値までに、$65,317 と $64,781 の間にあるデイリーFVGが反転しました ↓
出来高デルタがマイナスなので、これは完全なVC(バリデーション・キャンセル)として読み取れます。つまり局所的な上方向への勢いのキャンセル、そして少なくとも最初の週足ターゲットである $59,081 のフラクタルまで、ドロップの継続を示すものです。さらにその直後に $58,900 があります。
今日の終値で、完全な売り手1D FVGが出現するかもしれません。それは到来するVCを直接的に裏付けます。私は、それを合図として、リスクを高めたショートのエントリーを検討します。重要な詳細:ポジションが $67 ,270 で損切りされる可能性は完全に織り込んでいますが、その水準はそれでもトリガーとして働き、下位タイムフレームでの新規エントリーを探すチャンスになります。
最後の一点。どのフラクタルにも、その中に下位タイムフレームのフラクタルが含まれるため、あるレベルのスイープは複数のタイムフレームにまたがって見られます。ですから、$59,888 の月足フラクタルがスイープされたとき、週足フラクタルも同様にスイープされ、その結果として $63,300 - $59,080 の範囲に週足RBが形成されました。このエリアが基本的な主要ターゲットで、$59,081 と $58,900 のフラクタルよりも、むしろ主POI(主要注目ポイント)として扱うほうがより正確です。あるいは、取引をブレークイーブンに移すためのゾーンとして使うこともできます。以上です。
92
·
--
$BTC
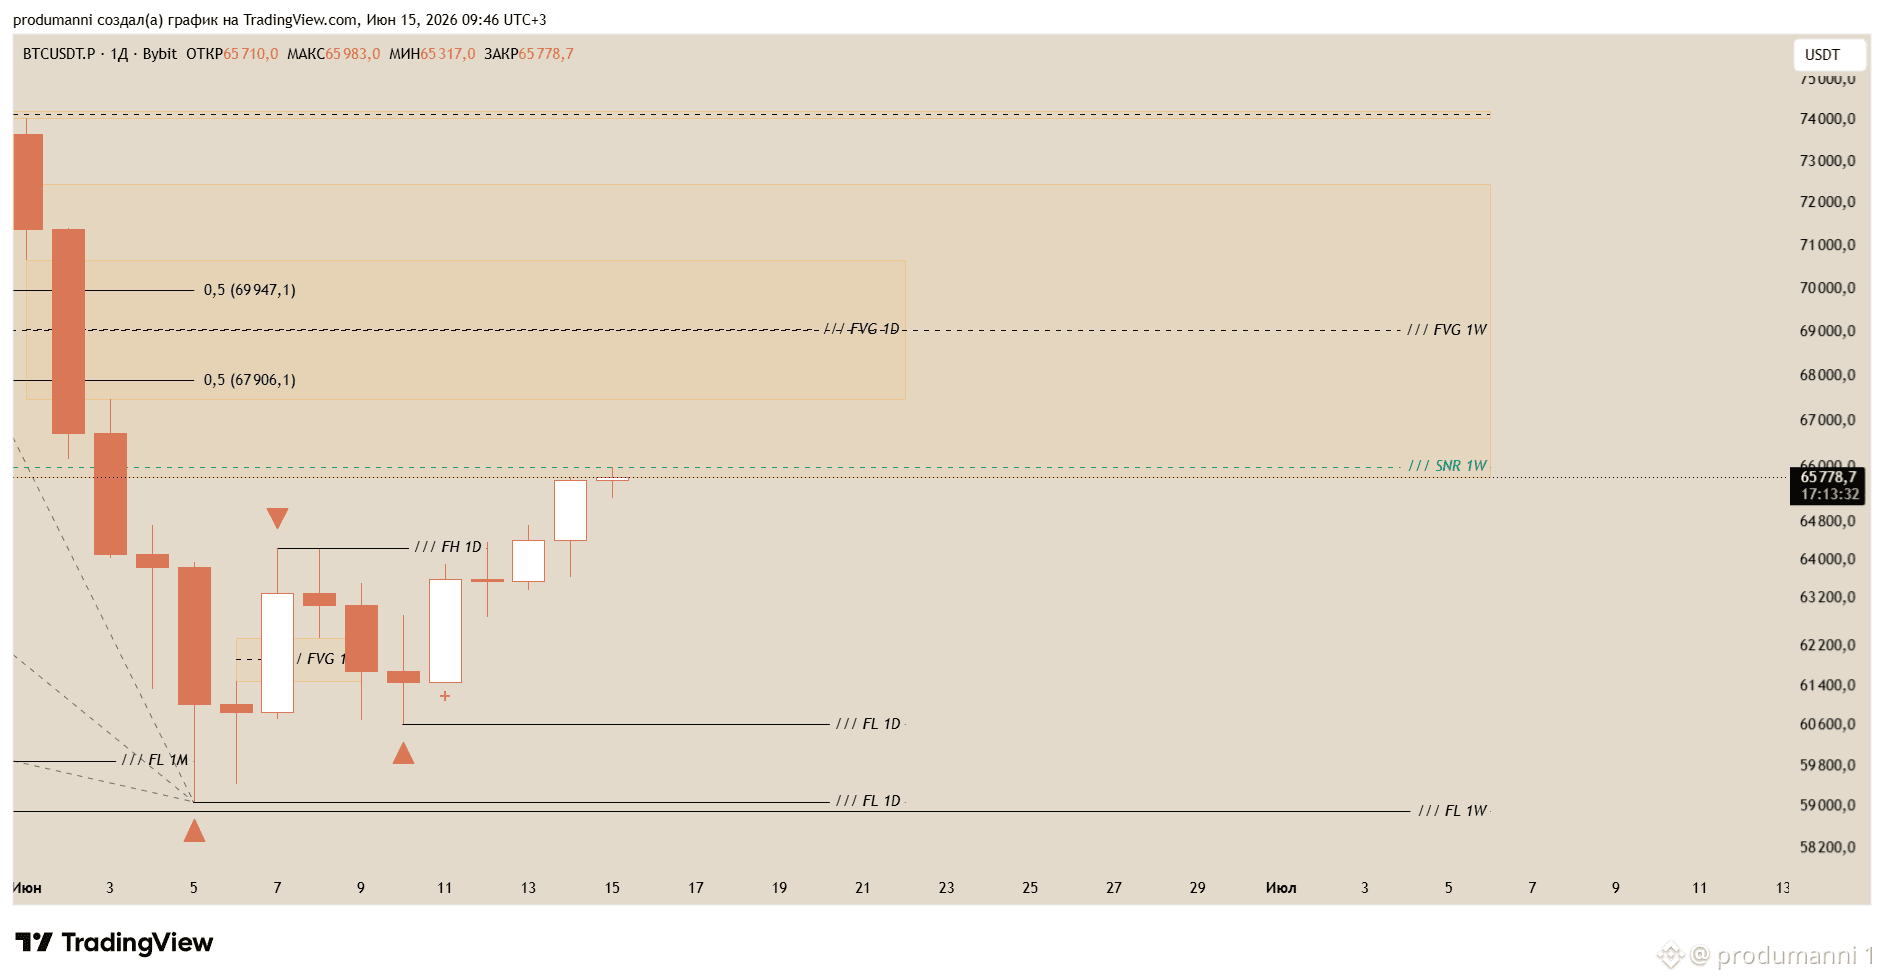
前回のレビューで述べたように、今週の月曜日はより明確な状況を示しました: 週次FVGとSNRブロックが形成されました。したがって、現在のバウンスは$65,990 - $82,811の範囲のどこかで終了すると言えます ↓
現在のインパルスは1D VCで始まったため、1D VCによって無効化される可能性もあります。これは週次のオーダーフローと一致します。簡単に言うと、$65,990 - $82,811の範囲からのベアリッシュなデイリーVC、そしておそらく$65,990 - $72,460のよりタイトなゾーンは、ブルのシナリオを打ち消し、ターゲットを少なくともまだ未充填の$58,900フラクタルに向けさせます。これが次の1-2週間の主要なトレードアイデアです。
主要なPOI内には、売り手の1D VCが期待される場所があり、私が言及し続けているアルゴリズミックレベルがあります。今のところ、それは強いレジスタンスです。単なるレジスタンスではなく、コンクリートの壁です。そのレベルは$68,389です。
$BTC
前回のレビューで述べたように、今週の月曜日はより明確な状況を示しました: 週次FVGとSNRブロックが形成されました。したがって、現在のバウンスは$65,990 - $82,811の範囲のどこかで終了すると言えます ↓
現在のインパルスは1D VCで始まったため、1D VCによって無効化される可能性もあります。これは週次のオーダーフローと一致します。簡単に言うと、$65,990 - $82,811の範囲からのベアリッシュなデイリーVC、そしておそらく$65,990 - $72,460のよりタイトなゾーンは、ブルのシナリオを打ち消し、ターゲットを少なくともまだ未充填の$58,900フラクタルに向けさせます。これが次の1-2週間の主要なトレードアイデアです。
主要なPOI内には、売り手の1D VCが期待される場所があり、私が言及し続けているアルゴリズミックレベルがあります。今のところ、それは強いレジスタンスです。単なるレジスタンスではなく、コンクリートの壁です。そのレベルは$68,389です。
前回のレビューで述べたように、今週の月曜日はより明確な状況を示しました: 週次FVGとSNRブロックが形成されました。したがって、現在のバウンスは$65,990 - $82,811の範囲のどこかで終了すると言えます ↓
現在のインパルスは1D VCで始まったため、1D VCによって無効化される可能性もあります。これは週次のオーダーフローと一致します。簡単に言うと、$65,990 - $82,811の範囲からのベアリッシュなデイリーVC、そしておそらく$65,990 - $72,460のよりタイトなゾーンは、ブルのシナリオを打ち消し、ターゲットを少なくともまだ未充填の$58,900フラクタルに向けさせます。これが次の1-2週間の主要なトレードアイデアです。
主要なPOI内には、売り手の1D VCが期待される場所があり、私が言及し続けているアルゴリズミックレベルがあります。今のところ、それは強いレジスタンスです。単なるレジスタンスではなく、コンクリートの壁です。そのレベルは$68,389です。
79
·
--
少しだけ$BTCサイクル論理
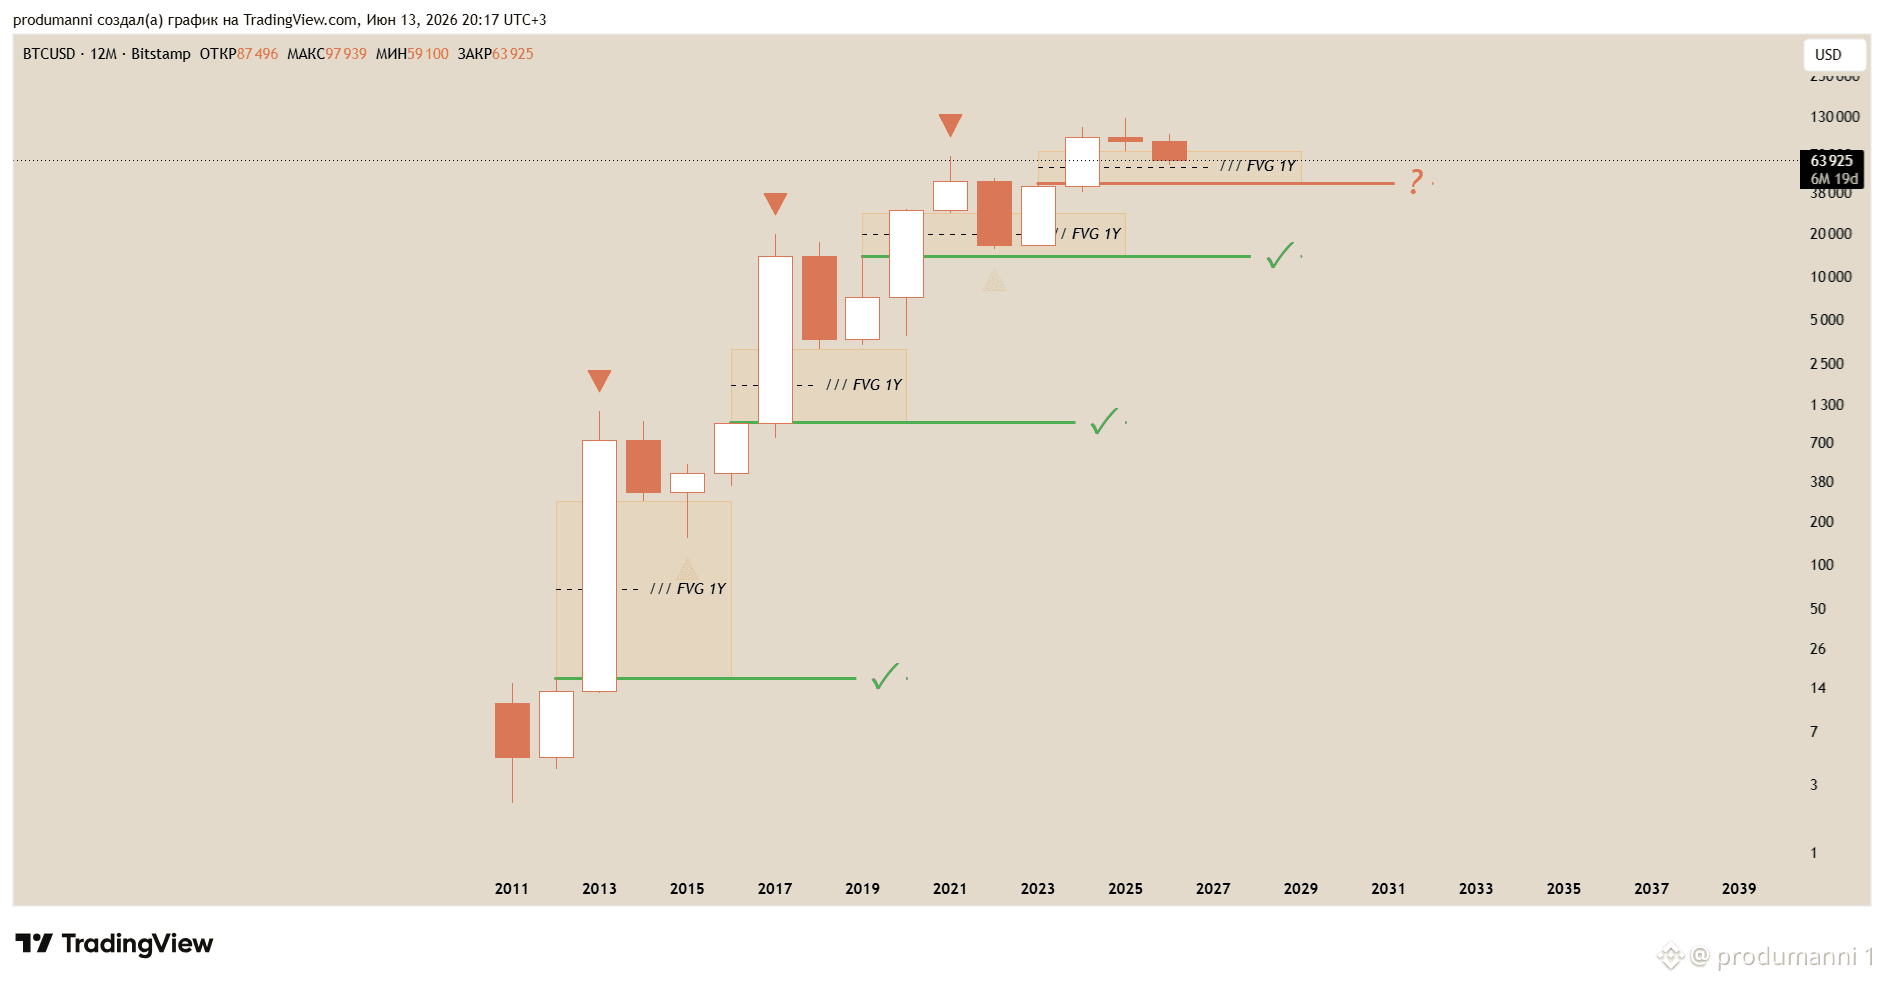
ベア相場では、各サイクルの価格は特定のチャートレベルを下回ることはありません。ここで話しているのは、ブル相場中に形成された年間FVGの下限です。
私たちが注目している年間FVGは$74,434 - $44,729で示されています。下端はメインプランにぴったり合っており、$50k - $45kの範囲でボトムが見つかるというコアアイデアを強化しています。
少しだけ$BTCサイクル論理
ベア相場では、各サイクルの価格は特定のチャートレベルを下回ることはありません。ここで話しているのは、ブル相場中に形成された年間FVGの下限です。
私たちが注目している年間FVGは$74,434 - $44,729で示されています。下端はメインプランにぴったり合っており、$50k - $45kの範囲でボトムが見つかるというコアアイデアを強化しています。
ベア相場では、各サイクルの価格は特定のチャートレベルを下回ることはありません。ここで話しているのは、ブル相場中に形成された年間FVGの下限です。
私たちが注目している年間FVGは$74,434 - $44,729で示されています。下端はメインプランにぴったり合っており、$50k - $45kの範囲でボトムが見つかるというコアアイデアを強化しています。
76

·
--
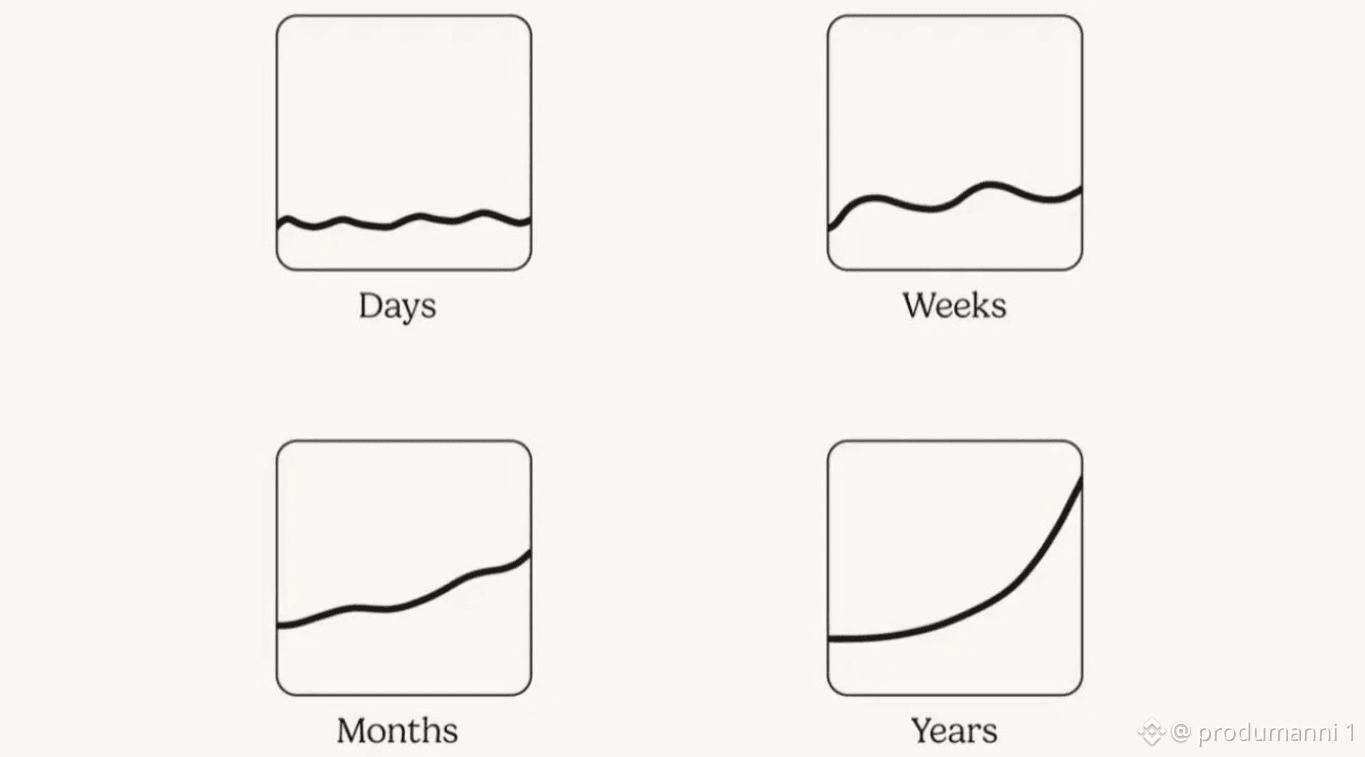
これ、実際に重要なんだ。正しい時間枠でのトレードが大事なんだよ。LTFとHTFでは、同時に逆のトレンドが存在することもある。市場はフラクタルなんだ。すべての市場の瞬間は、同じ方向を指し示すローカルオーダーフローの構造のネスティングドールなんだ。例えば、週や月のグローバルなナラティブがベアリッシュであっても、日や4Hのローカルなナラティブがカウンタートレンドのバウンスを作り出していることがある。その瞬間、1Hと15mがそのバウンスのターンを形成し始めるんだけど、またベアリッシュの優先でそれを読み取る必要がある。結局、テクニカル分析はしばしば一つの質問に帰結するんだ:価格アクションはトレンドを維持するのか、それとも平均に戻るのか。だからトレンドのディシプリンがすごく重要なんだ。それが本当の方向を尊重させるんだ。15mのVCを買ってから1Mのターゲットを探すのはバカみたいだよね?だから"買うか売るか?"という問いに対する正しい答えは、常に「今、どの時間枠について聞いているの?」ってことなんだ。月単位か年単位で考えているのか、今の話をしているのか。
これ、実際に重要なんだ。正しい時間枠でのトレードが大事なんだよ。LTFとHTFでは、同時に逆のトレンドが存在することもある。市場はフラクタルなんだ。すべての市場の瞬間は、同じ方向を指し示すローカルオーダーフローの構造のネスティングドールなんだ。例えば、週や月のグローバルなナラティブがベアリッシュであっても、日や4Hのローカルなナラティブがカウンタートレンドのバウンスを作り出していることがある。その瞬間、1Hと15mがそのバウンスのターンを形成し始めるんだけど、またベアリッシュの優先でそれを読み取る必要がある。結局、テクニカル分析はしばしば一つの質問に帰結するんだ:価格アクションはトレンドを維持するのか、それとも平均に戻るのか。だからトレンドのディシプリンがすごく重要なんだ。それが本当の方向を尊重させるんだ。15mのVCを買ってから1Mのターゲットを探すのはバカみたいだよね?だから"買うか売るか?"という問いに対する正しい答えは、常に「今、どの時間枠について聞いているの?」ってことなんだ。月単位か年単位で考えているのか、今の話をしているのか。
61
·
--
逆トレンドの瞬間 | 週次 $BTC レビュー
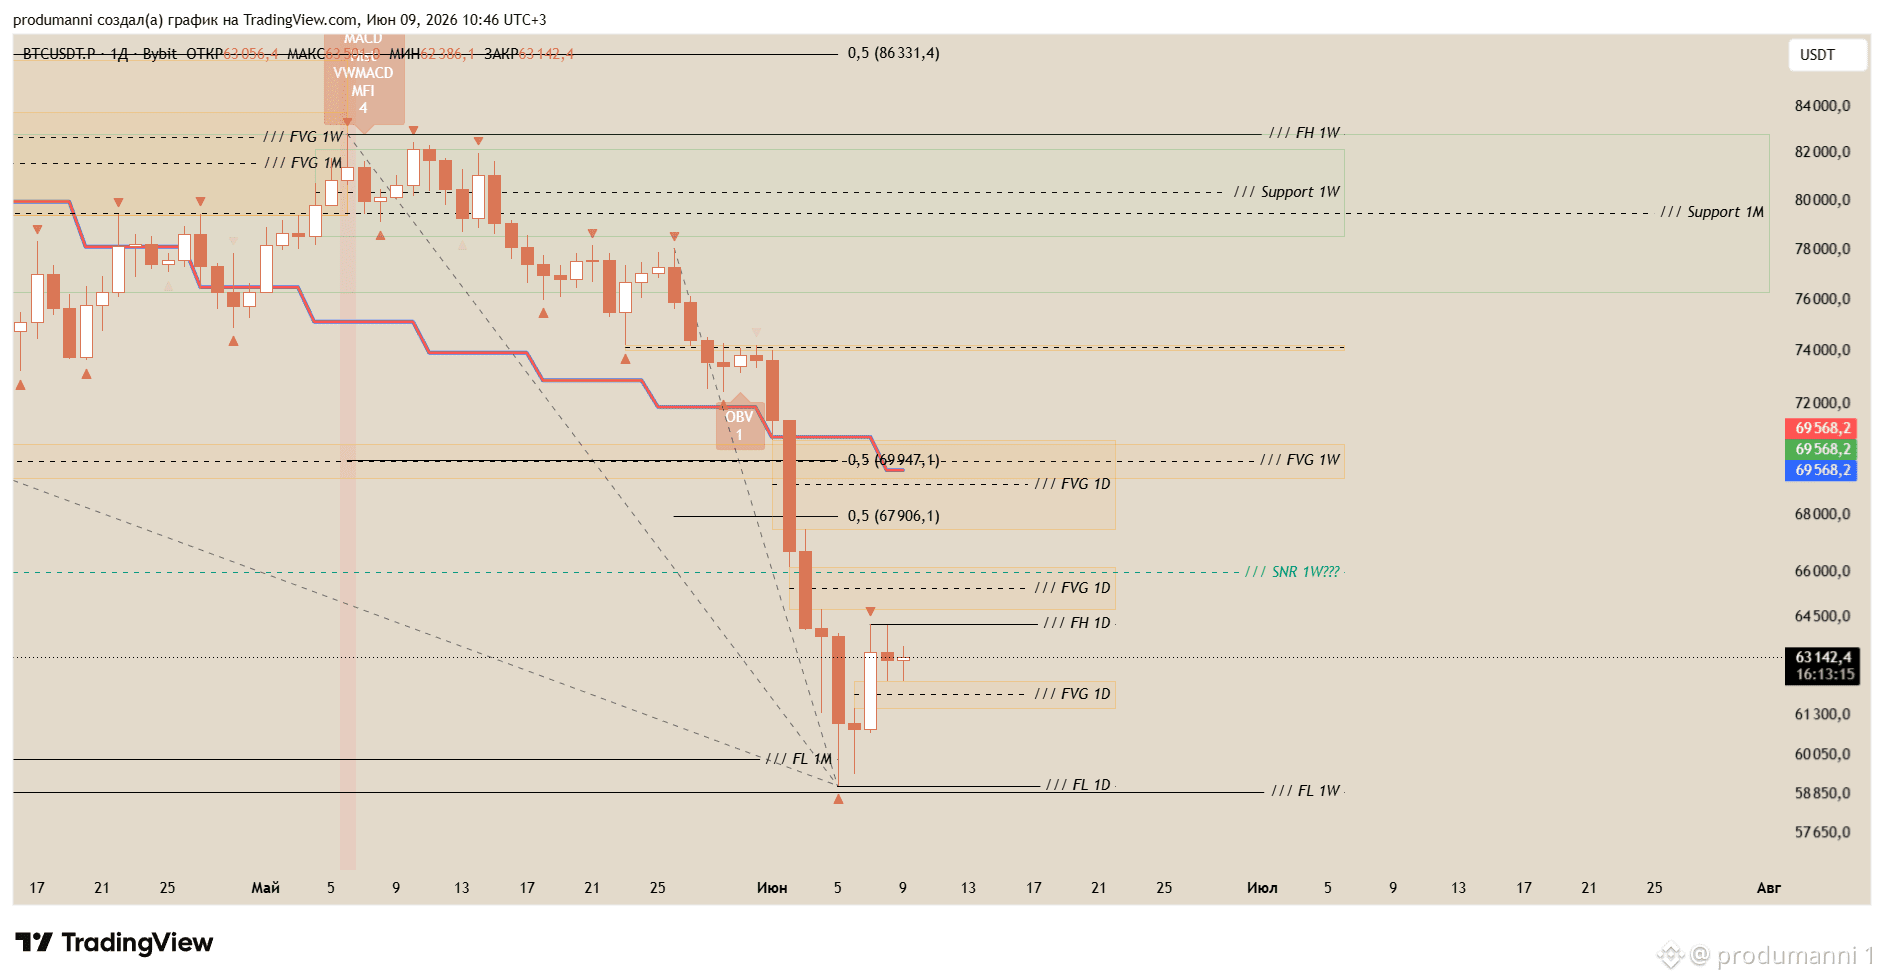
いつものように、理論のリマインダーです。ターゲットへのデリバリーは、X-1タイムフレームでのVCによって確認されます。ここでXはターゲットタイムフレーム自体です。今のところ、主なナラティブは月足タイムフレームでベアです。現在のターゲットは月次要素です。これらの要素のいずれかから週次VCが入るまで、主な下落ナラティブは完了したとは言えず、価格アクションはより低い要素を目指し続けます。もし低タイムフレームのVCが現れれば、例えば1Dで最近起こったように、それは下落トレンドの中での反発です ↓
月次のオーダーフローは主に月次および週次要素を指しています。昨日のキャンドルクローズは、有効なボリュームデルタを伴ったデイリーバイヤーFVGを形成しました。これはボリュームが実際に入ってきたことを示しています。この動きのターゲットは週次要素の中で見つける必要があります。最初のものは、$70,500 - $69,300の範囲にある逆FVGです。その範囲の真ん中には、全体の下落インパルスの0.5レベルと、主要なアルゴリズムの反発レベルが位置しています。
私は現在のトレードアイデアの主なターゲットとして$70k近くのエリアをマークしています。ここで重要な点は3つです:
1. デイリーおよび4Hタイムフレームでのトレードにおいて、ロングは逆トレンドです。したがって、バイサイドで作業したい場合は、1Hが適切なプレイグラウンドです。
2. このアイデアは、デイリーフレームで売り手VCを持ち込む任意のデイリー要素によって無効化される可能性があります。それは$65,000近くのエリアかもしれません。
3. 今週のクローズは新しい1W FVGを形成する可能性が高く、それが価格が下落を続けるための最初の週次要素になります。もし週が$66,000未満でクローズすれば、週次SNRも形成されます。
したがって、次の月曜日にははっきりした状況が得られるはずです。とりあえず、HTFでは仕事はシンプルです:ショートを開きたい場合は高いレベルを待つか、価格がその高いレベルに移動する際にLTFでエントリーを見つけようとしてください。 #btc #bitcoin #trading #smartmoney #tda
逆トレンドの瞬間 | 週次 $BTC レビュー
いつものように、理論のリマインダーです。ターゲットへのデリバリーは、X-1タイムフレームでのVCによって確認されます。ここでXはターゲットタイムフレーム自体です。今のところ、主なナラティブは月足タイムフレームでベアです。現在のターゲットは月次要素です。これらの要素のいずれかから週次VCが入るまで、主な下落ナラティブは完了したとは言えず、価格アクションはより低い要素を目指し続けます。もし低タイムフレームのVCが現れれば、例えば1Dで最近起こったように、それは下落トレンドの中での反発です ↓
月次のオーダーフローは主に月次および週次要素を指しています。昨日のキャンドルクローズは、有効なボリュームデルタを伴ったデイリーバイヤーFVGを形成しました。これはボリュームが実際に入ってきたことを示しています。この動きのターゲットは週次要素の中で見つける必要があります。最初のものは、$70,500 - $69,300の範囲にある逆FVGです。その範囲の真ん中には、全体の下落インパルスの0.5レベルと、主要なアルゴリズムの反発レベルが位置しています。
私は現在のトレードアイデアの主なターゲットとして$70k近くのエリアをマークしています。ここで重要な点は3つです:
1. デイリーおよび4Hタイムフレームでのトレードにおいて、ロングは逆トレンドです。したがって、バイサイドで作業したい場合は、1Hが適切なプレイグラウンドです。
2. このアイデアは、デイリーフレームで売り手VCを持ち込む任意のデイリー要素によって無効化される可能性があります。それは$65,000近くのエリアかもしれません。
3. 今週のクローズは新しい1W FVGを形成する可能性が高く、それが価格が下落を続けるための最初の週次要素になります。もし週が$66,000未満でクローズすれば、週次SNRも形成されます。
したがって、次の月曜日にははっきりした状況が得られるはずです。とりあえず、HTFでは仕事はシンプルです:ショートを開きたい場合は高いレベルを待つか、価格がその高いレベルに移動する際にLTFでエントリーを見つけようとしてください。 #btc #bitcoin #trading #smartmoney #tda
いつものように、理論のリマインダーです。ターゲットへのデリバリーは、X-1タイムフレームでのVCによって確認されます。ここでXはターゲットタイムフレーム自体です。今のところ、主なナラティブは月足タイムフレームでベアです。現在のターゲットは月次要素です。これらの要素のいずれかから週次VCが入るまで、主な下落ナラティブは完了したとは言えず、価格アクションはより低い要素を目指し続けます。もし低タイムフレームのVCが現れれば、例えば1Dで最近起こったように、それは下落トレンドの中での反発です ↓
月次のオーダーフローは主に月次および週次要素を指しています。昨日のキャンドルクローズは、有効なボリュームデルタを伴ったデイリーバイヤーFVGを形成しました。これはボリュームが実際に入ってきたことを示しています。この動きのターゲットは週次要素の中で見つける必要があります。最初のものは、$70,500 - $69,300の範囲にある逆FVGです。その範囲の真ん中には、全体の下落インパルスの0.5レベルと、主要なアルゴリズムの反発レベルが位置しています。
私は現在のトレードアイデアの主なターゲットとして$70k近くのエリアをマークしています。ここで重要な点は3つです:
1. デイリーおよび4Hタイムフレームでのトレードにおいて、ロングは逆トレンドです。したがって、バイサイドで作業したい場合は、1Hが適切なプレイグラウンドです。
2. このアイデアは、デイリーフレームで売り手VCを持ち込む任意のデイリー要素によって無効化される可能性があります。それは$65,000近くのエリアかもしれません。
3. 今週のクローズは新しい1W FVGを形成する可能性が高く、それが価格が下落を続けるための最初の週次要素になります。もし週が$66,000未満でクローズすれば、週次SNRも形成されます。
したがって、次の月曜日にははっきりした状況が得られるはずです。とりあえず、HTFでは仕事はシンプルです:ショートを開きたい場合は高いレベルを待つか、価格がその高いレベルに移動する際にLTFでエントリーを見つけようとしてください。 #btc #bitcoin #trading #smartmoney #tda
95
·
--
購入のための広告の分 | $BTC
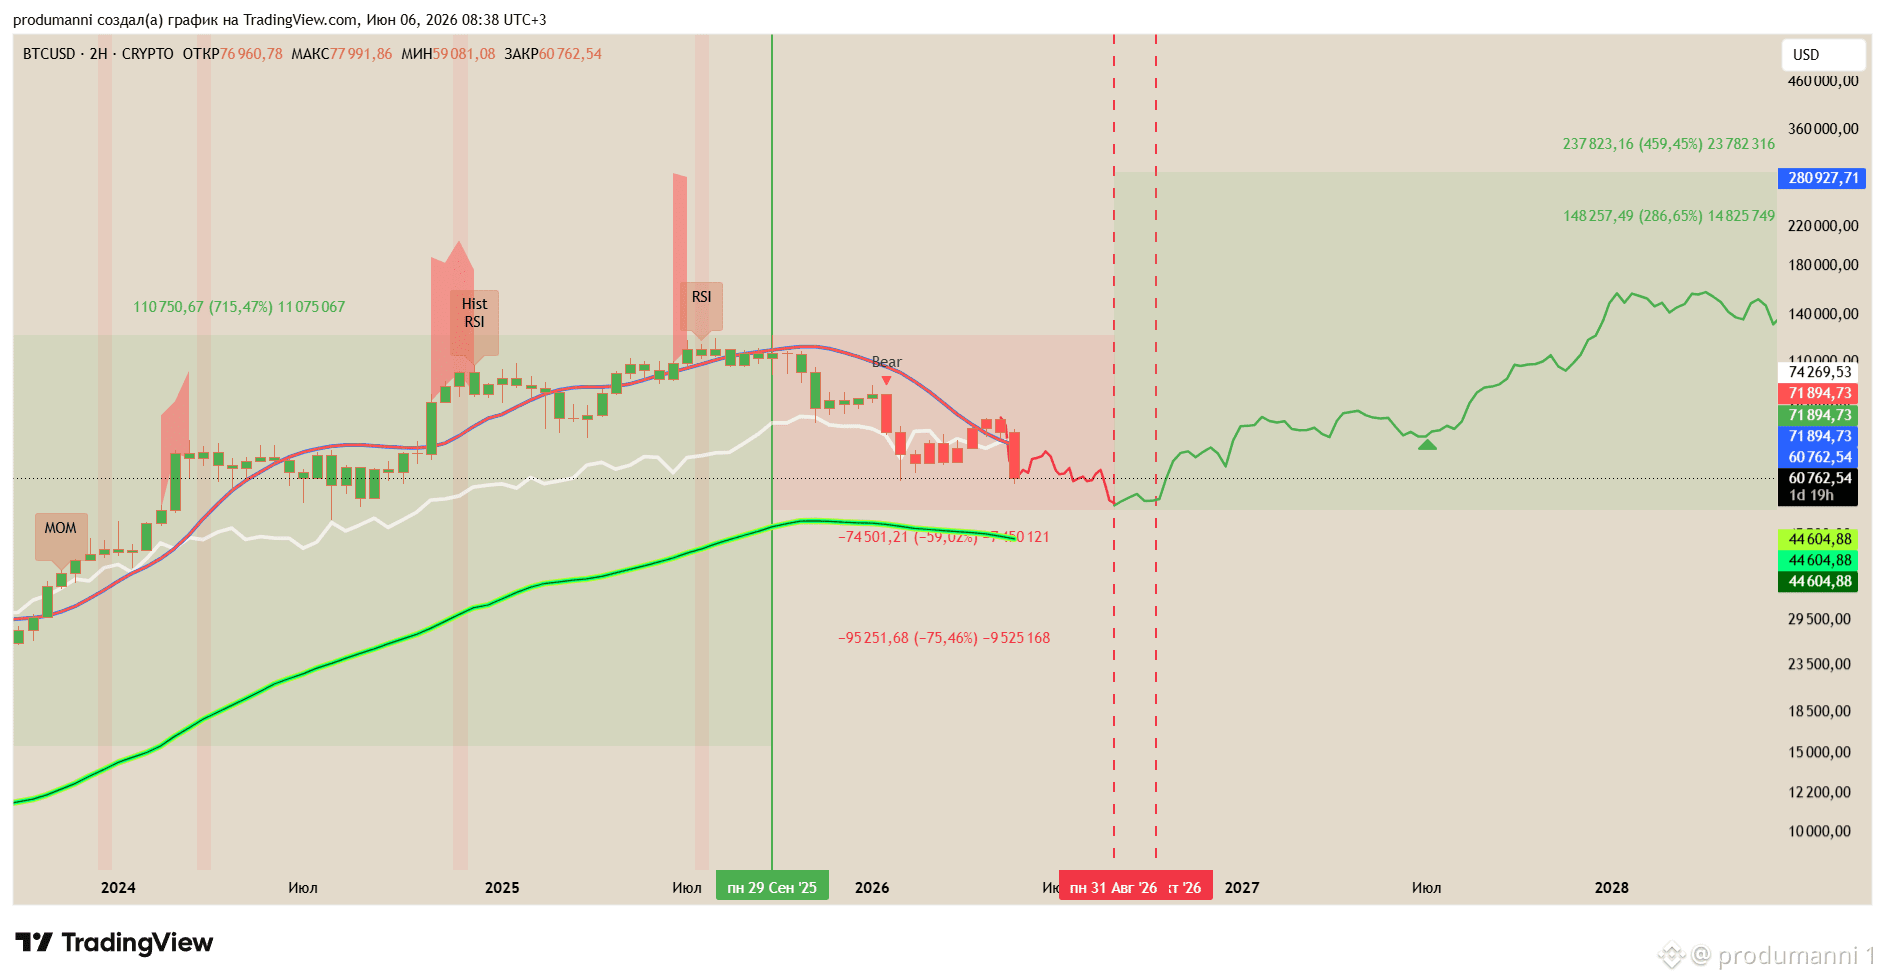
ビットコインは$60,000を一気に突破し、10日間で30%の急落を記録し、3ヶ月間の逆トレンドムーブを開始した安値を消し去りました。
私のポリマーケットのベットはすでに70%の未実現利益があります。私は何度も言ってきましたが、もう一回はっきりしたインパルスが来るでしょう(ここ、ここ、その他もろもろ)。
今サイクルのベアフェーズの約73%が終了しました。私は9月4日から10月26日までのボトムウィンドウをマークしました。その計算方法は何度も説明しています(ここ)。サイクルのタイミングに矛盾するものは見当たりません。すべてがまだ整っていて、血のようなバスセッションやトリガーの数も同様です。時間と行動のサイクルがまだ intact であれば、価格サイクルが無視される理由はありません ↓
私はすべてのベアフェーズをパーセンテージで一つのモデルにまとめました。その中のいくつかのシステムが許容される最小および最大の下落を吐き出しました。それを-59%と-75%としてマッピングしました。価格では、$51,700から$31,000の範囲です ↓
その範囲内で1,000ドルの深さが増すごとに、前のものよりも可能性が低くなります。サイクルの底を見つけるための純粋な数学式に加えて、サイクルごとに再び当たる特定のインディケーターからのヒントもあります。例えば、$45,000は毎回のサイクルで正確なボトムを予測したインディケーターのレベルです ↓
$45,000が基準です。日付のウィンドウとパーセンテージの下落範囲が基本的なルールです。これらのうち少なくとも2つを組み合わせて購入判断を行います:日付範囲とパーセンテージ範囲、例えば9月10日の$51,000のように。または、再度日付範囲を加えた$45,000のインディケーター。要点は明確です。私の基本シナリオは、ボトムウィンドウが開く前に安値が設定されるということです。
購入のための広告の分 | $BTC
ビットコインは$60,000を一気に突破し、10日間で30%の急落を記録し、3ヶ月間の逆トレンドムーブを開始した安値を消し去りました。
私のポリマーケットのベットはすでに70%の未実現利益があります。私は何度も言ってきましたが、もう一回はっきりしたインパルスが来るでしょう(ここ、ここ、その他もろもろ)。
今サイクルのベアフェーズの約73%が終了しました。私は9月4日から10月26日までのボトムウィンドウをマークしました。その計算方法は何度も説明しています(ここ)。サイクルのタイミングに矛盾するものは見当たりません。すべてがまだ整っていて、血のようなバスセッションやトリガーの数も同様です。時間と行動のサイクルがまだ intact であれば、価格サイクルが無視される理由はありません ↓
私はすべてのベアフェーズをパーセンテージで一つのモデルにまとめました。その中のいくつかのシステムが許容される最小および最大の下落を吐き出しました。それを-59%と-75%としてマッピングしました。価格では、$51,700から$31,000の範囲です ↓
その範囲内で1,000ドルの深さが増すごとに、前のものよりも可能性が低くなります。サイクルの底を見つけるための純粋な数学式に加えて、サイクルごとに再び当たる特定のインディケーターからのヒントもあります。例えば、$45,000は毎回のサイクルで正確なボトムを予測したインディケーターのレベルです ↓
$45,000が基準です。日付のウィンドウとパーセンテージの下落範囲が基本的なルールです。これらのうち少なくとも2つを組み合わせて購入判断を行います:日付範囲とパーセンテージ範囲、例えば9月10日の$51,000のように。または、再度日付範囲を加えた$45,000のインディケーター。要点は明確です。私の基本シナリオは、ボトムウィンドウが開く前に安値が設定されるということです。
ビットコインは$60,000を一気に突破し、10日間で30%の急落を記録し、3ヶ月間の逆トレンドムーブを開始した安値を消し去りました。
私のポリマーケットのベットはすでに70%の未実現利益があります。私は何度も言ってきましたが、もう一回はっきりしたインパルスが来るでしょう(ここ、ここ、その他もろもろ)。
今サイクルのベアフェーズの約73%が終了しました。私は9月4日から10月26日までのボトムウィンドウをマークしました。その計算方法は何度も説明しています(ここ)。サイクルのタイミングに矛盾するものは見当たりません。すべてがまだ整っていて、血のようなバスセッションやトリガーの数も同様です。時間と行動のサイクルがまだ intact であれば、価格サイクルが無視される理由はありません ↓
私はすべてのベアフェーズをパーセンテージで一つのモデルにまとめました。その中のいくつかのシステムが許容される最小および最大の下落を吐き出しました。それを-59%と-75%としてマッピングしました。価格では、$51,700から$31,000の範囲です ↓
その範囲内で1,000ドルの深さが増すごとに、前のものよりも可能性が低くなります。サイクルの底を見つけるための純粋な数学式に加えて、サイクルごとに再び当たる特定のインディケーターからのヒントもあります。例えば、$45,000は毎回のサイクルで正確なボトムを予測したインディケーターのレベルです ↓
$45,000が基準です。日付のウィンドウとパーセンテージの下落範囲が基本的なルールです。これらのうち少なくとも2つを組み合わせて購入判断を行います:日付範囲とパーセンテージ範囲、例えば9月10日の$51,000のように。または、再度日付範囲を加えた$45,000のインディケーター。要点は明確です。私の基本シナリオは、ボトムウィンドウが開く前に安値が設定されるということです。
82
ログインして、さらにコンテンツを読む
厳選トピックで世界の暗号資産トレーダーの仲間入り
⚡️ 暗号資産に関する最新かつ有益な情報が見つかります。
💬 世界最大の暗号資産取引所から信頼されています。
👍 認証を受けたクリエイターから、有益なインサイトを得られます。
メール / 電話番号