$NVDAB : NVDAB: Auction Theory Meets Breakout Candles
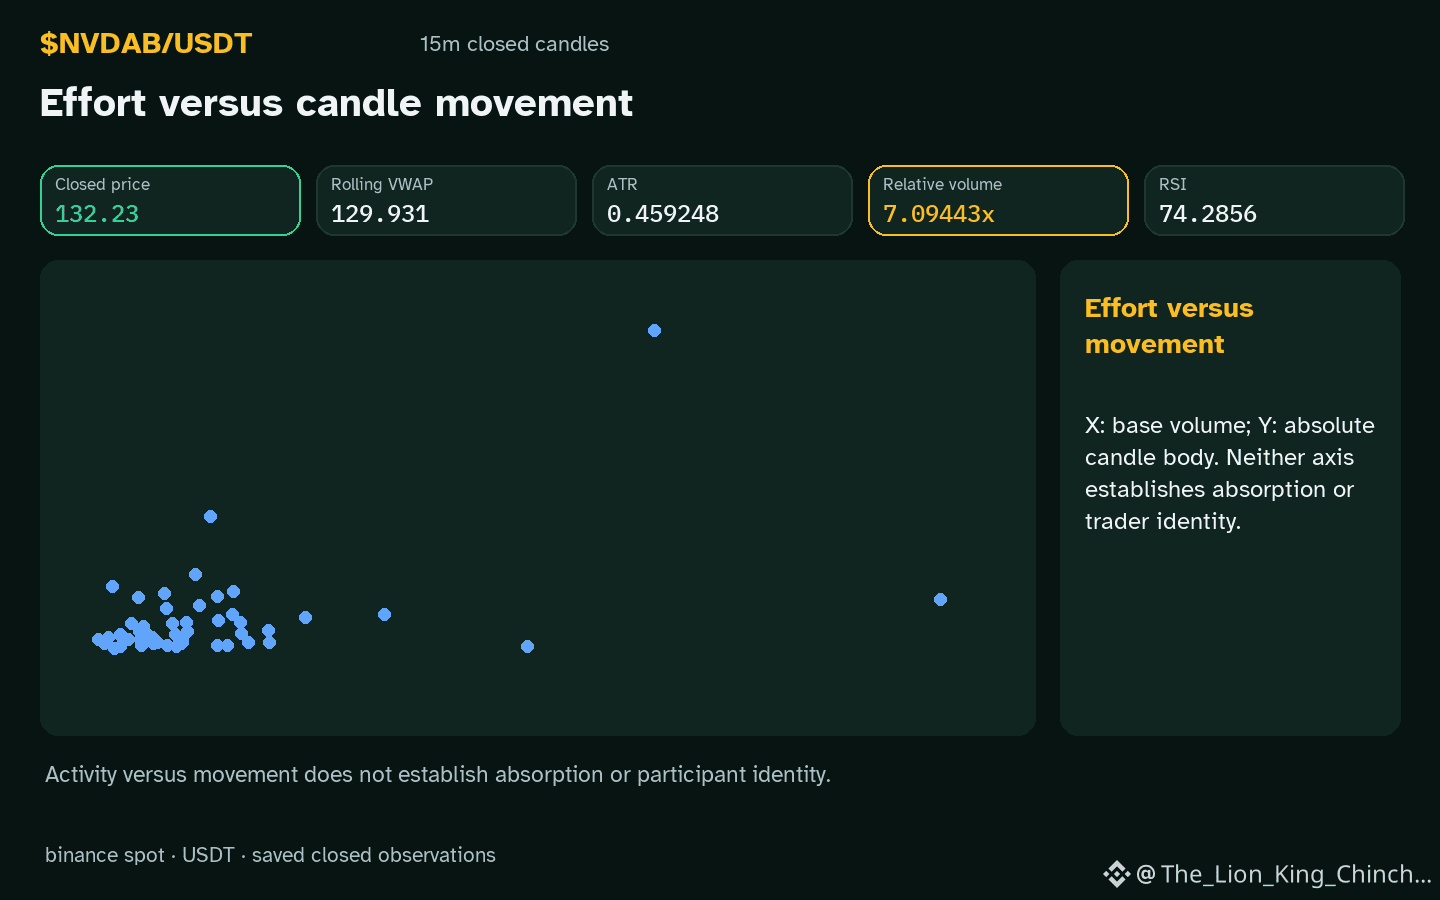
$NVDAB : NVDAB is moving upward while volume sits above its baseline, prompting the question: can live‑auction dynamics help explain a breakout candle? In a traditional auction, each bidder sees the current price and decides whether to raise the bid based on perceived competition. If we treat a candle as a single “round” of bidding, the price at the close represents the final winning bid, while the volume spike reflects how many participants entered the round.
One way to model this is to imagine a sealed‑bid auction where each trader submits a hidden order at the start of the hour. The highest order that clears the market becomes the closing price, and the number of orders that actually execute determines the observed volume. When 7.09x the baseline is observed, it suggests many hidden bids converged, raising the likelihood that the closing price overshoots the prior resistance.
A counterexample would be a candle with modest volume despite a price rise; the same auction analogy would predict fewer participants and a weaker price push. To reassess, watch the next closed hourly candle: if the price retreats while 74.3 stays neutral, the auction‑style explanation loses strength. Conversely, a repeat of high volume and upward price would reinforce the hypothesis without proving causation.
Probabilistic market research, not a recommendation or guaranteed return.
The comparison to keep in mind: $ETH has hourly direction up and volume not above its baseline; $ORCA has hourly direction up and volume above its baseline. This alone does not establish correlation.
#NVDAB #ETH #ORCA #CryptoEducation
$NVDAB : NVDAB is moving upward while volume sits above its baseline, prompting the question: can live‑auction dynamics help explain a breakout candle? In a traditional auction, each bidder sees the current price and decides whether to raise the bid based on perceived competition. If we treat a candle as a single “round” of bidding, the price at the close represents the final winning bid, while the volume spike reflects how many participants entered the round.
One way to model this is to imagine a sealed‑bid auction where each trader submits a hidden order at the start of the hour. The highest order that clears the market becomes the closing price, and the number of orders that actually execute determines the observed volume. When 7.09x the baseline is observed, it suggests many hidden bids converged, raising the likelihood that the closing price overshoots the prior resistance.
A counterexample would be a candle with modest volume despite a price rise; the same auction analogy would predict fewer participants and a weaker price push. To reassess, watch the next closed hourly candle: if the price retreats while 74.3 stays neutral, the auction‑style explanation loses strength. Conversely, a repeat of high volume and upward price would reinforce the hypothesis without proving causation.
Probabilistic market research, not a recommendation or guaranteed return.
The comparison to keep in mind: $ETH has hourly direction up and volume not above its baseline; $ORCA has hourly direction up and volume above its baseline. This alone does not establish correlation.
#NVDAB #ETH #ORCA #CryptoEducation