$RENDER: Leverage and Volume Clues in RENDER
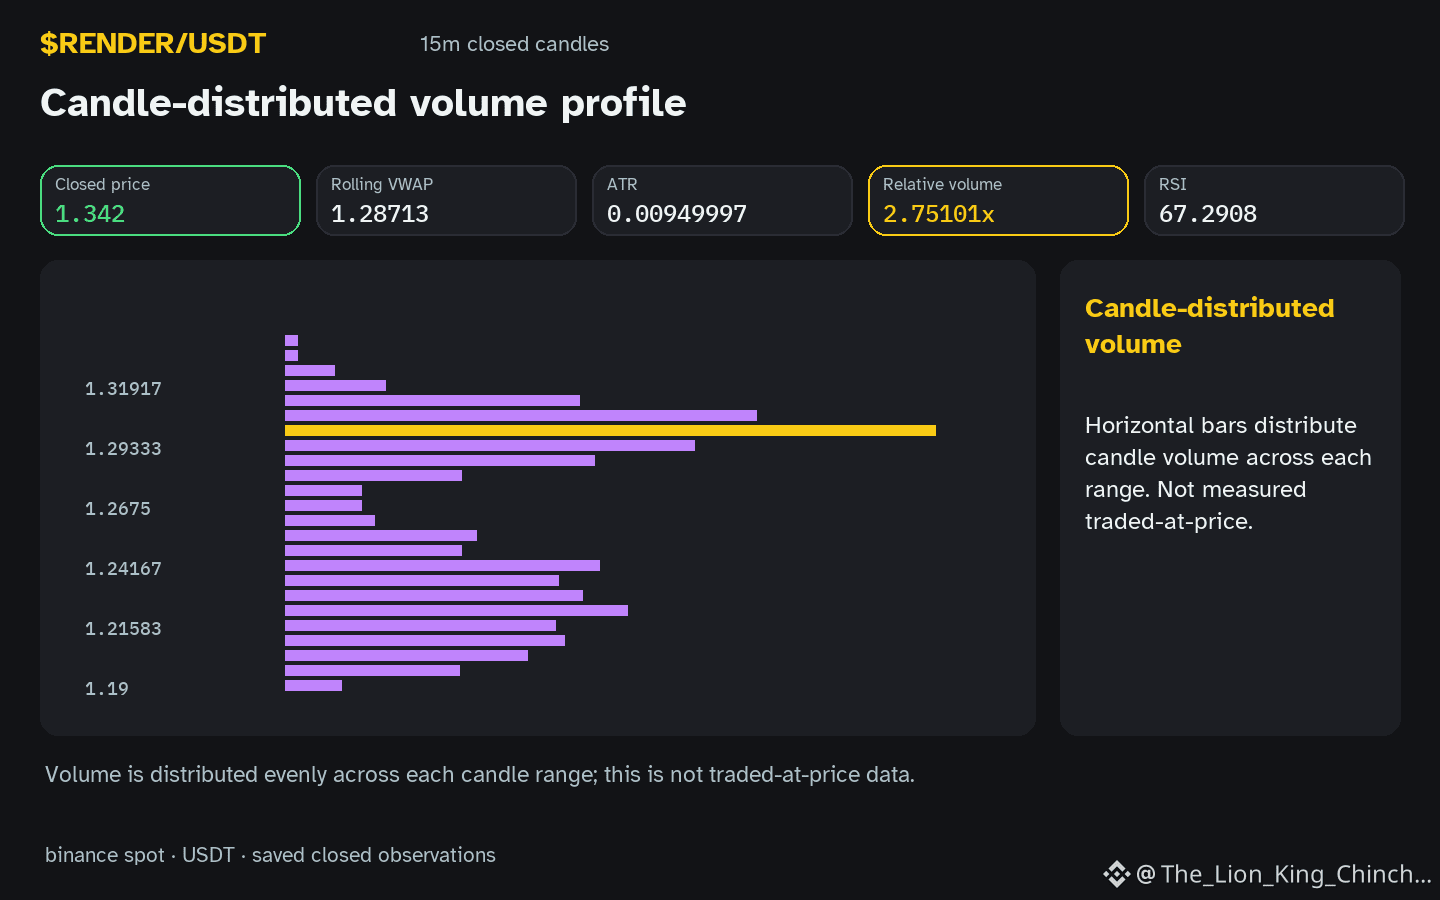
Does the move in $RENDER above local resistance represent a sustainable shift in demand or a transient event? The hourly candle is currently moving up with relative volume at 2.75x the baseline.
### The tempting shortcut
When a price rises above a local barrier like resistance 1.329, it is tempting to assume participants are aggressively accumulating the asset. One might view the increased activity as a sign of organic spot buying. However, if this occurs while the RSI is at 67.3, the move could theoretically be a result of forced repositioning rather than new conviction. In a hypothetical leverage-driven scenario, a small move higher might trigger mechanical closures of short positions, creating a temporary spike in volume that lacks follow-through once the imbalance is settled.
### A more careful interpretation
An alternative reading is that the volume represents a genuine shift in the local range, establishing a new floor. To test this, one can look for price stability above the old resistance 1.329 during periods of declining volume. If the price holds steady despite lower activity, it suggests that the previous move has found a new equilibrium. Conversely, if the price immediately retraces the daily change of 8.92857% as volume fades, the initial move was likely a transient mechanical spike.
### A useful next observation
This interpretation would be weakened if a future closed candle falls back below the current support 1.296 on high volume. Such a development would suggest the move above resistance was a false start rather than a structural change. Reassessing the hourly change of 1.97568% after several sessions helps distinguish a temporary liquidation event from a sustained trend.
Probabilistic market research, not a recommendation or guaranteed return.
#RENDER #MarketAnalysis #CryptoLearning
Does the move in $RENDER above local resistance represent a sustainable shift in demand or a transient event? The hourly candle is currently moving up with relative volume at 2.75x the baseline.
### The tempting shortcut
When a price rises above a local barrier like resistance 1.329, it is tempting to assume participants are aggressively accumulating the asset. One might view the increased activity as a sign of organic spot buying. However, if this occurs while the RSI is at 67.3, the move could theoretically be a result of forced repositioning rather than new conviction. In a hypothetical leverage-driven scenario, a small move higher might trigger mechanical closures of short positions, creating a temporary spike in volume that lacks follow-through once the imbalance is settled.
### A more careful interpretation
An alternative reading is that the volume represents a genuine shift in the local range, establishing a new floor. To test this, one can look for price stability above the old resistance 1.329 during periods of declining volume. If the price holds steady despite lower activity, it suggests that the previous move has found a new equilibrium. Conversely, if the price immediately retraces the daily change of 8.92857% as volume fades, the initial move was likely a transient mechanical spike.
### A useful next observation
This interpretation would be weakened if a future closed candle falls back below the current support 1.296 on high volume. Such a development would suggest the move above resistance was a false start rather than a structural change. Reassessing the hourly change of 1.97568% after several sessions helps distinguish a temporary liquidation event from a sustained trend.
Probabilistic market research, not a recommendation or guaranteed return.
#RENDER #MarketAnalysis #CryptoLearning