
$AAPL Long setup 🟢🚀
Entry 342.50 to 344.50 🎯
TP1 : 350.50
TP2 : 356.90
Stop Loss 339.80.
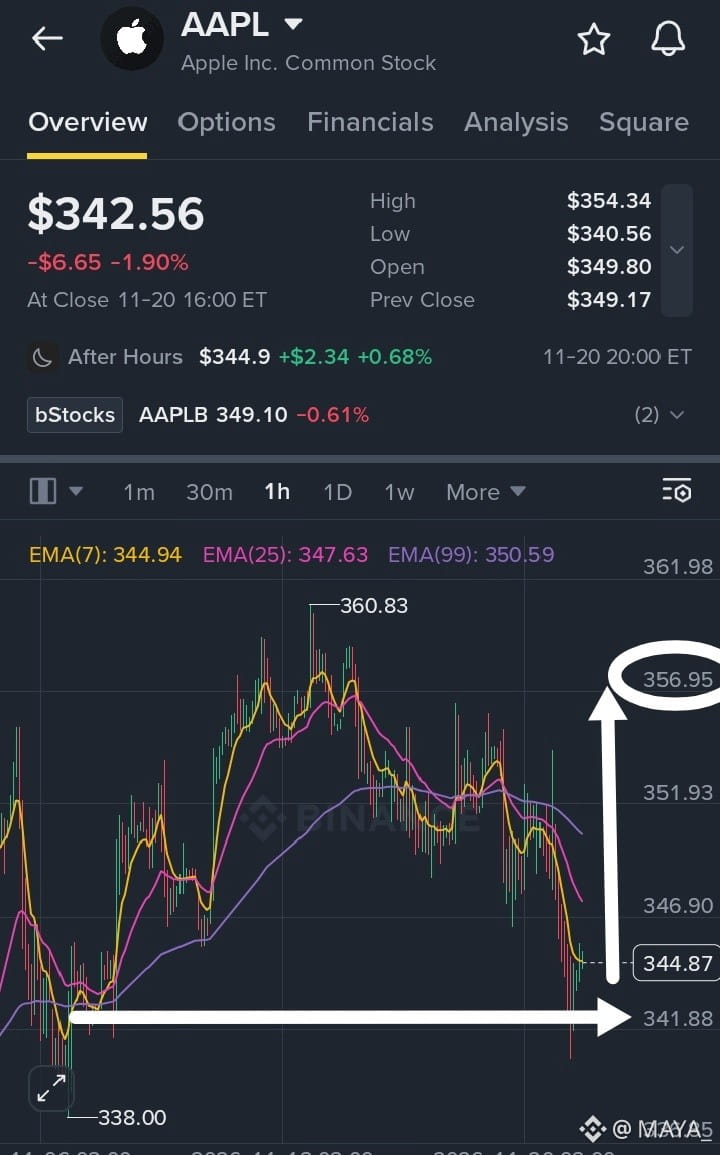
Interesting chart setup on AAPL here after pulling back from that 360.83 spike to around 342.56, with after-hours ticking up near 344.9. Even though price is sitting below the 1h EMAs around 344.94, 347.63, and 350.59, buyers are testing a bounce zone right above 341.88 and aiming toward that 356.95 mark shown on the chart. Short-term momentum looks like a relief bounce play rather than a confirmed breakout, especially with stock tokens and equities feeling mixed pressure. Keep risk tight though because losing 341.88 or slipping back toward 338.00 would spoil the bounce idea fast, so trade carefully and remember this is just chart speculation, not financial advice.
Entry 342.50 to 344.50 🎯
TP1 : 350.50
TP2 : 356.90
Stop Loss 339.80.
Interesting chart setup on AAPL here after pulling back from that 360.83 spike to around 342.56, with after-hours ticking up near 344.9. Even though price is sitting below the 1h EMAs around 344.94, 347.63, and 350.59, buyers are testing a bounce zone right above 341.88 and aiming toward that 356.95 mark shown on the chart. Short-term momentum looks like a relief bounce play rather than a confirmed breakout, especially with stock tokens and equities feeling mixed pressure. Keep risk tight though because losing 341.88 or slipping back toward 338.00 would spoil the bounce idea fast, so trade carefully and remember this is just chart speculation, not financial advice.