$MMT just went parabolic, and now the chart has to prove it can hold.
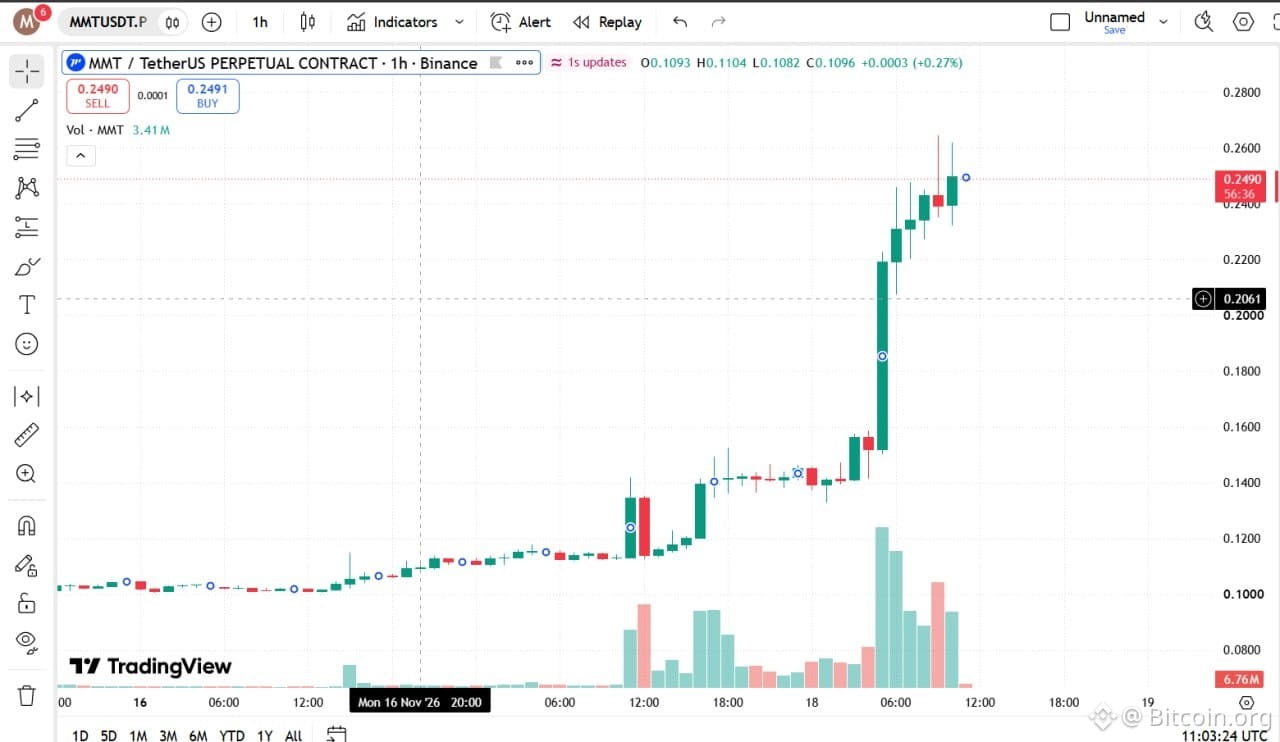
It spent days crawling along the 0.1000 area, then broke out in two stages. The first push stalled around 0.1400, and the second one was a huge green candle that took price straight up toward 0.2500. Price is 0.2490 on the 1h, with a wick near 0.2650 where sellers hit it.
The volume tells the story. It spiked hard on the breakout candle, and the latest bar has cooled off. The candles near the top are getting smaller and the wicks are getting longer, which usually means the market is deciding between a pause and a pullback.
The structure is still bullish while price holds above the breakout zone, and each dip so far has been bought. But a move this vertical can retrace fast, so don't chase the green candle blindly and size carefully.
Level to reclaim is 0.2650, the wick high. Level that breaks the move is 0.2061, the breakout level marked on the chart. Lose it and the move can give back a lot of ground.
$MMT
It spent days crawling along the 0.1000 area, then broke out in two stages. The first push stalled around 0.1400, and the second one was a huge green candle that took price straight up toward 0.2500. Price is 0.2490 on the 1h, with a wick near 0.2650 where sellers hit it.
The volume tells the story. It spiked hard on the breakout candle, and the latest bar has cooled off. The candles near the top are getting smaller and the wicks are getting longer, which usually means the market is deciding between a pause and a pullback.
The structure is still bullish while price holds above the breakout zone, and each dip so far has been bought. But a move this vertical can retrace fast, so don't chase the green candle blindly and size carefully.
Level to reclaim is 0.2650, the wick high. Level that breaks the move is 0.2061, the breakout level marked on the chart. Lose it and the move can give back a lot of ground.
$MMT