$DOT: Candle Volume Versus RSI Signals
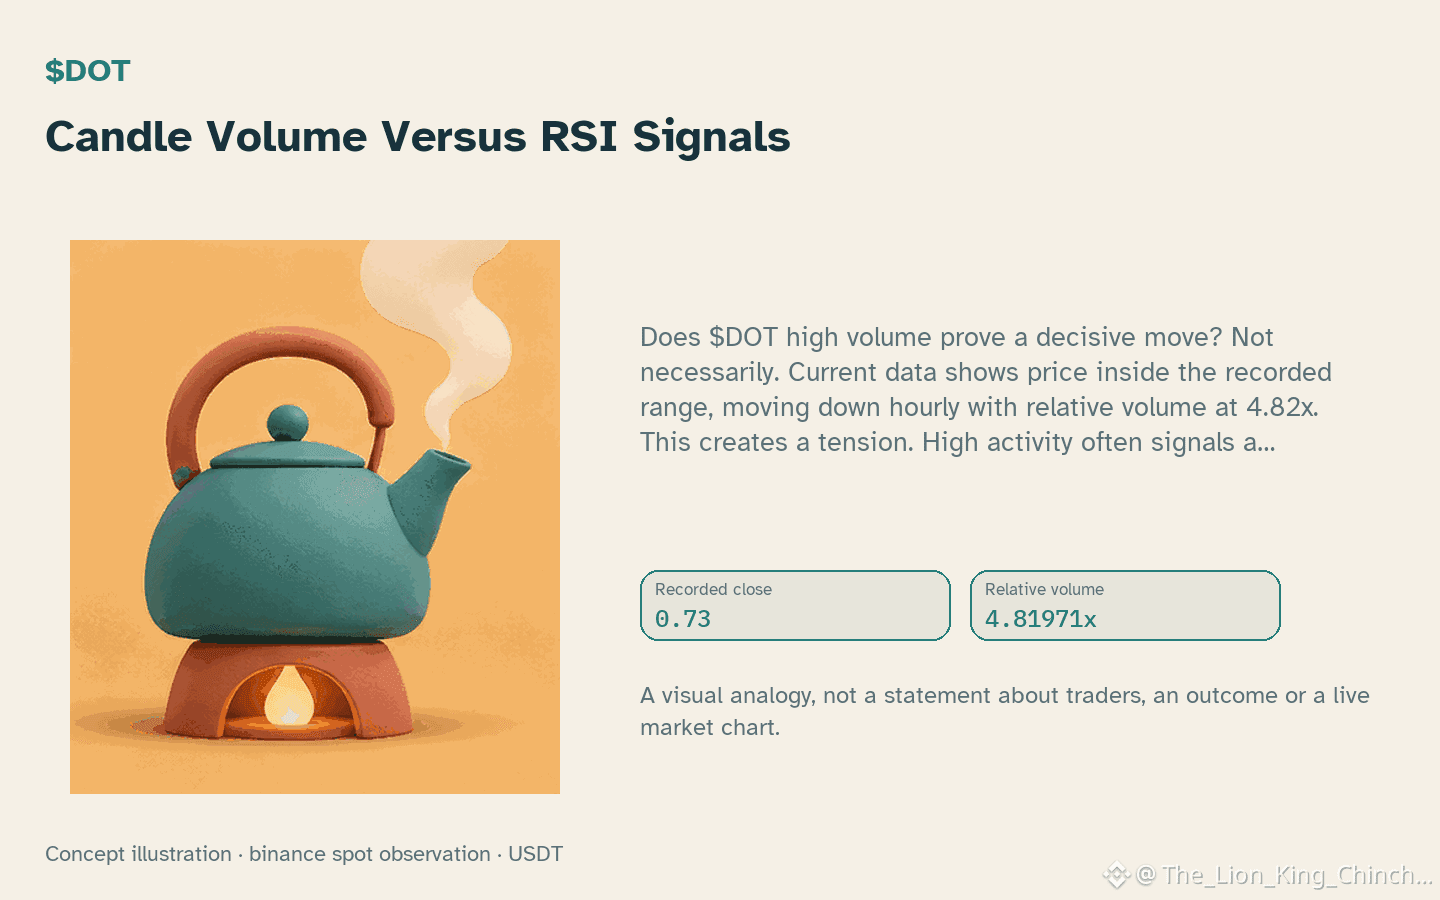
Does $DOT high volume prove a decisive move? Not necessarily. Current data shows price inside the recorded range, moving down hourly with relative volume at 4.82x. This creates a tension. High activity often signals a two-way battle where buyers and sellers exchange ownership rapidly. A hypothetical mechanism suggests that if the closing price stays near the high, the next candle might follow upward. However, this is a guess, not a fact. An alternative reading is that high volume marks a consolidation zone where direction is undecided. A counterexample would be a candle with high volume but a close in the middle, indicating indecision rather than commitment. This weakens the momentum assumption. RSI at 41.3 provides a separate perspective. It measures recent price change speed, not volume. A low RSI during high volume does not automatically mean oversold conditions are ending. The evidence limits are clear. Candles cannot confirm trader motives or order flow depth. Future closed candles will test these ideas. If the next bar closes above resistance, the momentum reading gains support. If it fails and retests support, the consolidation theory becomes more plausible. This reassessment condition helps avoid premature conclusions. Volatility remains high, so patience is required.
Probabilistic market research, not a recommendation or guaranteed return.
#DOT #MarketAnalysis #CryptoLearning
Does $DOT high volume prove a decisive move? Not necessarily. Current data shows price inside the recorded range, moving down hourly with relative volume at 4.82x. This creates a tension. High activity often signals a two-way battle where buyers and sellers exchange ownership rapidly. A hypothetical mechanism suggests that if the closing price stays near the high, the next candle might follow upward. However, this is a guess, not a fact. An alternative reading is that high volume marks a consolidation zone where direction is undecided. A counterexample would be a candle with high volume but a close in the middle, indicating indecision rather than commitment. This weakens the momentum assumption. RSI at 41.3 provides a separate perspective. It measures recent price change speed, not volume. A low RSI during high volume does not automatically mean oversold conditions are ending. The evidence limits are clear. Candles cannot confirm trader motives or order flow depth. Future closed candles will test these ideas. If the next bar closes above resistance, the momentum reading gains support. If it fails and retests support, the consolidation theory becomes more plausible. This reassessment condition helps avoid premature conclusions. Volatility remains high, so patience is required.
Probabilistic market research, not a recommendation or guaranteed return.
#DOT #MarketAnalysis #CryptoLearning