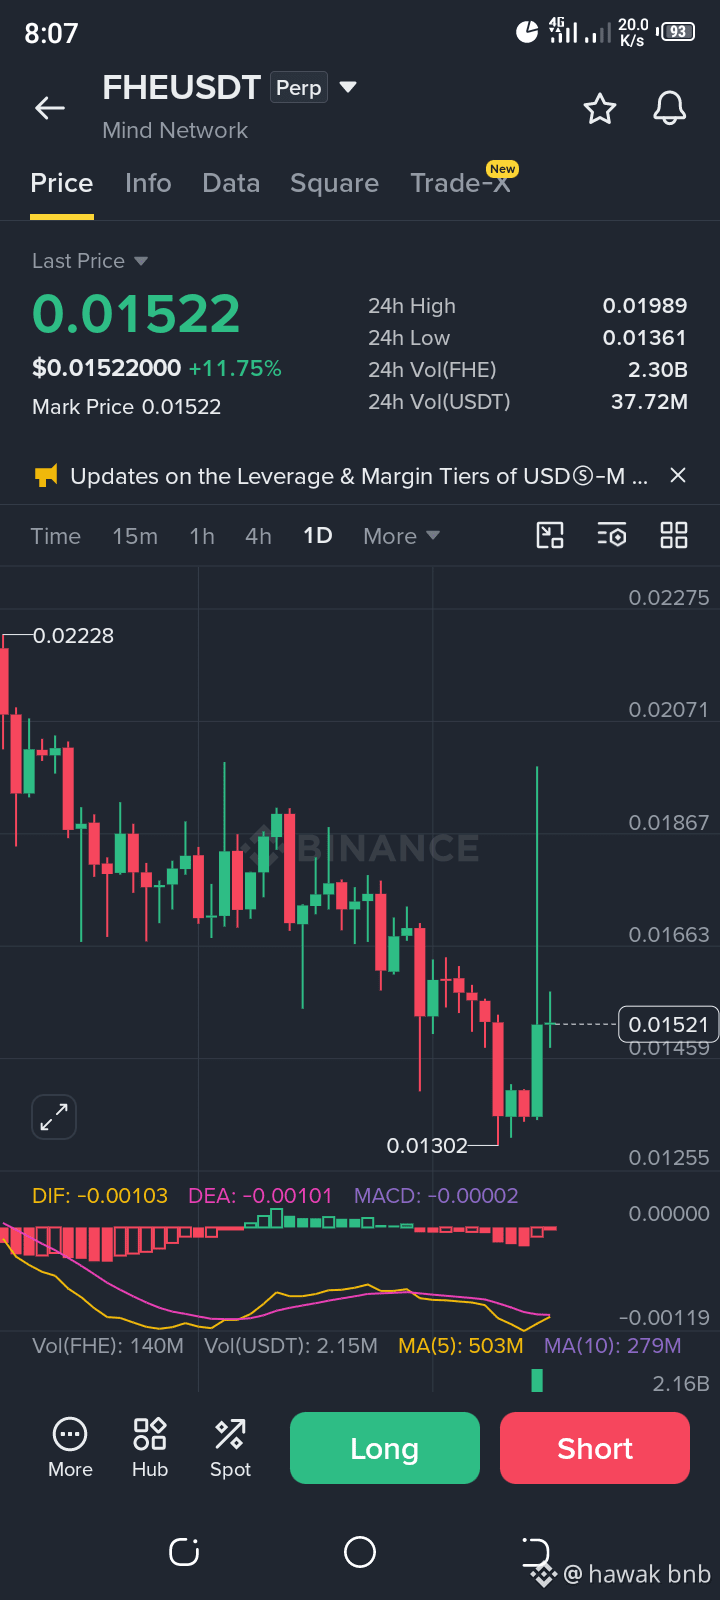
The screenshot illustrates a 1-day (1D) technical candlestick chart for FHE/USDT (Mind Network) on Binance. The current last traded price is $0.01522, reflecting an intraday gain of +11.75%. Following a sustained corrective phase from an earlier local peak of $0.02228 down to a low of $0.01302, the asset has printed a strong green recovery candle, lifting prices toward the mid-range of its recent trading structure.
24-Hour Range & Trading Volume
Over the past 24 hours, FHE registered a low of $0.01361 and a high of $0.01989. Market activity remains substantial, supported by a 24-hour trading volume of 2.30B FHE and 37.72M USDT. An announcement ticker at the top also notes ongoing exchange updates regarding leverage and margin tiers for USDⓈ-M contracts.
Technical Indicators (MACD & Moving Averages)
MACD: In the lower panel, the MACD metrics show DIF: -0.00103, DEA: -0.00101, and MACD: -0.00002. The MACD lines are closely coiled near the zero line, with the histogram showing signs of stabilizing as the recent bullish bounce attempts to shift momentum.
Volume Moving Averages: The volume moving averages reflect MA(5) at 503M versus MA(10) at 279M, indicating a short-term spike in buying volume backing the recovery rally. @FHe #FHE全同态加密 $FHE
#CanNvidia’sDataCenterGrowthContinue? #NvidiaBoardNotConsideringHuang’sReturnasCEO #KOSPIFalls2.59%ToLowestCloseSinceFebruary #WhatInvestmentSignalsDo13FFilingsReveal?
24-Hour Range & Trading Volume
Over the past 24 hours, FHE registered a low of $0.01361 and a high of $0.01989. Market activity remains substantial, supported by a 24-hour trading volume of 2.30B FHE and 37.72M USDT. An announcement ticker at the top also notes ongoing exchange updates regarding leverage and margin tiers for USDⓈ-M contracts.
Technical Indicators (MACD & Moving Averages)
MACD: In the lower panel, the MACD metrics show DIF: -0.00103, DEA: -0.00101, and MACD: -0.00002. The MACD lines are closely coiled near the zero line, with the histogram showing signs of stabilizing as the recent bullish bounce attempts to shift momentum.
Volume Moving Averages: The volume moving averages reflect MA(5) at 503M versus MA(10) at 279M, indicating a short-term spike in buying volume backing the recovery rally. @FHe #FHE全同态加密 $FHE
#CanNvidia’sDataCenterGrowthContinue? #NvidiaBoardNotConsideringHuang’sReturnasCEO #KOSPIFalls2.59%ToLowestCloseSinceFebruary #WhatInvestmentSignalsDo13FFilingsReveal?