
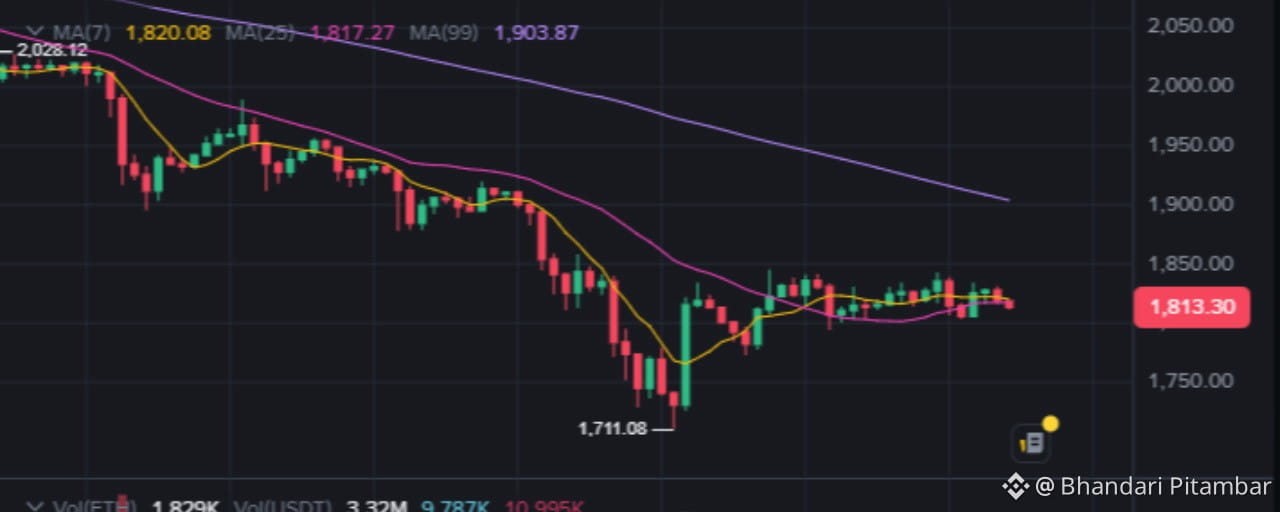

ETH/USDT Technical Analysis | November 16, 2026
Ethereum is showing signs of recovery after a significant market correction.
ETH recently touched approximately $1,711 before bouncing toward the $1,840 region. However, buyers are now facing resistance, and the larger market trend remains under pressure.
Is Ethereum preparing for a major recovery, or is this just another temporary bounce?
Let's examine the charts, derivatives, institutional flows and market sentiment.
📊 1. ETH Market Overview
Based on the supplied Binance 1H chart:
ETH reference price: $1,813.30
MA7: $1,820.08
MA25: $1,817.27
MA99: $1,903.87
Recent swing low: $1,711.08
Ethereum has recovered from its recent low but remains below its major long-term moving average.
The market is showing short-term consolidation rather than a confirmed bullish reversal.
📉 2. Technical Analysis
The higher-timeframe technical structure remains bearish.
Daily RSI readings from independent technical feeds are around 25–26, indicating deeply oversold conditions.
The 4H RSI is also below 40 in one tracked feed.
This suggests that selling pressure has been substantial.
However, oversold conditions can persist during strong downtrends.
Important resistance levels:
$1,820
$1,840
$1,860
$1,883
$1,904
Important support levels:
$1,804
$1,786
$1,749
$1,711
🐂 3. Bullish Scenario: Can ETH Reach $1,950?
For buyers, the first major challenge is reclaiming $1,840.
If Ethereum breaks this level with strong volume, the next potential targets are:
🎯 $1,860
🎯 $1,883
🎯 $1,904
🎯 $1,950
A sustained recovery above $1,883 would significantly improve the short-term technical picture.
Reclaiming $1,904 would provide stronger evidence of a broader reversal.
🐻 4. Bearish Scenario: Could ETH Fall Below $1,700?
The bearish structure remains important.
If Ethereum loses $1,786, selling pressure could increase.
A confirmed daily close below $1,749 would expose the recent low at $1,711.
If that level also breaks, further downside toward $1,695 and $1,663 becomes possible.
These are conditional technical targets, not guaranteed outcomes.
⚡ 5. Ethereum Futures Market
The latest retrieved derivatives snapshot showed:
Open interest: Approximately $12.5 billion
24-hour OI change: -2.5%
Funding rate: -0.0044% per 8 hours
Binance accounts with long positions: 71.6%
Approximately $91.8 million in ETH futures positions were liquidated over 24 hours in that snapshot.
Short liquidations were approximately $61.6 million, while long liquidations were approximately $30.2 million.
Negative funding creates the possibility of another short squeeze, but crowded long positioning also presents liquidation risk.
🏦 6. Institutional ETH ETF Activity
Ethereum spot ETFs recorded approximately $2.3 million in net inflows on November 13.
Fidelity recorded approximately $11.6 million in inflows, while Grayscale recorded approximately $9.3 million in outflows.
Despite this positive daily result, the broader weekly ETF flow picture remained negative.
One positive session does not yet prove that institutional investors have returned to aggressive ETH accumulation.
🌍 7. Global Crypto Market Sentiment
The wider cryptocurrency market remains under pressure.
Important indicators:
Bitcoin dominance: Approximately 59.4%
Altcoin Season Index: 44/100
Fear & Greed Index: 10/100
Total crypto market capitalization: Approximately $2.2 trillion, depending on tracker
Extreme fear and high Bitcoin dominance suggest that altcoins may struggle to sustain recoveries.
Ethereum also remains sensitive to Federal Reserve expectations, inflation, Treasury yields and broader risk appetite.
🔥 8. My Ethereum Price Prediction
My current assessment:
15M: Sideways and volatile.
1H: Consolidation around the current price region.
4H: Bearish.
Daily: Bearish, with oversold recovery potential.
Bullish confirmation: Sustained movement above $1,860–$1,883.
Bearish confirmation: Breakdown below $1,749, followed by a possible retest of $1,711.
🎯 FINAL VERDICT
Ethereum has the potential to recover, but the larger bearish structure has not yet been broken.
The most important short-term resistance is $1,840–$1,860.
The most important support region is $1,749–$1,711.
My approach would be to wait for a confirmed breakout or breakdown rather than chase an uncertain move.
A recovery toward $1,950 is possible if buyers regain control. However, another decline remains possible if support fails.
What is your ETH prediction?
🚀 ETH to $2,000?
🐻 ETH below $1,700?
Share your analysis in the comments!
#Ethereum #ETH #ETHUSDT #BinanceSquare #CryptoAnalysis
Final assessment
ETH/USDT
SIDEWAYS short-term · BEARISH higher timeframe
$1,813.30
The level that changes my view: $1,860.
Above $1,860, the recovery becomes more convincing.
Below $1,749, the bearish continuation becomes more concerning.
I would not call ETH bullish until the price reclaims important resistance with convincing volume.
