
$EVAA /USDT: Up More Than 114%, But Is the Rally Losing Momentum or Just Getting Started?
One thing that immediately stands out in the EVAA/USDT chart is the strength of its recent move.
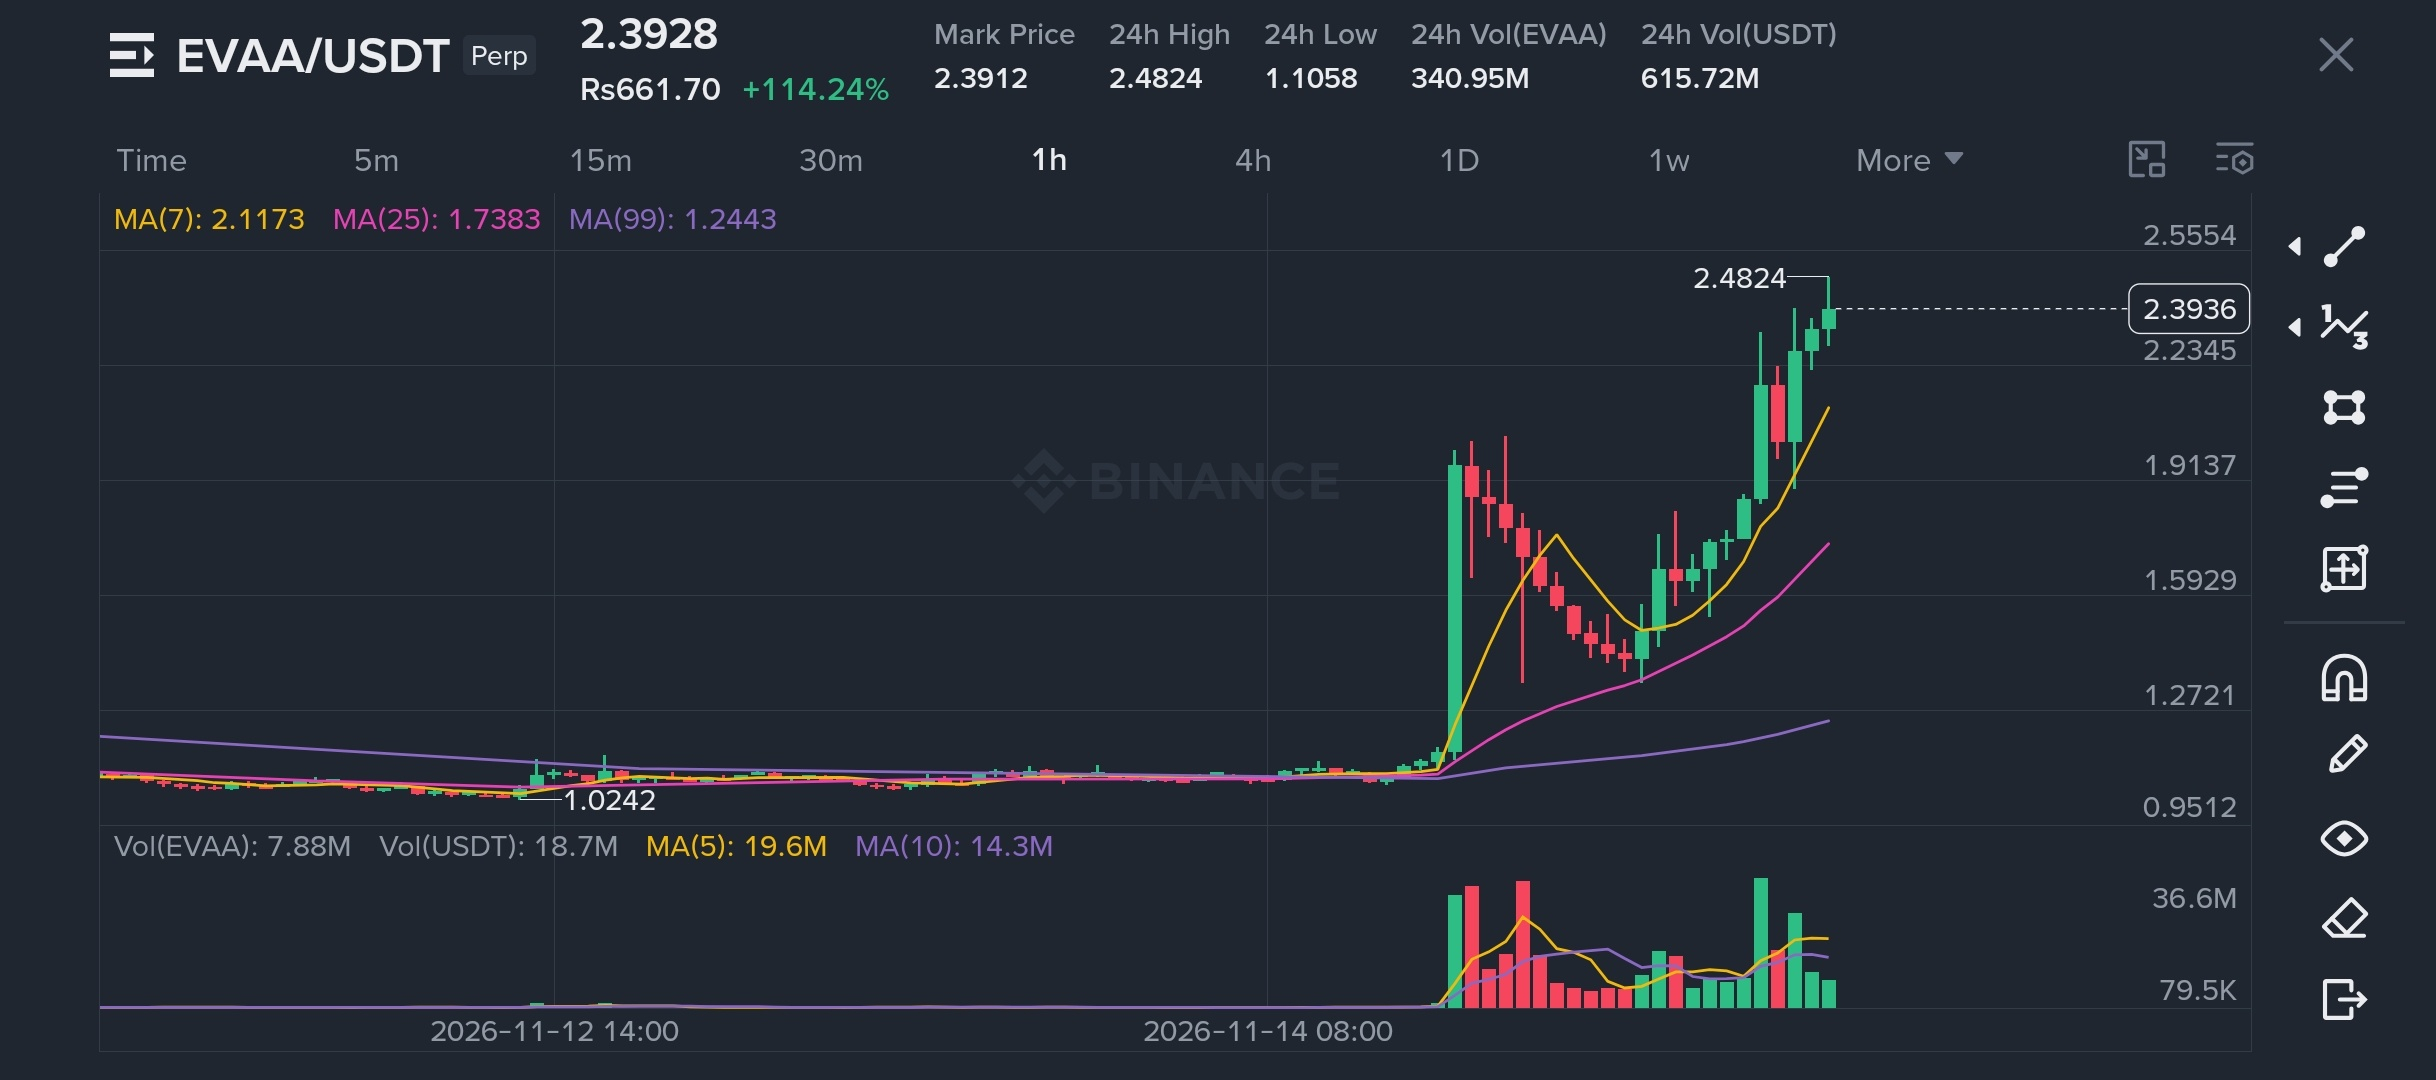
EVAA has climbed from around $1.02 to approximately $2.39, recording a gain of more than 114% in 24 hours. That's a significant move, especially considering how long price was trading near its previous range.
But looking beyond the percentage gain, I find the current price structure more interesting.
On the 1H chart, the initial breakout was followed by a noticeable correction. Instead of continuing downward, buyers gradually stepped back in, pushing the price toward a new local high of $2.4824.
The moving averages also show a strong bullish structure:
MA7: $2.1173
MA25: $1.7383
MA99: $1.2443
Price is trading above all three averages, which suggests that short-term momentum remains strongly bullish.
However, there is something traders should not ignore.
After such a sharp rally, profit-taking and volatility become important factors. Buying simply because a token is already up 100% can be risky.
What I'm watching next:
The $2.48 area is the immediate resistance to watch. A convincing breakout and sustained trading above this level could open the door for another upward move.
On the downside, $2.23 is an area worth monitoring, followed by the $2.11 region around the 7-period moving average. A deeper correction could bring the $1.91 area into focus.
My view is that EVAA currently has a bullish short-term structure, but confirmation matters more than chasing green candles.
The important question is whether buyers can maintain this momentum or whether the market needs a healthy correction before attempting another breakout.
Would you rather wait for a confirmed breakout above $2.48 or look for a pullback before considering an entry?
Not financial advice.
Always manage risk and do your own research.
#EVAA #EVAAUSDT #cryptotrading
One thing that immediately stands out in the EVAA/USDT chart is the strength of its recent move.
EVAA has climbed from around $1.02 to approximately $2.39, recording a gain of more than 114% in 24 hours. That's a significant move, especially considering how long price was trading near its previous range.
But looking beyond the percentage gain, I find the current price structure more interesting.
On the 1H chart, the initial breakout was followed by a noticeable correction. Instead of continuing downward, buyers gradually stepped back in, pushing the price toward a new local high of $2.4824.
The moving averages also show a strong bullish structure:
MA7: $2.1173
MA25: $1.7383
MA99: $1.2443
Price is trading above all three averages, which suggests that short-term momentum remains strongly bullish.
However, there is something traders should not ignore.
After such a sharp rally, profit-taking and volatility become important factors. Buying simply because a token is already up 100% can be risky.
What I'm watching next:
The $2.48 area is the immediate resistance to watch. A convincing breakout and sustained trading above this level could open the door for another upward move.
On the downside, $2.23 is an area worth monitoring, followed by the $2.11 region around the 7-period moving average. A deeper correction could bring the $1.91 area into focus.
My view is that EVAA currently has a bullish short-term structure, but confirmation matters more than chasing green candles.
The important question is whether buyers can maintain this momentum or whether the market needs a healthy correction before attempting another breakout.
Would you rather wait for a confirmed breakout above $2.48 or look for a pullback before considering an entry?
Not financial advice.
Always manage risk and do your own research.
#EVAA #EVAAUSDT #cryptotrading