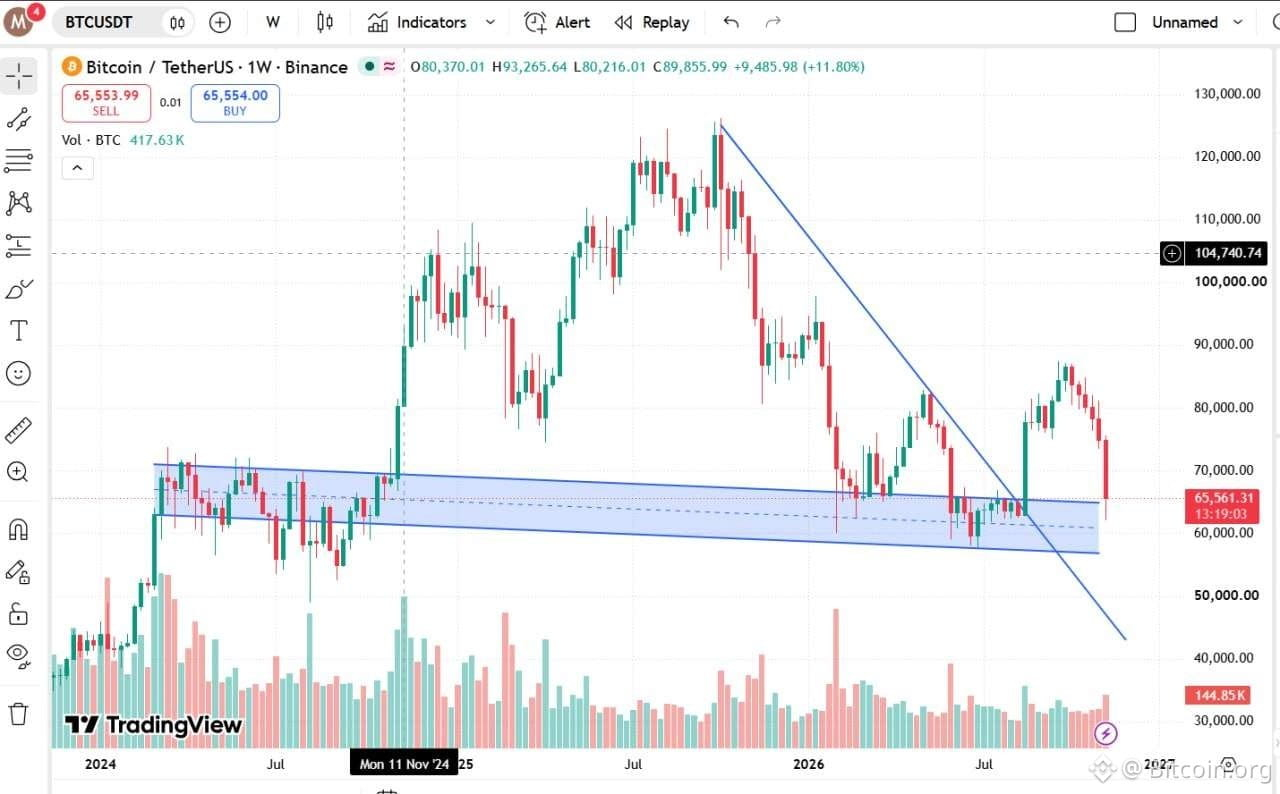
$BTC broke the long bearish trendline, but it hasn’t earned the all clear.
On the weekly chart, the line from the 126k peak finally broke around the 63k area, and price ran to near 87k. That was a real breakout. Then it rolled over, and the current weekly candle has dropped from about 75k to 65,561, right back into the old 2024 range.
The problem is the structure. The highs went 126k, then 97k, then 87k, so every rally since the top has been lower. A trendline break followed by a lower high is a warning, not a trend change. Market conditions are still unhealthy, and that’s why the rally didn’t hold.
The range is the test now. The 57k to 65k zone held the 2026 lows, and price is sitting on its top edge. If it holds and bounces, this is just a retest of the breakout. If it loses the 57k to 60k lows, the breakout fails and BTC is back inside the range.
Until it reclaims 75k, the downtrend view stays. Reclaim it and then 87k, and the break becomes a real trend change.
$BTC
On the weekly chart, the line from the 126k peak finally broke around the 63k area, and price ran to near 87k. That was a real breakout. Then it rolled over, and the current weekly candle has dropped from about 75k to 65,561, right back into the old 2024 range.
The problem is the structure. The highs went 126k, then 97k, then 87k, so every rally since the top has been lower. A trendline break followed by a lower high is a warning, not a trend change. Market conditions are still unhealthy, and that’s why the rally didn’t hold.
The range is the test now. The 57k to 65k zone held the 2026 lows, and price is sitting on its top edge. If it holds and bounces, this is just a retest of the breakout. If it loses the 57k to 60k lows, the breakout fails and BTC is back inside the range.
Until it reclaims 75k, the downtrend view stays. Reclaim it and then 87k, and the break becomes a real trend change.
$BTC