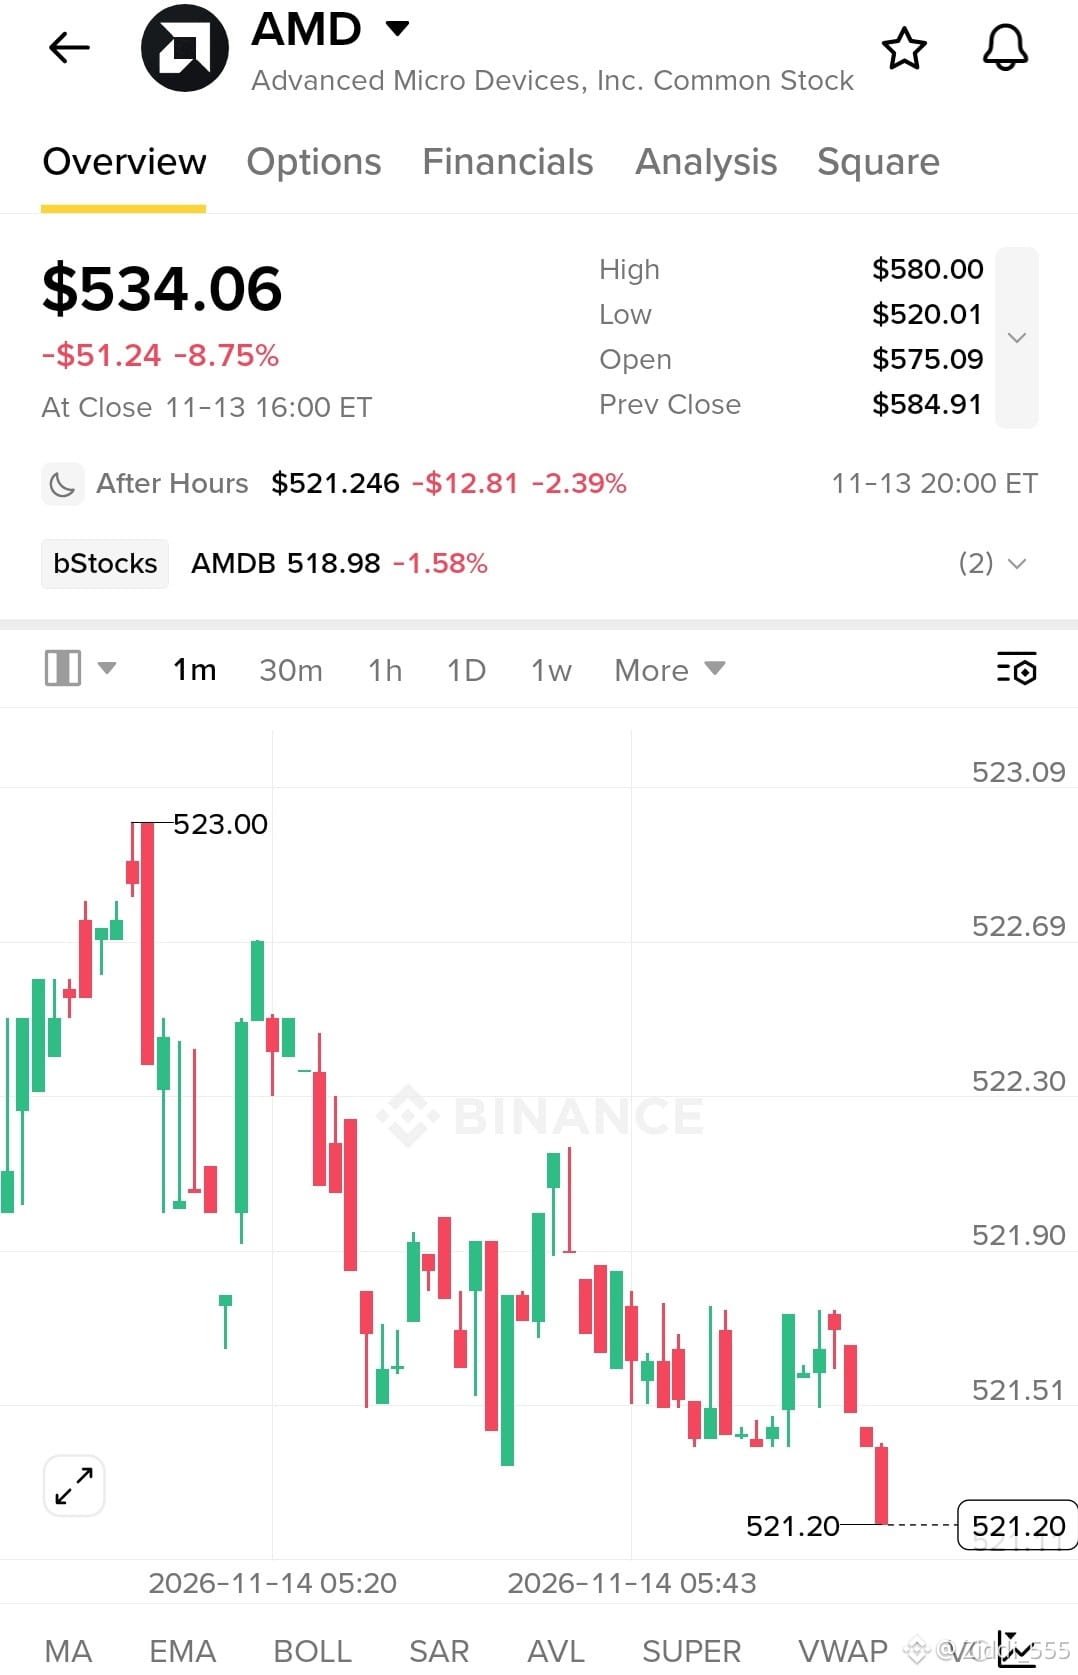
$AMD.US snapshot (screenshot data):**
- **Close (Nov 13):** $534.06, down $51.24 (-8.75%), a big drop. Range $520.01–$580.00, opened at $575.09, so it faded hard from the open and closed near the low.
- **After hours:** $521.25, another -2.39%. The tokenized bStock (AMDB) is at 518.98 (-1.58%), also pointing lower.
- **1-minute chart (Nov 14, ~05:20-05:43):** Clear downtrend from $523.00 to $521.20, with lower highs and lower lows and the latest candles closing at the session low. No bounce yet.
**Takeaway:** Bearish momentum is continuing after a heavy selloff, with no sign of a reversal. $520 (the regular-session low) is the level to watch. A break below it could extend the drop, while a hold might give a relief bounce. Overnight volume is thin, so these moves can be exaggerated.
This isn't financial advice, so weigh it against your own risk tolerance.
#WhoWillSucceedJensenHuangatNvidia?
#BitcoinActiveSupplyInProfitDropsBelow45%
#USSpotXRPETFsSeeLargestWeeklyOutflowIn8Months
- **Close (Nov 13):** $534.06, down $51.24 (-8.75%), a big drop. Range $520.01–$580.00, opened at $575.09, so it faded hard from the open and closed near the low.
- **After hours:** $521.25, another -2.39%. The tokenized bStock (AMDB) is at 518.98 (-1.58%), also pointing lower.
- **1-minute chart (Nov 14, ~05:20-05:43):** Clear downtrend from $523.00 to $521.20, with lower highs and lower lows and the latest candles closing at the session low. No bounce yet.
**Takeaway:** Bearish momentum is continuing after a heavy selloff, with no sign of a reversal. $520 (the regular-session low) is the level to watch. A break below it could extend the drop, while a hold might give a relief bounce. Overnight volume is thin, so these moves can be exaggerated.
This isn't financial advice, so weigh it against your own risk tolerance.
#WhoWillSucceedJensenHuangatNvidia?
#BitcoinActiveSupplyInProfitDropsBelow45%
#USSpotXRPETFsSeeLargestWeeklyOutflowIn8Months