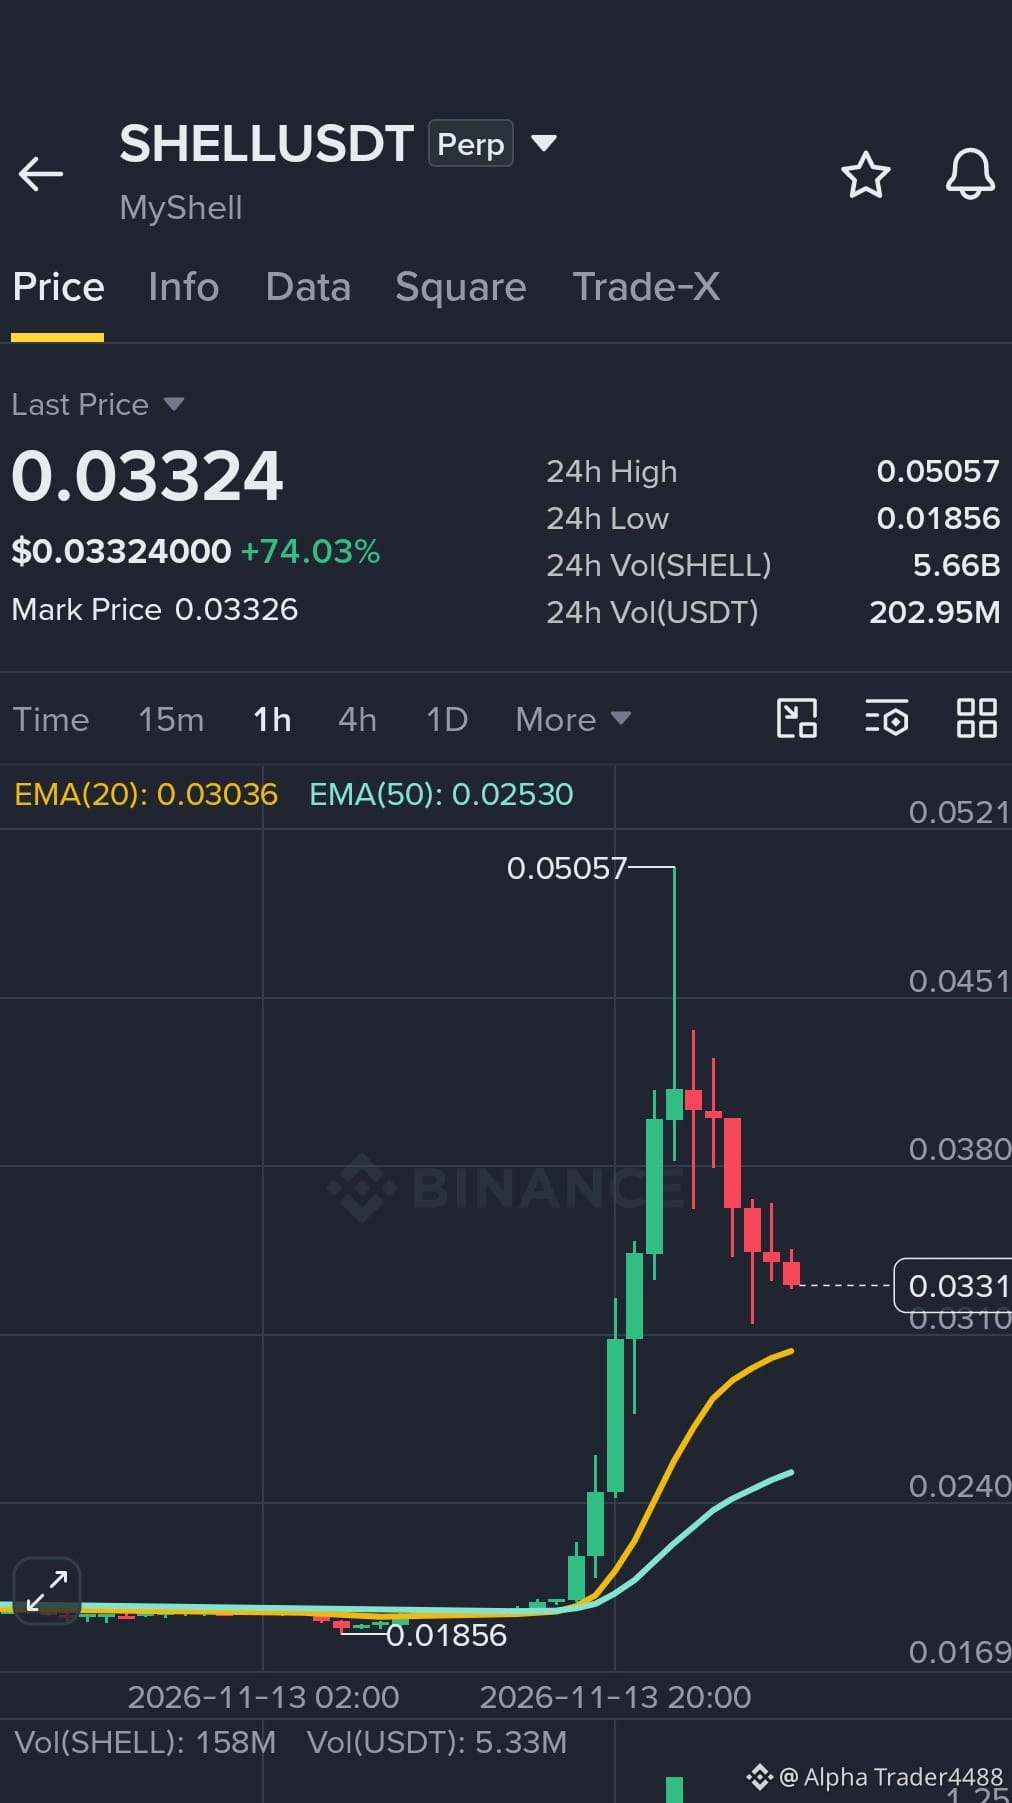
$SHELL Analysis - Is it Reversal?
NOT REVERSAL - PULLBACK ✅
Why NOT reversal.
1. Price $0.03324 still ABOVE EMA20 $0.03036 and EMA50 $0.02530*
Reversal would be BELOW both EMAs - This is still bullish structure
SHELL is above = Alive
2. -34.5% drop $0.05057 → $0.03324 = Normal pullback after +172% pump*
$0.01856 → $0.05057 = +172% in 1 day (Nov 13) = Insane pump
- Pullback -34.5% is healthy, RSI cooling 80 → 62.99
3. Vol pattern:
- 1.25B green spike at top = Profit taking
- Now decreasing red vol = Selling fading
When it WILL be reversal?
If it breaks *EMA20 $0.03036* then *EMA50 $0.02530* = Then reversal to $0.01856
Trade Plan
PULLBACK LONG (Not reversal short):
Entry: $0.03036-$0.03324 (EMA20 support)
SL: $0.02530 EMA50 (-18%)
TP1: $0.03809 +14%
TP2: $0.04513 +35%
TP3: $0.05057 retest high +52%
#BNB_Market_Update #USPPIMissMayEaseBTCPressure #BitcoinBreaksBelow200WeekMovingAverage
NOT REVERSAL - PULLBACK ✅
Why NOT reversal.
1. Price $0.03324 still ABOVE EMA20 $0.03036 and EMA50 $0.02530*
Reversal would be BELOW both EMAs - This is still bullish structure
SHELL is above = Alive
2. -34.5% drop $0.05057 → $0.03324 = Normal pullback after +172% pump*
$0.01856 → $0.05057 = +172% in 1 day (Nov 13) = Insane pump
- Pullback -34.5% is healthy, RSI cooling 80 → 62.99
3. Vol pattern:
- 1.25B green spike at top = Profit taking
- Now decreasing red vol = Selling fading
When it WILL be reversal?
If it breaks *EMA20 $0.03036* then *EMA50 $0.02530* = Then reversal to $0.01856
Trade Plan
PULLBACK LONG (Not reversal short):
Entry: $0.03036-$0.03324 (EMA20 support)
SL: $0.02530 EMA50 (-18%)
TP1: $0.03809 +14%
TP2: $0.04513 +35%
TP3: $0.05057 retest high +52%
#BNB_Market_Update #USPPIMissMayEaseBTCPressure #BitcoinBreaksBelow200WeekMovingAverage