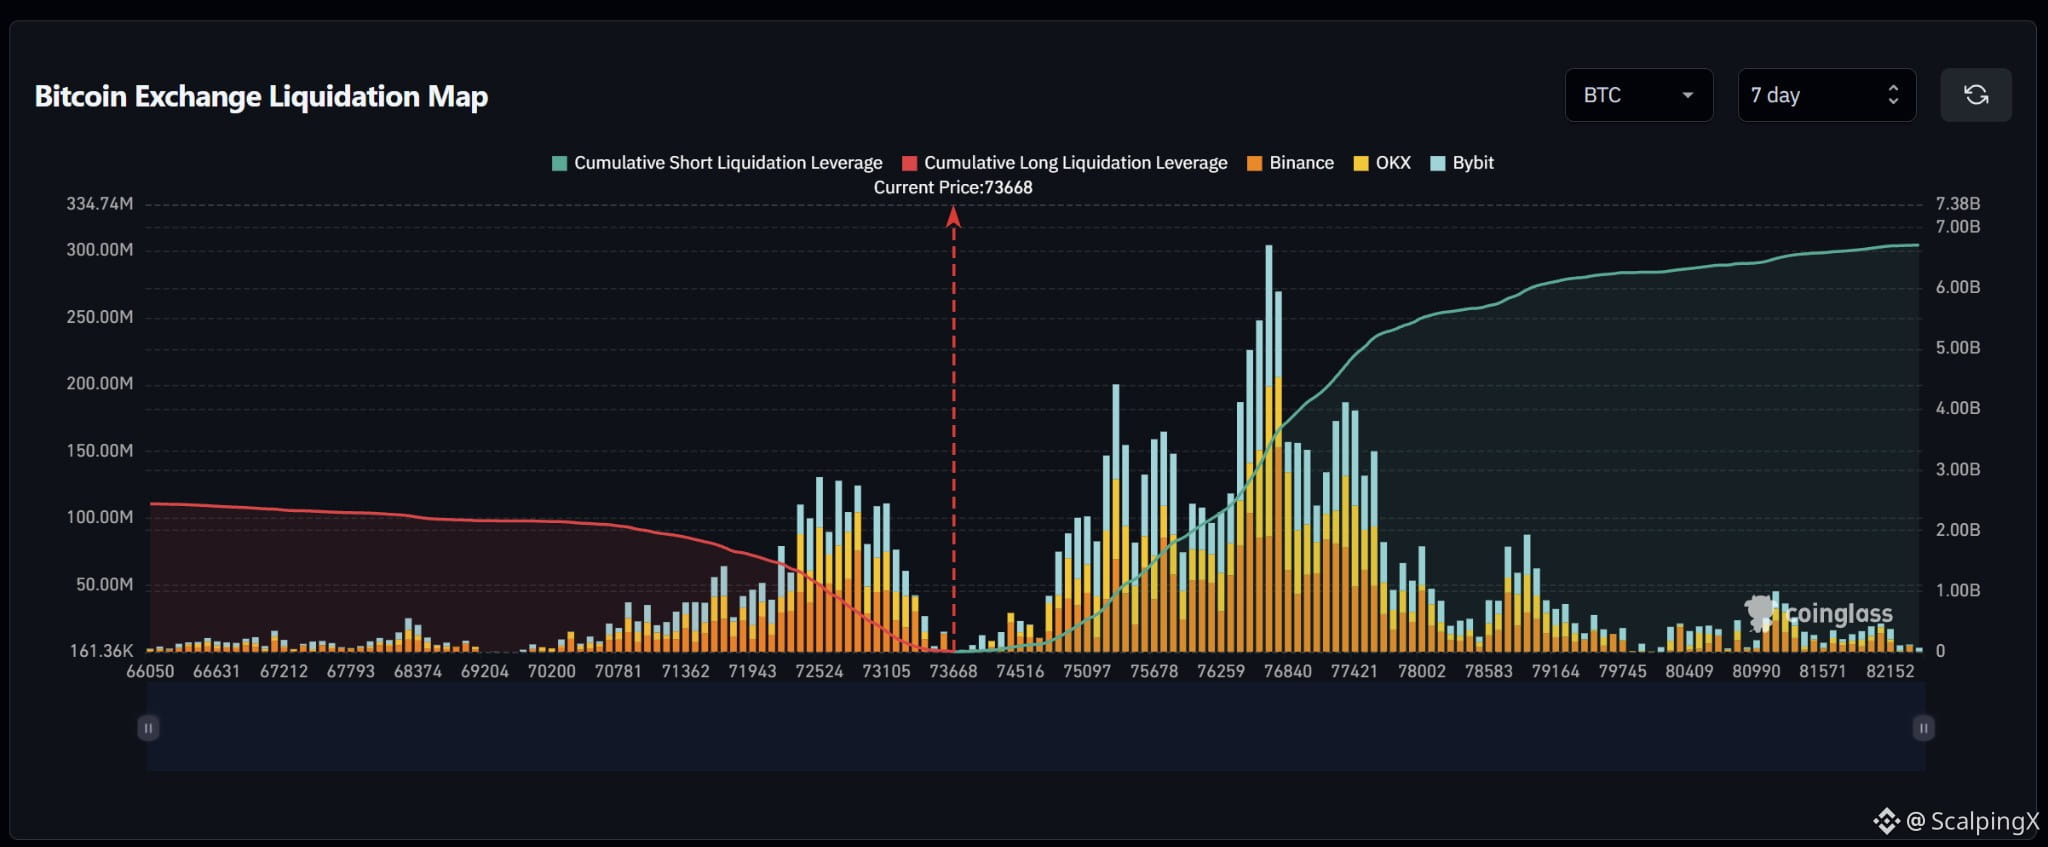
$BTC – Liquidation Map (7 days) – Index ~73,668
🧭 The preferred scenario is a nearby long-liquidation sweep at 73,100–73,300. Estimated cumulative short exposure is substantially larger, but the dense short clusters sit farther away, starting around 74,800.
🔻 Losing 73,100 without a reclaim would shift focus to the long cluster at 72,400–72,900, particularly around 72,500. Several consecutive large bars could amplify volatility if triggered.
🎯 Holding below 72,400 after the sweep would bring smaller clusters at 71,800–72,300 into focus, followed by 71,100–71,600. A downside sweep followed by a quick reclaim of 73,668 would weaken bearish continuation.
⚖️ A break and hold above 74,600 would shift preference toward short sweeps at 74,800–75,400 and 75,500–75,900. Holding above 75,900 would bring the major 76,400–77,000 cluster into focus, particularly around 76,700, followed by 77,100–77,600.
#LiquidationMap
🧭 The preferred scenario is a nearby long-liquidation sweep at 73,100–73,300. Estimated cumulative short exposure is substantially larger, but the dense short clusters sit farther away, starting around 74,800.
🔻 Losing 73,100 without a reclaim would shift focus to the long cluster at 72,400–72,900, particularly around 72,500. Several consecutive large bars could amplify volatility if triggered.
🎯 Holding below 72,400 after the sweep would bring smaller clusters at 71,800–72,300 into focus, followed by 71,100–71,600. A downside sweep followed by a quick reclaim of 73,668 would weaken bearish continuation.
⚖️ A break and hold above 74,600 would shift preference toward short sweeps at 74,800–75,400 and 75,500–75,900. Holding above 75,900 would bring the major 76,400–77,000 cluster into focus, particularly around 76,700, followed by 77,100–77,600.
#LiquidationMap