BTC Weekly Analysis – Bearish Pressure Continues?
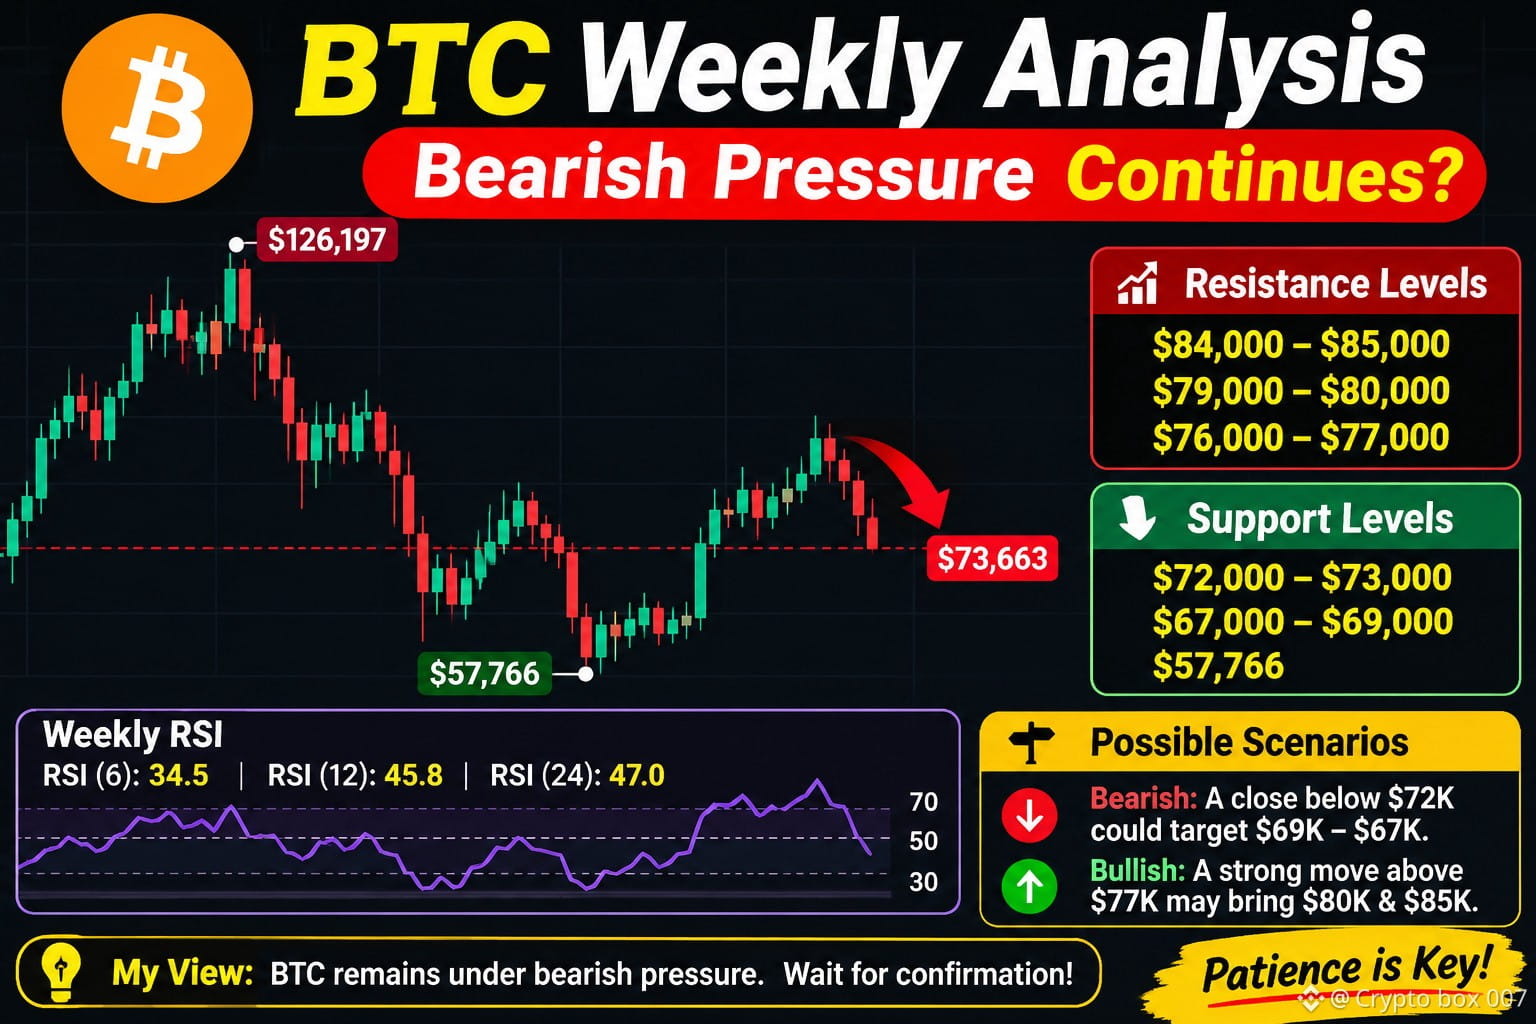
Bitcoin is currently trading around $73,663 on the weekly timeframe.
After recovering from the $57,766 low, BTC rallied toward the $85,000 resistance zone. However, sellers stepped in, triggering another downward move.
Technical Overview:
Weekly RSI (6): 34.5
Weekly RSI (12): 45.8
Weekly RSI (24): 47.0
Momentum remains weak, with all RSI readings below 50.
Key Resistance Levels:
$76,000–$77,000
$79,000–$80,000
$84,000–$85,000
Key Support Levels:
$72,000–$73,000
$67,000–$69,000
$57,766 (Major Support)
Possible Scenarios:
🔴 Bearish: A weekly close below $72,000 could open the door toward $69,000–$67,000.
🟢 Bullish: A strong recovery above $77,000 could bring $80,000 and $85,000 back into focus.
My View: BTC remains under bearish pressure on the weekly timeframe. I would prefer to wait for confirmation before considering a new long position.
Patience is key. Let the market confirm its direction.
#BTC #Bitcoin #CryptoAnalysis #TechnicalAnalysis #BinanceSquare $BTC
Bitcoin is currently trading around $73,663 on the weekly timeframe.
After recovering from the $57,766 low, BTC rallied toward the $85,000 resistance zone. However, sellers stepped in, triggering another downward move.
Technical Overview:
Weekly RSI (6): 34.5
Weekly RSI (12): 45.8
Weekly RSI (24): 47.0
Momentum remains weak, with all RSI readings below 50.
Key Resistance Levels:
$76,000–$77,000
$79,000–$80,000
$84,000–$85,000
Key Support Levels:
$72,000–$73,000
$67,000–$69,000
$57,766 (Major Support)
Possible Scenarios:
🔴 Bearish: A weekly close below $72,000 could open the door toward $69,000–$67,000.
🟢 Bullish: A strong recovery above $77,000 could bring $80,000 and $85,000 back into focus.
My View: BTC remains under bearish pressure on the weekly timeframe. I would prefer to wait for confirmation before considering a new long position.
Patience is key. Let the market confirm its direction.
#BTC #Bitcoin #CryptoAnalysis #TechnicalAnalysis #BinanceSquare $BTC