I wasn't planning to trade this coin today, but after looking at this ARB chart twice, I noticed something I couldn't ignore.
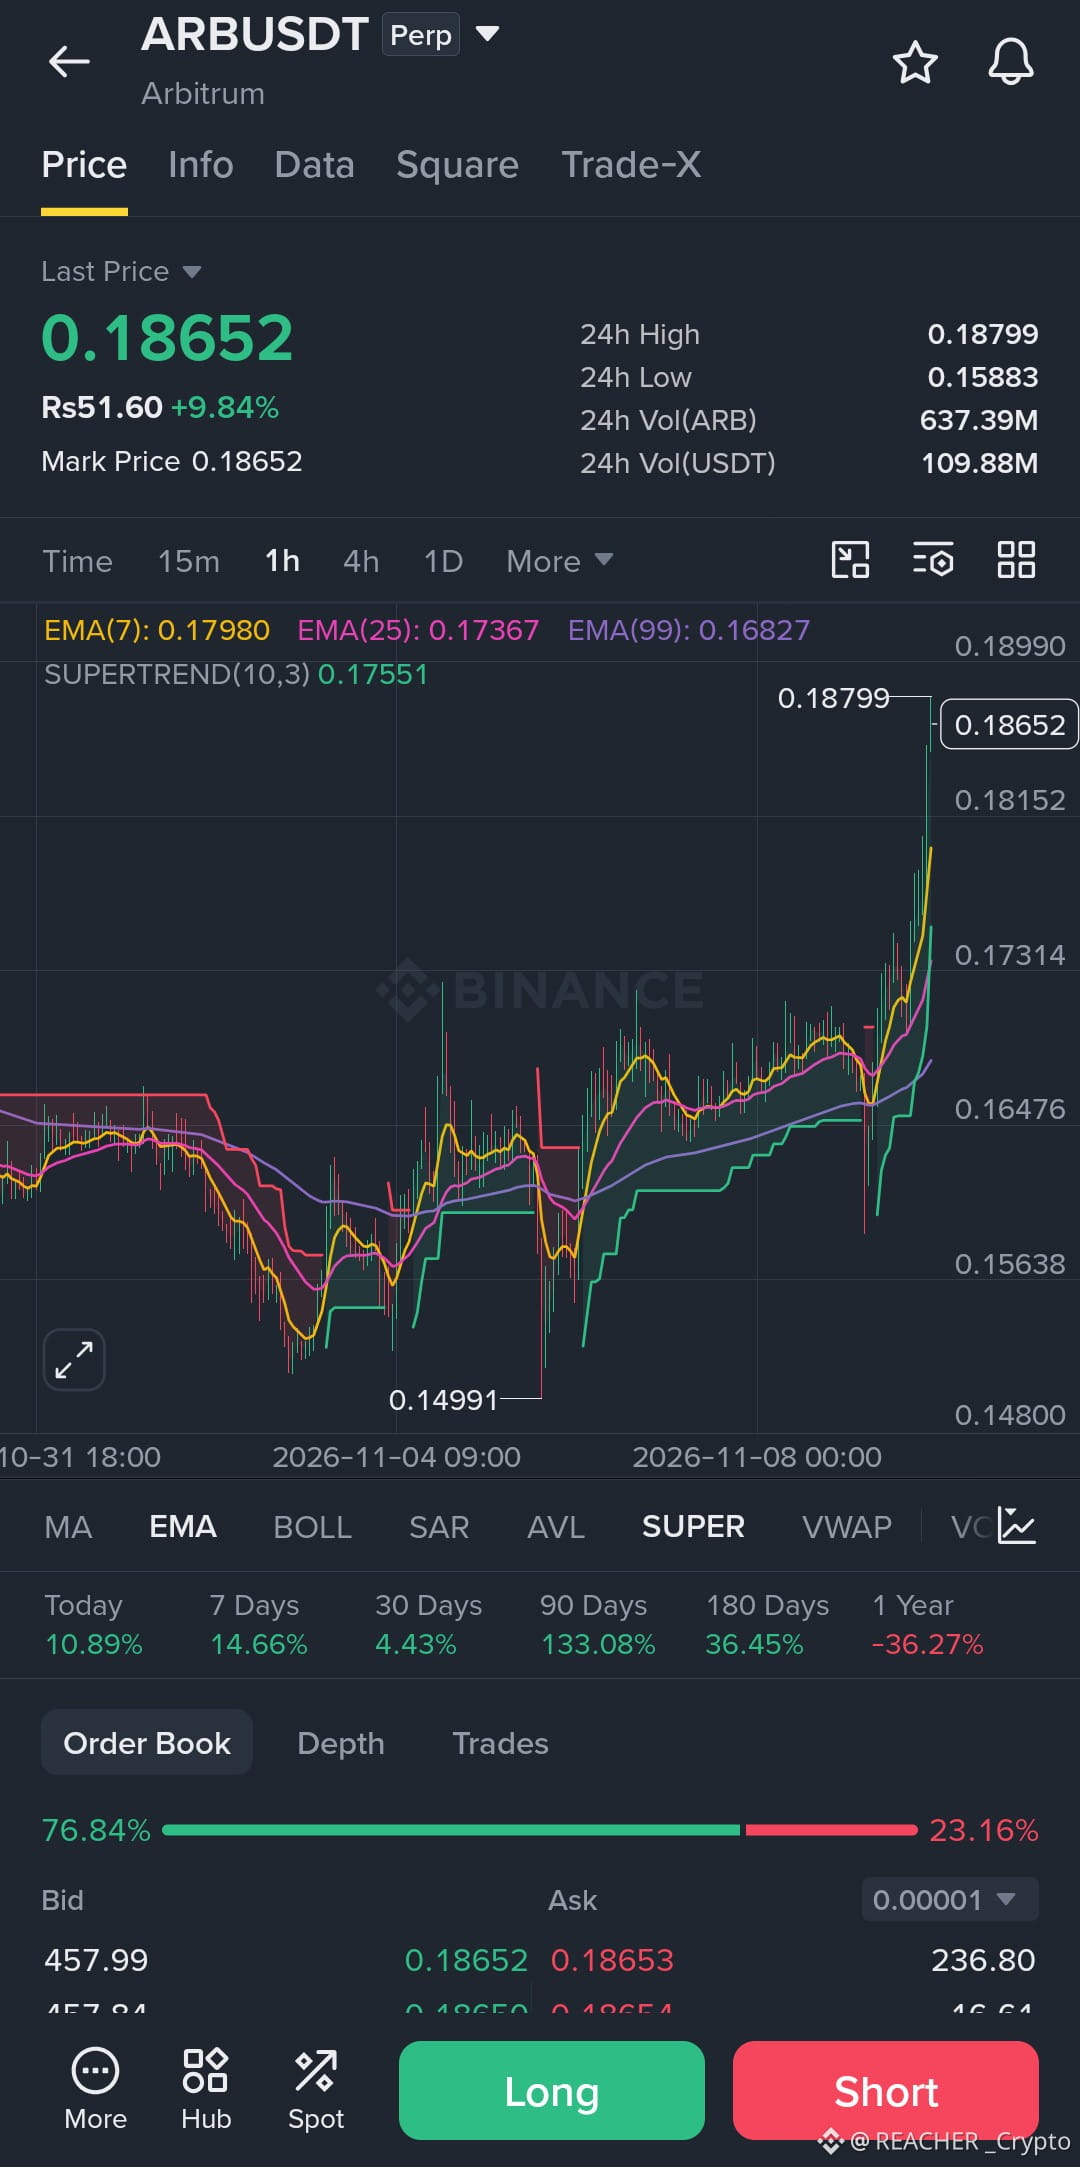
Looking at the 1-hour timeframe, the macro structure has been a heavy, choppy bleed, eventually flushing down to a low of 0.14991. But the recent price action is a completely different story. Buyers have stepped in aggressively, and we are currently pushing into new local highs at 0.18652 (+9.84%).
Here is the critical detail: price is trading well above a fanned-out EMA cluster. The EMA7 (0.1798), EMA25 (0.1736), and EMA99 (0.1682) are all angled sharply upward beneath us as dynamic support. Even more notably, the Supertrend indicator has flipped green, with the support line sitting down at 0.1755.
Adding to the bullish case, the order book is showing a massive 76.84% buy wall. This tells me momentum is strong. However, chasing a vertical green candle after a nearly 10% run is a great way to get trapped in a pullback.
A lesson I've learned from trading these breakouts is that the initial impulse is often just the trap. I prefer to wait for the price to retest the moving averages before entering.
Trade Plan:
Bias: Bullish continuation (Waiting for a pullback).
Entry Zone: 0.1750 – 0.1800 (Looking for a retest of the EMA cluster and Supertrend).
Stop Loss: 0.1580 (Just below the recent macro swing low).
Target 1: 0.1899 (Immediate resistance).
Target 2: 0.2043 (Macro peak).
Target 3: 0.2200 (Price discovery).
Risk/Reward: 1:2.5
Invalidation: A 1H candle close back below 0.1700, which would signal a loss of the local uptrend support.
Don't FOMO into a vertical candle. Wait for the price to cool off, respect your stop loss, and never risk more than you can afford to lose.
Do you think this recovery has legs, or is it just a lower high before the next dump?
$ARB
#NvidiaInvestigatesAfterHuang’sAffairApology #CPITestsDecemberRateOutlook #AIChipSlumpNasdaq
Looking at the 1-hour timeframe, the macro structure has been a heavy, choppy bleed, eventually flushing down to a low of 0.14991. But the recent price action is a completely different story. Buyers have stepped in aggressively, and we are currently pushing into new local highs at 0.18652 (+9.84%).
Here is the critical detail: price is trading well above a fanned-out EMA cluster. The EMA7 (0.1798), EMA25 (0.1736), and EMA99 (0.1682) are all angled sharply upward beneath us as dynamic support. Even more notably, the Supertrend indicator has flipped green, with the support line sitting down at 0.1755.
Adding to the bullish case, the order book is showing a massive 76.84% buy wall. This tells me momentum is strong. However, chasing a vertical green candle after a nearly 10% run is a great way to get trapped in a pullback.
A lesson I've learned from trading these breakouts is that the initial impulse is often just the trap. I prefer to wait for the price to retest the moving averages before entering.
Trade Plan:
Bias: Bullish continuation (Waiting for a pullback).
Entry Zone: 0.1750 – 0.1800 (Looking for a retest of the EMA cluster and Supertrend).
Stop Loss: 0.1580 (Just below the recent macro swing low).
Target 1: 0.1899 (Immediate resistance).
Target 2: 0.2043 (Macro peak).
Target 3: 0.2200 (Price discovery).
Risk/Reward: 1:2.5
Invalidation: A 1H candle close back below 0.1700, which would signal a loss of the local uptrend support.
Don't FOMO into a vertical candle. Wait for the price to cool off, respect your stop loss, and never risk more than you can afford to lose.
Do you think this recovery has legs, or is it just a lower high before the next dump?
$ARB
#NvidiaInvestigatesAfterHuang’sAffairApology #CPITestsDecemberRateOutlook #AIChipSlumpNasdaq