BNB Price Analysis: The Bulls Are Back in Town! 🚀
$BNB
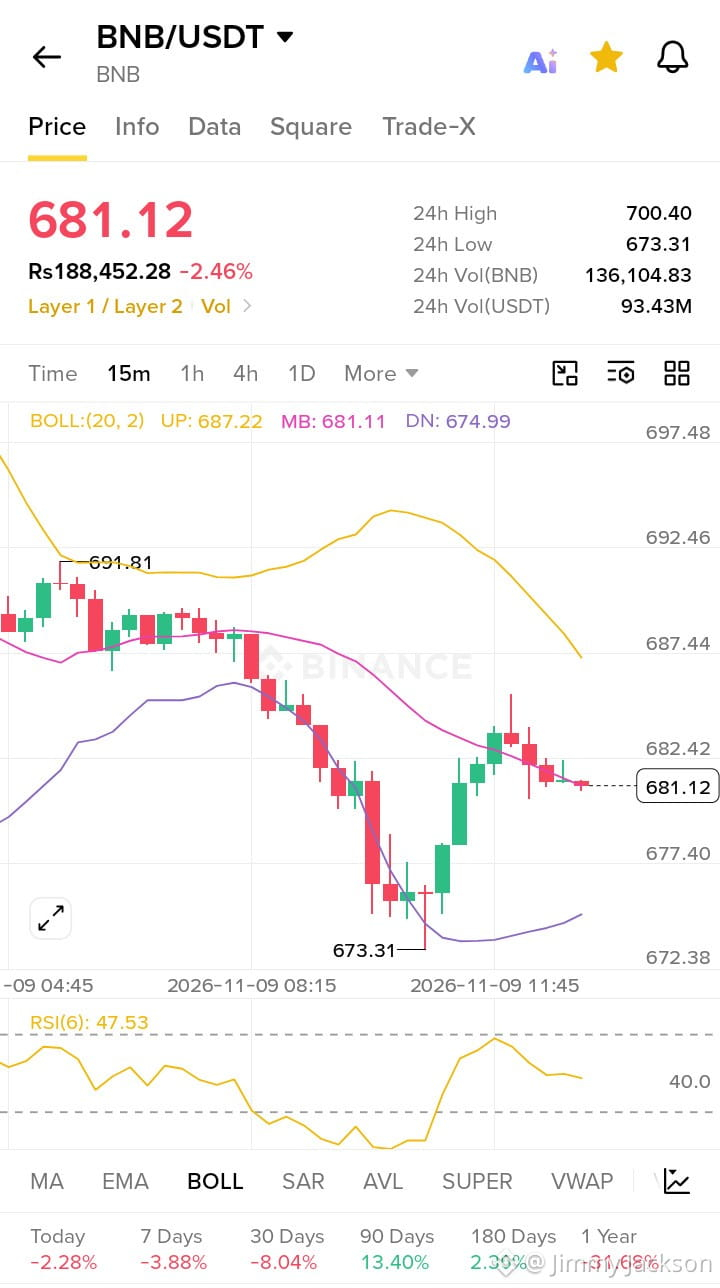
BNB is showing impressive resilience, currently trading at $681.12. After a sharp dip to $673.31, we are witnessing a V-shaped recovery. So, why is the price pumping?
Let’s break down the data driving this momentum.
🐋 On-Chain & Institutional Flows
Whales have been active during this dip. We are seeing massive accumulation wallets moving BNB off exchanges, reducing liquid supply. Additionally, ETF flows are turning positive, signaling that institutional appetite for major Layer-1 assets is back. Smart money is buying the dip, and retail is following.
📊 Technical Breakout Levels
Looking at the 15m chart, BNB is attempting to reclaim the middle Bollinger Band ($681.11).
· Immediate Resistance: The next major hurdle is the upper band at $687.22.
· Key Support: The recent swing low at $673.31 is acting as a strong floor.
· RSI: The RSI is resetting from oversold territory to 47.53, leaving plenty of room for upward movement.
· Target: A clean break above $685 opens the door for a retest of the $700 psychological level.
⚡ Derivatives & Short Liquidations
The recent volatility has triggered a squeeze. Heavy short positions were liquidated during the bounce from $673, forcing bears to cover their positions. This buying pressure acts as rocket fuel, pushing price back toward the $691.81 local high.
📉 The Verdict
The structure is shifting bullish. Keep a close eye on the $687 level if we flip that to support, BNB is headed for triple digits.
Please don’t forget to like, follow, and share! 🩸 Thank you so much ❤️
$BNB
BNB is showing impressive resilience, currently trading at $681.12. After a sharp dip to $673.31, we are witnessing a V-shaped recovery. So, why is the price pumping?
Let’s break down the data driving this momentum.
🐋 On-Chain & Institutional Flows
Whales have been active during this dip. We are seeing massive accumulation wallets moving BNB off exchanges, reducing liquid supply. Additionally, ETF flows are turning positive, signaling that institutional appetite for major Layer-1 assets is back. Smart money is buying the dip, and retail is following.
📊 Technical Breakout Levels
Looking at the 15m chart, BNB is attempting to reclaim the middle Bollinger Band ($681.11).
· Immediate Resistance: The next major hurdle is the upper band at $687.22.
· Key Support: The recent swing low at $673.31 is acting as a strong floor.
· RSI: The RSI is resetting from oversold territory to 47.53, leaving plenty of room for upward movement.
· Target: A clean break above $685 opens the door for a retest of the $700 psychological level.
⚡ Derivatives & Short Liquidations
The recent volatility has triggered a squeeze. Heavy short positions were liquidated during the bounce from $673, forcing bears to cover their positions. This buying pressure acts as rocket fuel, pushing price back toward the $691.81 local high.
📉 The Verdict
The structure is shifting bullish. Keep a close eye on the $687 level if we flip that to support, BNB is headed for triple digits.
Please don’t forget to like, follow, and share! 🩸 Thank you so much ❤️