📉 Bitcoin’s 50-Week Average Slip: Why History Says the Bottom Is Safe 🧐
$BTC
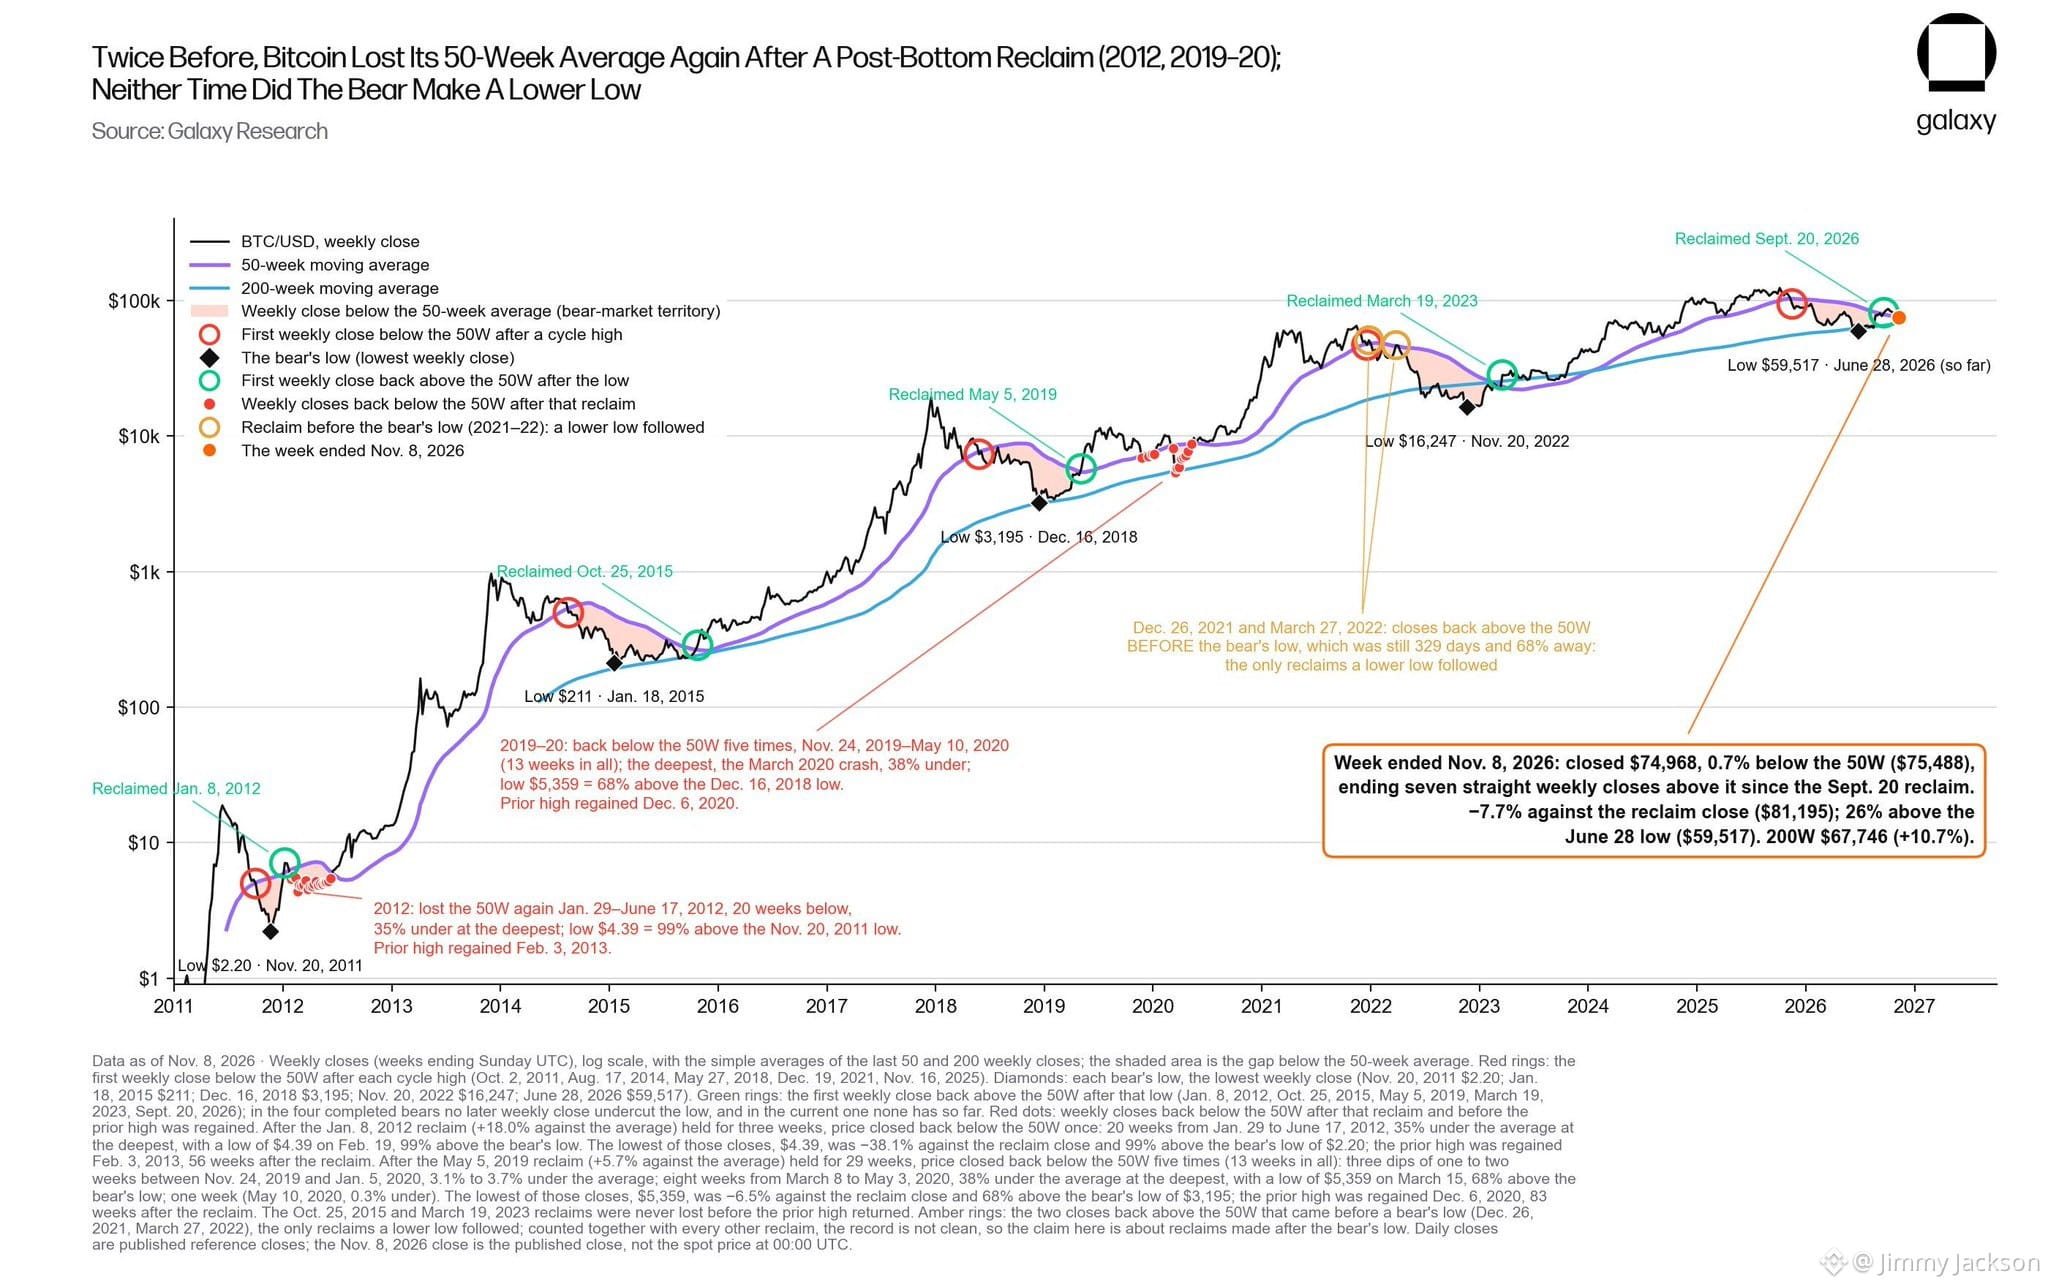
Galaxy’s Alex Thorn just dropped a chart that every Bitcoin investor needs to see right now. Yes, BTC has slipped back below its 50-week moving average, but before you panic, let’s look at the historical blueprint. 📊
According to Thorn’s latest research, we’ve seen this exact setup twice before after a bear market bottom—and neither time did the price end up making a new low. 🛡️
$GIGGLE
Here is the breakdown of the data
🔹 The 2012 Cycle: After reclaiming the 50-week average, Bitcoin lost it again for 20 weeks. It dropped 35%, but the low of $4.39 held 99% above the previous bear market floor of $2.20.
🔹 The 2019-20 Cycle: We saw five separate closes below the average. Despite the brutal March 2020 crash (which saw a 38% drop), the $5,359 low stayed 68% above the $3,195 bottom from Dec 2018. 🏗️
Fast forward to today: As of the week ending Nov. 8, 2026, Bitcoin closed at $74,968. It’s sitting 0.7% below the 50W average, ending a seven-week streak of closes above it since the Sept. 20 reclaim. 📉
Even more telling? The current price is still a massive 26% above the June 28 low of $59,517. 💪
$VIRTUAL
The one time this setup actually failed—during the 2021-22 bear market—the macro conditions were entirely different. Back then, investors faced a historic 329-day gap below the bear's low and a -68% distance from the prior cycle high. Today’s structure looks much more like the 2012 and 2019 recovery phases. 🧩
History doesn't always repeat, but it certainly rhymes. While short-term volatility is guaranteed, the data strongly suggests we are navigating a consolidation phase, not a new bearish collapse. 🌊
Please don’t forget to like, follow, and share! 🩸 Thank you so much ❤️
#BitcoinFiveWeeklyLosses #SouthKoreaDraftLawTargets15To20%ShareholderCap #CPITestsDecemberRateOutlook
$BTC
Galaxy’s Alex Thorn just dropped a chart that every Bitcoin investor needs to see right now. Yes, BTC has slipped back below its 50-week moving average, but before you panic, let’s look at the historical blueprint. 📊
According to Thorn’s latest research, we’ve seen this exact setup twice before after a bear market bottom—and neither time did the price end up making a new low. 🛡️
$GIGGLE
Here is the breakdown of the data
🔹 The 2012 Cycle: After reclaiming the 50-week average, Bitcoin lost it again for 20 weeks. It dropped 35%, but the low of $4.39 held 99% above the previous bear market floor of $2.20.
🔹 The 2019-20 Cycle: We saw five separate closes below the average. Despite the brutal March 2020 crash (which saw a 38% drop), the $5,359 low stayed 68% above the $3,195 bottom from Dec 2018. 🏗️
Fast forward to today: As of the week ending Nov. 8, 2026, Bitcoin closed at $74,968. It’s sitting 0.7% below the 50W average, ending a seven-week streak of closes above it since the Sept. 20 reclaim. 📉
Even more telling? The current price is still a massive 26% above the June 28 low of $59,517. 💪
$VIRTUAL
The one time this setup actually failed—during the 2021-22 bear market—the macro conditions were entirely different. Back then, investors faced a historic 329-day gap below the bear's low and a -68% distance from the prior cycle high. Today’s structure looks much more like the 2012 and 2019 recovery phases. 🧩
History doesn't always repeat, but it certainly rhymes. While short-term volatility is guaranteed, the data strongly suggests we are navigating a consolidation phase, not a new bearish collapse. 🌊
Please don’t forget to like, follow, and share! 🩸 Thank you so much ❤️
#BitcoinFiveWeeklyLosses #SouthKoreaDraftLawTargets15To20%ShareholderCap #CPITestsDecemberRateOutlook