
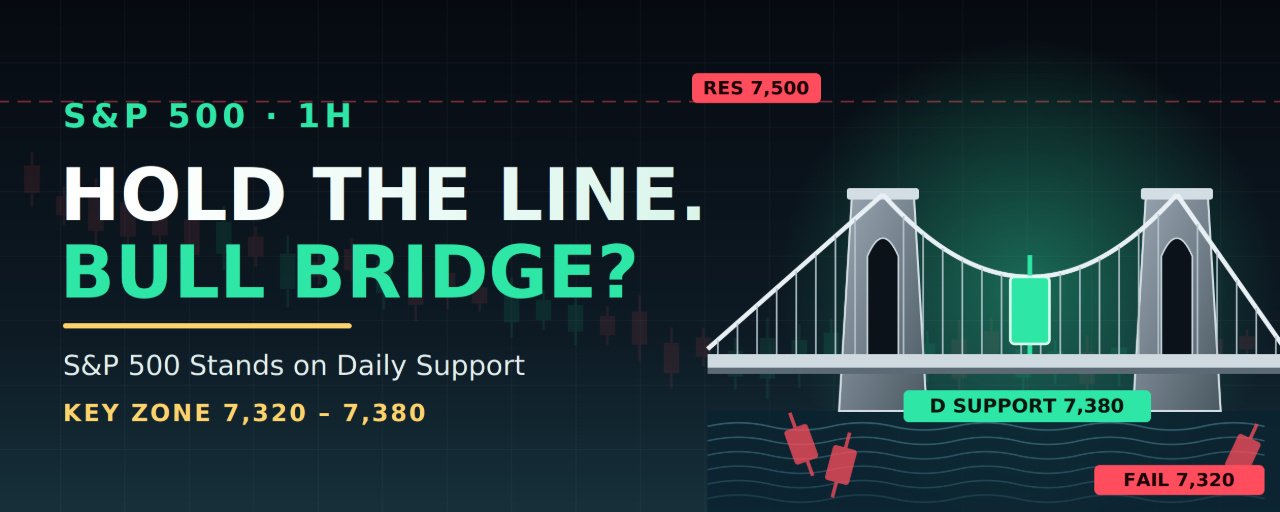

Chart: S&P 500 Index, 1H. Last price 7,376.86, which is Friday’s (Nov 6) close. The chart was captured Nov 8, 21:08 UTC, while US markets were closed.
Short answer: a bullish bounce is possible from here, but it is a bounce from support, not a trend change yet. Price sits right on a key level, and Tuesday’s inflation report could decide which way it breaks.
What happened this week
The S&P 500 fell about 2.7% in the week ending November 6, its worst week since the April 2025 tariff crash and its fourth straight weekly loss. The damage came on Thursday, November 5, when the index dropped about 4.4%, its biggest one-day fall since April 3, 2025. Reports tie the selloff to fears of tougher AI regulation after Democratic midterm wins, and chip and AI names led the declines.
Friday brought a bounce led by tech, but a hot October jobs report (unemployment 4.1%) pushed Fed rate-hike odds and the dollar higher. That kept stocks from recovering much.
What the chart shows
Downtrend since early October: the index peaked near 7,840 on October 6 and then made lower highs inside a descending channel.
Trendline broken: the white support line fell on November 5 when price gapped hard through it. That line, near 7,470–7,500 now, acts as resistance.
Bounce failed at 7,715: the labelled HH near 7,715 on November 3–4 was a rally within the downtrend, not a break of it, since it sits well below the 7,840 high.
Supply gaps overhead: the crash left red FVGs around 7,510–7,690, so sellers have unfinished business there.
Swing low and key level: the low sits near 7,360, and the green daily (“D”) level at about 7,380 is where price is now standing. Analysts also point to the 7,320–7,360 zone, where the long-term moving average sits, as the line in the sand.
Bull vs. bear read
The bullish case: price is on a daily level and on long-term average support after a sharp, news-driven flush. Some strategists, such as Truist’s CIO, call the AI selloff a likely long-term buying opportunity, and LPL called it a knee-jerk reaction to the midterms.
The bearish case: the structure is still lower highs, the trendline is broken, and the index has fallen four weeks in a row. Until price reclaims about 7,500, a bounce is just a bounce.
The catalyst: Tuesday’s CPI
October CPI is due Tuesday, November 10, at 8:30 a.m. ET. The previous report was hot, with September CPI up 0.6% on the month and 3.7% on the year, and one report put the 10-year yield above 5.3%. A cool core print would take pressure off the Fed and likely lift stocks. A hot one would raise hike odds and could turn Thursday’s rout into a warm-up. Expect gaps, so size positions accordingly or wait for the print.
Trade plan (long bias)
These levels are in index points. If you trade through futures, a CFD or a perpetual contract, check the equivalent levels on that instrument, since prices can differ slightly.
Setup A: support bounce (preferred)
Entry zone: 7,360–7,385, the daily level and the swing low
Stop loss: 7,315, below the 7,320 support
TP1: 7,420
TP2: 7,500, the trendline and the main resistance
TP3: 7,620
TP4: 7,690, near the top of the red gap
Setup B: breakout entry (confirmation)
Entry: a 1H candle close above 7,500, then a retest as support
Stop loss: 7,440
Targets: 7,620, then 7,690, then 7,715
Measured from 7,375 to the 7,315 stop, TP1 pays about 0.75R, so take partial profit there. TP2 pays about 2.1R, TP3 about 4.1R and TP4 about 5.3R. After TP1, consider moving the stop to breakeven.
Bearish alternative: if support fails
Trigger: a 1H close below 7,320, then a failed retest
Entry: 7,320–7,335
Stop loss: 7,380
Targets: 7,225, then 7,125, then 7,000
What invalidates the bullish idea
A 1H close below 7,320 means the long-term average zone failed.
A close below 7,250 would put the bear scenario in play: one weekly outlook sets that level with the VIX above 30 as the bear case.
A hot core CPI, at or above 0.3% on the month, would likely send price through support.
Live cross-check
The chart matches reality. Multiple sources, including Yahoo Finance, report the S&P 500 closed Friday at 7,376.86, the same figure as your chart. I could not pull a reliable Monday quote or the latest futures moves, so check the open before acting.
Bottom line
Bullish, with conditions. The S&P 500 is standing on a daily level and the long-term average after the biggest drop in over a year. The best long is a bounce at 7,360–7,385 with a tight stop under 7,315, then a take-profit ladder toward 7,500. Treat 7,420 as the first test and 7,500 as the real break. A close below 7,320 flips the bias, and CPI on Tuesday could make that call.
⚠️ Disclaimer: This is not financial advice. This analysis is for educational and informational purposes only. Financial markets are highly volatile, and you can lose your capital. Always do your own research, manage your risk, and never trade with money you can’t afford to lose.
@Binance Square Official #SPX500 #BinanceReopensWithdrawalsForHYPE&APT #SouthKoreaDraftLawTargets15To20%ShareholderCap #Binance #ChartSniper