
#chartsniper
chartsniper
閲覧回数 109,927
427人が討論中
注目
最新

·
--
記事
翻訳参照
ONT/USDT: The Higher Low That Could Flip This Downtrend on Its Head$ONT
{future}(ONTUSDT)
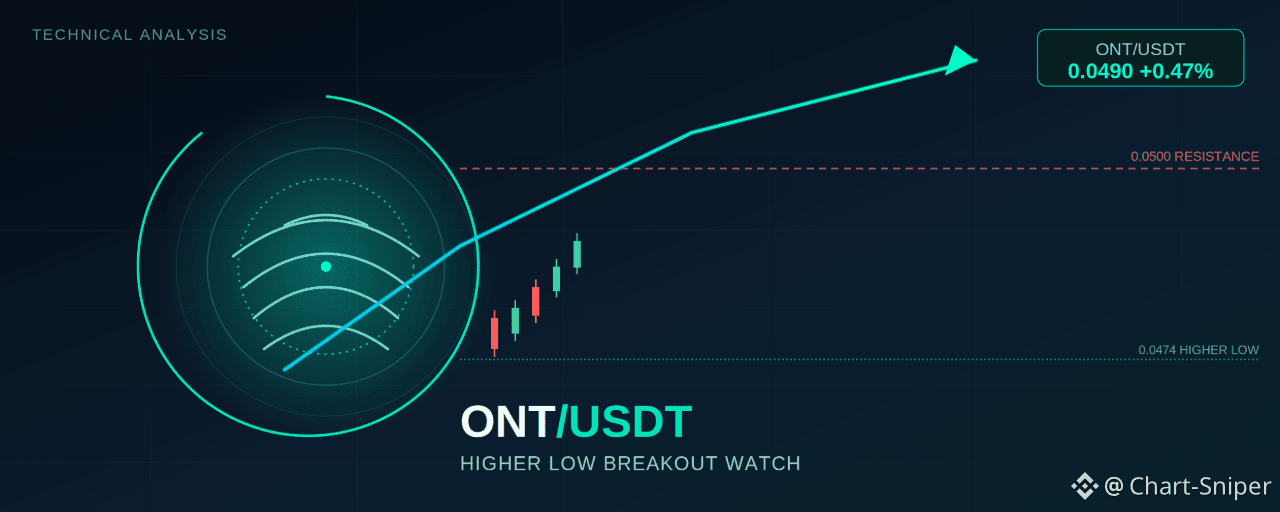
Ontology (ONT) has spent the better part of three sessions grinding lower against Tether, but the 15-minute chart is now showing the first real signs that sellers are losing their grip. After stamping a fresh Lower Low, price has carved out a Higher Low — and that single shift in structure is the crack in the downtrend that traders should be watching closely right now.
Reading the Structure
The chart tells a clean story of a fading downtrend. ONT/USDT printed a Lower Low, then rallied into a Lower High, rolled over again into a second Lower High, and finally found buyers at a Higher Low near 0.0474. That HL is the key development — it's the first sign in this sequence that sellers are no longer able to push price to a new floor.
Since that Higher Low, ONT has been building a tight base directly beneath a horizontal resistance shelf sitting between 0.0493 and 0.0500. A descending trendline connecting the two Lower Highs is converging on that same zone, creating a confluence of resistance right around current price. This is effectively a compression zone: a falling trendline pressing down, a horizontal ceiling capping upside, and a rising floor of higher lows pushing from below. Squeezes like this typically resolve with a decisive move, and right now momentum is leaning in the bulls' favor.
Momentum Confirms the Shift
RSI (14) is sitting at 60.95, with its moving average at 55.12 — both comfortably above the 50 midline and both sloping upward. That's a meaningful tell. During the initial leg down, RSI was pinned well below 50; the fact that it's now pushing into bullish territory alongside the Higher Low adds confluence to the idea that buyers are stepping back in rather than this being a dead-cat bounce.
Price last traded at 0.04901, up 0.47% on the session, and is currently pressing directly into the 0.0493 level — the lower boundary of the resistance shelf and, not coincidentally, right where the descending trendline is also cutting through.
Trade Setup
The bullish case: A clean breakout and hold above the 0.0493–0.0500 resistance shelf, especially if it comes with a retest that holds as new support, would confirm the downtrend is broken and open the door for a move back toward the origin of the last Lower High swing.
Aggressive entry: 0.0493–0.0496, on strength through the shelf with RSI staying above 55Conservative entry: 0.0500–0.0505, on a confirmed close above the resistance zone with a successful retest of 0.0500 as supportStop-loss: Below 0.0474 (beneath the Higher Low) — a break back under this level invalidates the reversal structure entirelyTarget 1: 0.0520Target 2: 0.0540 (near the origin of the prior Lower High swing)Target 3 (extended): 0.0570, only on strong volume follow-through
The bearish case: If price gets rejected at the 0.0493–0.0500 confluence zone again — this would be at least the third rejection from this general area — the descending trendline stays in control, and a retest of the 0.0474 Higher Low, followed by a break of it, would resume the broader downtrend toward new lows.
Short trigger: Rejection candle at 0.0495–0.0500 with RSI turning back down through 55Stop-loss: Above 0.0505Target 1: 0.0474Target 2: 0.0450 (measured move of the recent range)
The Bottom Line
ONT/USDT is at a genuine inflection point. The Higher Low plus rising RSI gives the bulls the benefit of the doubt short-term, but the 0.0493–0.0500 zone is a real wall that has already capped two prior rallies via the descending trendline. Watch how price behaves right at this level over the next few candles — a decisive close above 0.0500 is the confirmation bulls need, while continued rejection keeps this range-bound and tilts risk back toward the downside.
This analysis is based on technical chart structure and is for informational purposes only. It is not financial advice. Cryptocurrency markets are highly volatile — always do your own research and manage risk according to your own trading plan before entering any position.
@Binance_Square_Official #FedRateWatch #ZcashRises6% #XRPSinks10% #Binance #ChartSniper
ONT/USDT: The Higher Low That Could Flip This Downtrend on Its Head
$ONT
Ontology (ONT) has spent the better part of three sessions grinding lower against Tether, but the 15-minute chart is now showing the first real signs that sellers are losing their grip. After stamping a fresh Lower Low, price has carved out a Higher Low — and that single shift in structure is the crack in the downtrend that traders should be watching closely right now.
Reading the Structure
The chart tells a clean story of a fading downtrend. ONT/USDT printed a Lower Low, then rallied into a Lower High, rolled over again into a second Lower High, and finally found buyers at a Higher Low near 0.0474. That HL is the key development — it's the first sign in this sequence that sellers are no longer able to push price to a new floor.
Since that Higher Low, ONT has been building a tight base directly beneath a horizontal resistance shelf sitting between 0.0493 and 0.0500. A descending trendline connecting the two Lower Highs is converging on that same zone, creating a confluence of resistance right around current price. This is effectively a compression zone: a falling trendline pressing down, a horizontal ceiling capping upside, and a rising floor of higher lows pushing from below. Squeezes like this typically resolve with a decisive move, and right now momentum is leaning in the bulls' favor.
Momentum Confirms the Shift
RSI (14) is sitting at 60.95, with its moving average at 55.12 — both comfortably above the 50 midline and both sloping upward. That's a meaningful tell. During the initial leg down, RSI was pinned well below 50; the fact that it's now pushing into bullish territory alongside the Higher Low adds confluence to the idea that buyers are stepping back in rather than this being a dead-cat bounce.
Price last traded at 0.04901, up 0.47% on the session, and is currently pressing directly into the 0.0493 level — the lower boundary of the resistance shelf and, not coincidentally, right where the descending trendline is also cutting through.
Trade Setup
The bullish case: A clean breakout and hold above the 0.0493–0.0500 resistance shelf, especially if it comes with a retest that holds as new support, would confirm the downtrend is broken and open the door for a move back toward the origin of the last Lower High swing.
Aggressive entry: 0.0493–0.0496, on strength through the shelf with RSI staying above 55Conservative entry: 0.0500–0.0505, on a confirmed close above the resistance zone with a successful retest of 0.0500 as supportStop-loss: Below 0.0474 (beneath the Higher Low) — a break back under this level invalidates the reversal structure entirelyTarget 1: 0.0520Target 2: 0.0540 (near the origin of the prior Lower High swing)Target 3 (extended): 0.0570, only on strong volume follow-through
The bearish case: If price gets rejected at the 0.0493–0.0500 confluence zone again — this would be at least the third rejection from this general area — the descending trendline stays in control, and a retest of the 0.0474 Higher Low, followed by a break of it, would resume the broader downtrend toward new lows.
Short trigger: Rejection candle at 0.0495–0.0500 with RSI turning back down through 55Stop-loss: Above 0.0505Target 1: 0.0474Target 2: 0.0450 (measured move of the recent range)
The Bottom Line
ONT/USDT is at a genuine inflection point. The Higher Low plus rising RSI gives the bulls the benefit of the doubt short-term, but the 0.0493–0.0500 zone is a real wall that has already capped two prior rallies via the descending trendline. Watch how price behaves right at this level over the next few candles — a decisive close above 0.0500 is the confirmation bulls need, while continued rejection keeps this range-bound and tilts risk back toward the downside.
This analysis is based on technical chart structure and is for informational purposes only. It is not financial advice. Cryptocurrency markets are highly volatile — always do your own research and manage risk according to your own trading plan before entering any position.
@Binance Square Official #FedRateWatch #ZcashRises6% #XRPSinks10% #Binance #ChartSniper
Ontology (ONT) has spent the better part of three sessions grinding lower against Tether, but the 15-minute chart is now showing the first real signs that sellers are losing their grip. After stamping a fresh Lower Low, price has carved out a Higher Low — and that single shift in structure is the crack in the downtrend that traders should be watching closely right now.
Reading the Structure
The chart tells a clean story of a fading downtrend. ONT/USDT printed a Lower Low, then rallied into a Lower High, rolled over again into a second Lower High, and finally found buyers at a Higher Low near 0.0474. That HL is the key development — it's the first sign in this sequence that sellers are no longer able to push price to a new floor.
Since that Higher Low, ONT has been building a tight base directly beneath a horizontal resistance shelf sitting between 0.0493 and 0.0500. A descending trendline connecting the two Lower Highs is converging on that same zone, creating a confluence of resistance right around current price. This is effectively a compression zone: a falling trendline pressing down, a horizontal ceiling capping upside, and a rising floor of higher lows pushing from below. Squeezes like this typically resolve with a decisive move, and right now momentum is leaning in the bulls' favor.
Momentum Confirms the Shift
RSI (14) is sitting at 60.95, with its moving average at 55.12 — both comfortably above the 50 midline and both sloping upward. That's a meaningful tell. During the initial leg down, RSI was pinned well below 50; the fact that it's now pushing into bullish territory alongside the Higher Low adds confluence to the idea that buyers are stepping back in rather than this being a dead-cat bounce.
Price last traded at 0.04901, up 0.47% on the session, and is currently pressing directly into the 0.0493 level — the lower boundary of the resistance shelf and, not coincidentally, right where the descending trendline is also cutting through.
Trade Setup
The bullish case: A clean breakout and hold above the 0.0493–0.0500 resistance shelf, especially if it comes with a retest that holds as new support, would confirm the downtrend is broken and open the door for a move back toward the origin of the last Lower High swing.
Aggressive entry: 0.0493–0.0496, on strength through the shelf with RSI staying above 55Conservative entry: 0.0500–0.0505, on a confirmed close above the resistance zone with a successful retest of 0.0500 as supportStop-loss: Below 0.0474 (beneath the Higher Low) — a break back under this level invalidates the reversal structure entirelyTarget 1: 0.0520Target 2: 0.0540 (near the origin of the prior Lower High swing)Target 3 (extended): 0.0570, only on strong volume follow-through
The bearish case: If price gets rejected at the 0.0493–0.0500 confluence zone again — this would be at least the third rejection from this general area — the descending trendline stays in control, and a retest of the 0.0474 Higher Low, followed by a break of it, would resume the broader downtrend toward new lows.
Short trigger: Rejection candle at 0.0495–0.0500 with RSI turning back down through 55Stop-loss: Above 0.0505Target 1: 0.0474Target 2: 0.0450 (measured move of the recent range)
The Bottom Line
ONT/USDT is at a genuine inflection point. The Higher Low plus rising RSI gives the bulls the benefit of the doubt short-term, but the 0.0493–0.0500 zone is a real wall that has already capped two prior rallies via the descending trendline. Watch how price behaves right at this level over the next few candles — a decisive close above 0.0500 is the confirmation bulls need, while continued rejection keeps this range-bound and tilts risk back toward the downside.
This analysis is based on technical chart structure and is for informational purposes only. It is not financial advice. Cryptocurrency markets are highly volatile — always do your own research and manage risk according to your own trading plan before entering any position.
@Binance Square Official #FedRateWatch #ZcashRises6% #XRPSinks10% #Binance #ChartSniper
77
·
--
記事
翻訳参照
HEI/USDT Rockets Out of a Multi-Day Base — Can the Channel Keep Climbing?$HEI
{future}(HEIUSDT)
15M Chart | Binance Perpetual | HEIUSDT | September 16, 2026
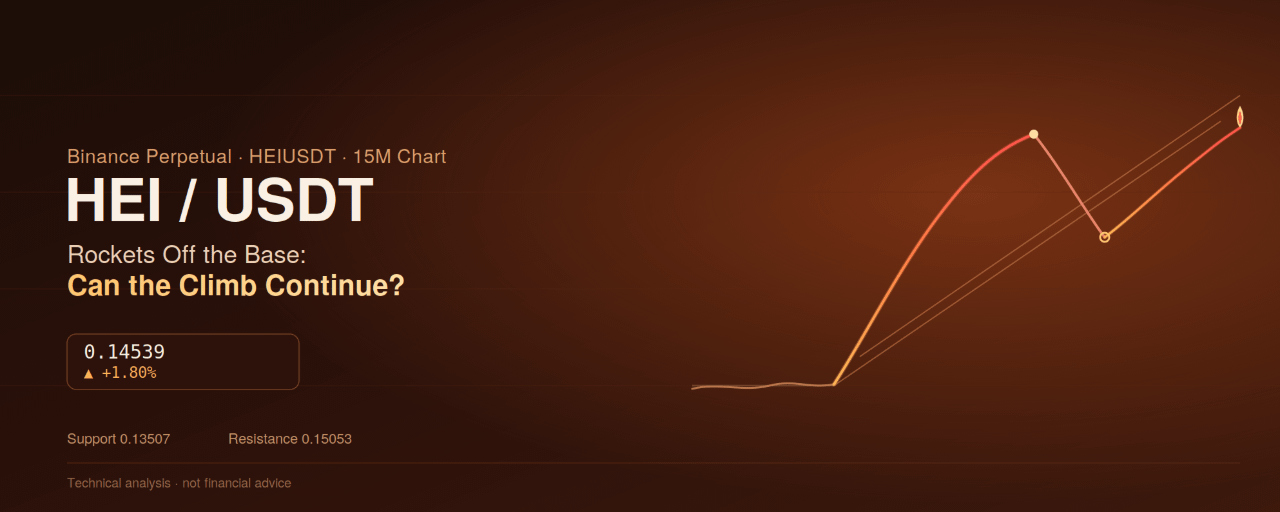
Heima (HEI) is trading at 0.14539, up a sharp +1.80% on the session after opening at 0.14282 and swinging between 0.14143 and 0.14608. That daily number barely captures the scale of what's happened over the past 24 hours: HEI has broken out of a long, flat base and gone almost parabolic, rallying more than 30% from its early-session lows to a fresh high before cooling into a textbook pullback that's now resolving back to the upside.
Reading the Structure
The setup begins with an extended period of quiet, rangebound trading held above a green support floor near 0.11133 — a level that had capped downside for hours without any real directional conviction. That base finally gave way around 06:00-07:00 on September 16, when HEI printed a lower high near 0.1105 and immediately reversed into an aggressive breakout.
From there, the move was fast and structured: price surged inside a well-defined ascending channel, marked by two parallel rising trendlines, climbing from the low-0.11s all the way to a higher high near 0.1505, tagging the red resistance line almost exactly. That's close to a 35% impulsive rally in a matter of hours — an unusually strong move that immediately triggered profit-taking.
The pullback that followed was sharp but controlled: HEI dropped to a lower low near 0.1350, right at the horizontal white support line, before buyers stepped back in. Since that low, price has been climbing again, riding the lower rail of the ascending channel back up to the current 0.14539 — a classic higher-low bounce inside an intact uptrend structure rather than a breakdown.
RSI (14) tells a constructive story: it spiked well above 80 during the initial breakout, cooled sharply during the pullback to the 0.1350 low, and has since recovered to 61.29 (signal at 55.46) — back above the neutral 50 line and rising, consistent with renewed buying pressure rather than exhaustion.
Key Levels to Watch
Major resistance: 0.15053 — the recent higher high and the level that triggered the first pullback; a confirmed break above this on volume would open fresh price discovery.Immediate support: 0.13507 — the horizontal level that held the recent lower low and is now backed by the rising channel trendline.Channel support: the lower ascending trendline, currently tracking through roughly 0.135–0.140 and rising with each 15-minute candle.Major support / invalidation: 0.11133 — the long-term base; a break back below this would undo the entire breakout structure, though it sits far below current price and is not an immediate concern.Upper channel boundary: the steeper white trendline running above the current channel, useful as a guide for how extended price can get before a deeper pullback becomes likely.
Two Ways to Approach the Trade
1. Channel support entry (favored, trend-aligned): Buying pullbacks toward the lower channel trendline and the 0.1350 support has worked cleanly on the most recent test, and offers a defined-risk way to ride the continuation.
Entry zone: 0.1400 – 0.1425 (on any dip back toward the channel's lower rail)Stop-loss: below 0.1340 (below the recent lower low and channel support)Target 1: 0.1505Target 2: an extension beyond 0.1505 if the breakout resumes with volume
2. Breakout continuation (momentum play): For traders looking for confirmation, a sustained close above 0.1505 with strong volume would validate the next leg of the move.
Entry trigger: sustained close above 0.1505Stop-loss: 0.1425 (back inside the recent range)Target 1: 0.1600Target 2: a further measured extension based on the size of the initial breakout leg
Given how quickly HEI recovered off the 0.1350 low and how well RSI has held above neutral through the pullback, the structure favors continuation — but a move this fast and steep also carries real risk of sharp volatility in both directions, so position sizing should stay conservative regardless of direction.
Next Gainer?
HEI's breakout from a multi-hour base into a near-35% impulsive rally, followed by a controlled pullback that respected both a horizontal support level and the channel's rising trendline, is one of the more aggressive momentum setups on the board today. If price holds the channel and clears 0.1505 with continued volume, HEI has real potential to be among the stronger short-term gainers given the speed of the move already in play. The key risk is the sheer size of the initial rally — parabolic moves like this can reverse just as fast as they formed, so a break of the channel and the 0.1350 support would be the first sign the move is losing steam.
This is not financial advice. Crypto perpetual contracts are highly leveraged, highly volatile instruments, and prices can move sharply against a position in minutes. Always do your own research, size positions responsibly, and use stop-losses before entering any trade.
@Binance_Square_Official #FedRateWatch #ZcashRises6% #XRPSinks10% #Binance #ChartSniper
HEI/USDT Rockets Out of a Multi-Day Base — Can the Channel Keep Climbing?
$HEI
15M Chart | Binance Perpetual | HEIUSDT | September 16, 2026
Heima (HEI) is trading at 0.14539, up a sharp +1.80% on the session after opening at 0.14282 and swinging between 0.14143 and 0.14608. That daily number barely captures the scale of what's happened over the past 24 hours: HEI has broken out of a long, flat base and gone almost parabolic, rallying more than 30% from its early-session lows to a fresh high before cooling into a textbook pullback that's now resolving back to the upside.
Reading the Structure
The setup begins with an extended period of quiet, rangebound trading held above a green support floor near 0.11133 — a level that had capped downside for hours without any real directional conviction. That base finally gave way around 06:00-07:00 on September 16, when HEI printed a lower high near 0.1105 and immediately reversed into an aggressive breakout.
From there, the move was fast and structured: price surged inside a well-defined ascending channel, marked by two parallel rising trendlines, climbing from the low-0.11s all the way to a higher high near 0.1505, tagging the red resistance line almost exactly. That's close to a 35% impulsive rally in a matter of hours — an unusually strong move that immediately triggered profit-taking.
The pullback that followed was sharp but controlled: HEI dropped to a lower low near 0.1350, right at the horizontal white support line, before buyers stepped back in. Since that low, price has been climbing again, riding the lower rail of the ascending channel back up to the current 0.14539 — a classic higher-low bounce inside an intact uptrend structure rather than a breakdown.
RSI (14) tells a constructive story: it spiked well above 80 during the initial breakout, cooled sharply during the pullback to the 0.1350 low, and has since recovered to 61.29 (signal at 55.46) — back above the neutral 50 line and rising, consistent with renewed buying pressure rather than exhaustion.
Key Levels to Watch
Major resistance: 0.15053 — the recent higher high and the level that triggered the first pullback; a confirmed break above this on volume would open fresh price discovery.Immediate support: 0.13507 — the horizontal level that held the recent lower low and is now backed by the rising channel trendline.Channel support: the lower ascending trendline, currently tracking through roughly 0.135–0.140 and rising with each 15-minute candle.Major support / invalidation: 0.11133 — the long-term base; a break back below this would undo the entire breakout structure, though it sits far below current price and is not an immediate concern.Upper channel boundary: the steeper white trendline running above the current channel, useful as a guide for how extended price can get before a deeper pullback becomes likely.
Two Ways to Approach the Trade
1. Channel support entry (favored, trend-aligned): Buying pullbacks toward the lower channel trendline and the 0.1350 support has worked cleanly on the most recent test, and offers a defined-risk way to ride the continuation.
Entry zone: 0.1400 – 0.1425 (on any dip back toward the channel's lower rail)Stop-loss: below 0.1340 (below the recent lower low and channel support)Target 1: 0.1505Target 2: an extension beyond 0.1505 if the breakout resumes with volume
2. Breakout continuation (momentum play): For traders looking for confirmation, a sustained close above 0.1505 with strong volume would validate the next leg of the move.
Entry trigger: sustained close above 0.1505Stop-loss: 0.1425 (back inside the recent range)Target 1: 0.1600Target 2: a further measured extension based on the size of the initial breakout leg
Given how quickly HEI recovered off the 0.1350 low and how well RSI has held above neutral through the pullback, the structure favors continuation — but a move this fast and steep also carries real risk of sharp volatility in both directions, so position sizing should stay conservative regardless of direction.
Next Gainer?
HEI's breakout from a multi-hour base into a near-35% impulsive rally, followed by a controlled pullback that respected both a horizontal support level and the channel's rising trendline, is one of the more aggressive momentum setups on the board today. If price holds the channel and clears 0.1505 with continued volume, HEI has real potential to be among the stronger short-term gainers given the speed of the move already in play. The key risk is the sheer size of the initial rally — parabolic moves like this can reverse just as fast as they formed, so a break of the channel and the 0.1350 support would be the first sign the move is losing steam.
This is not financial advice. Crypto perpetual contracts are highly leveraged, highly volatile instruments, and prices can move sharply against a position in minutes. Always do your own research, size positions responsibly, and use stop-losses before entering any trade.
@Binance Square Official #FedRateWatch #ZcashRises6% #XRPSinks10% #Binance #ChartSniper
15M Chart | Binance Perpetual | HEIUSDT | September 16, 2026
Heima (HEI) is trading at 0.14539, up a sharp +1.80% on the session after opening at 0.14282 and swinging between 0.14143 and 0.14608. That daily number barely captures the scale of what's happened over the past 24 hours: HEI has broken out of a long, flat base and gone almost parabolic, rallying more than 30% from its early-session lows to a fresh high before cooling into a textbook pullback that's now resolving back to the upside.
Reading the Structure
The setup begins with an extended period of quiet, rangebound trading held above a green support floor near 0.11133 — a level that had capped downside for hours without any real directional conviction. That base finally gave way around 06:00-07:00 on September 16, when HEI printed a lower high near 0.1105 and immediately reversed into an aggressive breakout.
From there, the move was fast and structured: price surged inside a well-defined ascending channel, marked by two parallel rising trendlines, climbing from the low-0.11s all the way to a higher high near 0.1505, tagging the red resistance line almost exactly. That's close to a 35% impulsive rally in a matter of hours — an unusually strong move that immediately triggered profit-taking.
The pullback that followed was sharp but controlled: HEI dropped to a lower low near 0.1350, right at the horizontal white support line, before buyers stepped back in. Since that low, price has been climbing again, riding the lower rail of the ascending channel back up to the current 0.14539 — a classic higher-low bounce inside an intact uptrend structure rather than a breakdown.
RSI (14) tells a constructive story: it spiked well above 80 during the initial breakout, cooled sharply during the pullback to the 0.1350 low, and has since recovered to 61.29 (signal at 55.46) — back above the neutral 50 line and rising, consistent with renewed buying pressure rather than exhaustion.
Key Levels to Watch
Major resistance: 0.15053 — the recent higher high and the level that triggered the first pullback; a confirmed break above this on volume would open fresh price discovery.Immediate support: 0.13507 — the horizontal level that held the recent lower low and is now backed by the rising channel trendline.Channel support: the lower ascending trendline, currently tracking through roughly 0.135–0.140 and rising with each 15-minute candle.Major support / invalidation: 0.11133 — the long-term base; a break back below this would undo the entire breakout structure, though it sits far below current price and is not an immediate concern.Upper channel boundary: the steeper white trendline running above the current channel, useful as a guide for how extended price can get before a deeper pullback becomes likely.
Two Ways to Approach the Trade
1. Channel support entry (favored, trend-aligned): Buying pullbacks toward the lower channel trendline and the 0.1350 support has worked cleanly on the most recent test, and offers a defined-risk way to ride the continuation.
Entry zone: 0.1400 – 0.1425 (on any dip back toward the channel's lower rail)Stop-loss: below 0.1340 (below the recent lower low and channel support)Target 1: 0.1505Target 2: an extension beyond 0.1505 if the breakout resumes with volume
2. Breakout continuation (momentum play): For traders looking for confirmation, a sustained close above 0.1505 with strong volume would validate the next leg of the move.
Entry trigger: sustained close above 0.1505Stop-loss: 0.1425 (back inside the recent range)Target 1: 0.1600Target 2: a further measured extension based on the size of the initial breakout leg
Given how quickly HEI recovered off the 0.1350 low and how well RSI has held above neutral through the pullback, the structure favors continuation — but a move this fast and steep also carries real risk of sharp volatility in both directions, so position sizing should stay conservative regardless of direction.
Next Gainer?
HEI's breakout from a multi-hour base into a near-35% impulsive rally, followed by a controlled pullback that respected both a horizontal support level and the channel's rising trendline, is one of the more aggressive momentum setups on the board today. If price holds the channel and clears 0.1505 with continued volume, HEI has real potential to be among the stronger short-term gainers given the speed of the move already in play. The key risk is the sheer size of the initial rally — parabolic moves like this can reverse just as fast as they formed, so a break of the channel and the 0.1350 support would be the first sign the move is losing steam.
This is not financial advice. Crypto perpetual contracts are highly leveraged, highly volatile instruments, and prices can move sharply against a position in minutes. Always do your own research, size positions responsibly, and use stop-losses before entering any trade.
@Binance Square Official #FedRateWatch #ZcashRises6% #XRPSinks10% #Binance #ChartSniper
117
·
--
記事
翻訳参照
AGLD/USDT Grinds Above a Rising Trendline — Is Adventure Gold Quietly Basing for a Move?$AGLD
{future}(AGLDUSDT)
1H Chart | Binance Spot | AGLDUSDT | September 16, 2026
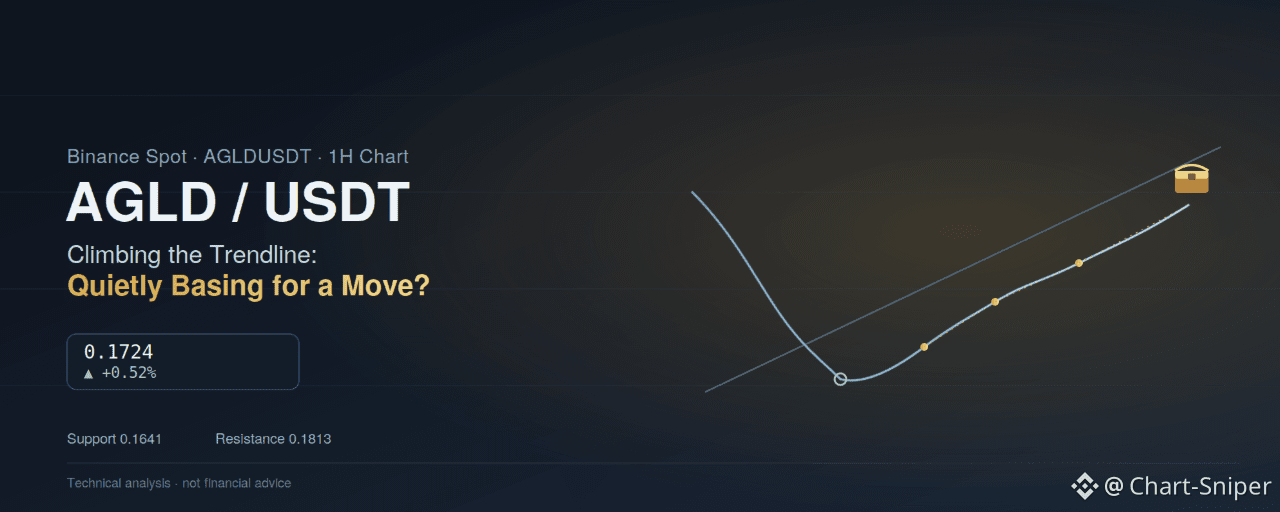
Adventure Gold (AGLD) is trading at 0.1724, up a modest +0.52% on the session after opening at 0.1716 and ranging between 0.1716 and 0.1729. Compared to the sharper, more explosive setups elsewhere on the board right now, AGLD's chart is quieter — but underneath that quiet is a structure worth watching: a token that fell hard from a recent high, found a floor, and has spent the last day and a half slowly climbing a defended trendline back toward the resistance that capped its last bounce.
Reading the Structure
The setup starts with a sharp rally into a higher high near 0.192 on September 13, followed by an equally sharp reversal that dragged AGLD back down through the entire prior range. That decline didn't stop cleanly — price ground lower through September 14-15, eventually carving out a lower low near 0.1656 by September 15-16, just above the major green support level at 0.1641.
From that low, AGLD has been climbing steadily along a rising trendline, connecting the 0.1656 low to the current price action. That climb produced a lower high near 0.1755 on September 16, tagging the upper edge of a gray consolidation zone before rolling over into a shallow pullback. Since then, price has held above the trendline and is grinding back up toward that same resistance, currently sitting at 0.1724.
Two horizontal levels frame the current range clearly: the white line at 0.1813 well above current price — a level AGLD hasn't tested since its initial decline — and the green support at 0.1641 far below, which has held as the structural floor since the September 16 low. Between those, the recent lower-high rejection at 0.1755 is the more immediate hurdle.
RSI (14) is sitting just above neutral at 56.74 (signal 49.64), having recovered from an oversold dip near 40 during the height of the decline. That's a modest but steady improvement — not the sharp, overbought spike seen in some of the more explosive setups elsewhere, but a gradual stabilization consistent with a base-building phase rather than continued distribution.
Key Levels to Watch
Immediate resistance: 0.1755 — the recent lower high and the top of the current consolidation pocket; this is the first level that needs to break for AGLD to signal real strength.Major resistance: 0.1813 — a clean, untested level well above current price; a break above 0.1755 with volume would put this in play.Trendline support: the rising trendline from the 0.1656 low, currently tracking up through roughly 0.170–0.172 and climbing with each hourly candle.Immediate support: 0.1690 – 0.1710 — the recent consolidation floor just below current price.Major support / invalidation: 0.1641 — the green support level; a clean break below this would undo the recovery structure and open a retest of deeper lows.
Two Ways to Approach the Trade
1. Trendline support entry (favored, lower risk): Buying dips toward the rising trendline, roughly where price is sitting right now, offers a defined-risk way to play the continuation of the recovery.
Entry zone: 0.1700 – 0.1720Stop-loss: below 0.1656 (below the recent low and trendline)Target 1: 0.1755Target 2: 0.1813, on a confirmed break of the 0.1755 resistance
2. Breakout continuation (momentum play): For traders wanting confirmation first, a sustained close above 0.1755 with rising volume would validate that AGLD is ready to challenge the higher 0.1813 level.
Entry trigger: sustained close above 0.1755Stop-loss: 0.1710 (back inside the recent range)Target 1: 0.1813Target 2: a further extension toward the 0.185–0.19 zone if momentum accelerates
Given how consistently the trendline has held and RSI's steady (if unspectacular) recovery, this setup favors a patient continuation play over a chase — the more compelling trigger is a clean break of 0.1755 rather than the current grind beneath it.
Next Gainer?
AGLD's structure is less dramatic than some of the sharper breakout patterns elsewhere right now, but the ingredients for a continuation move are present: a defended trendline, a higher low above major support, and RSI recovering without yet reaching overbought. If price clears 0.1755 with volume, AGLD has a reasonable path toward the untested 0.1813 level, which would put it on watch as a steady mover rather than an explosive one. The main risk is that this remains a token still well below its September 13 high, so any failure to hold the trendline would put the move back into a slower, range-bound consolidation.
This is not financial advice. Crypto spot and perpetual markets are highly volatile, and prices can move sharply in either direction in minutes. Always do your own research, size positions responsibly, and use stop-losses before entering any trade.
@Binance_Square_Official #FedRateWatch #ZcashRises6% #XRPSinks10% #Binance #ChartSniper
AGLD/USDT Grinds Above a Rising Trendline — Is Adventure Gold Quietly Basing for a Move?
$AGLD
1H Chart | Binance Spot | AGLDUSDT | September 16, 2026
Adventure Gold (AGLD) is trading at 0.1724, up a modest +0.52% on the session after opening at 0.1716 and ranging between 0.1716 and 0.1729. Compared to the sharper, more explosive setups elsewhere on the board right now, AGLD's chart is quieter — but underneath that quiet is a structure worth watching: a token that fell hard from a recent high, found a floor, and has spent the last day and a half slowly climbing a defended trendline back toward the resistance that capped its last bounce.
Reading the Structure
The setup starts with a sharp rally into a higher high near 0.192 on September 13, followed by an equally sharp reversal that dragged AGLD back down through the entire prior range. That decline didn't stop cleanly — price ground lower through September 14-15, eventually carving out a lower low near 0.1656 by September 15-16, just above the major green support level at 0.1641.
From that low, AGLD has been climbing steadily along a rising trendline, connecting the 0.1656 low to the current price action. That climb produced a lower high near 0.1755 on September 16, tagging the upper edge of a gray consolidation zone before rolling over into a shallow pullback. Since then, price has held above the trendline and is grinding back up toward that same resistance, currently sitting at 0.1724.
Two horizontal levels frame the current range clearly: the white line at 0.1813 well above current price — a level AGLD hasn't tested since its initial decline — and the green support at 0.1641 far below, which has held as the structural floor since the September 16 low. Between those, the recent lower-high rejection at 0.1755 is the more immediate hurdle.
RSI (14) is sitting just above neutral at 56.74 (signal 49.64), having recovered from an oversold dip near 40 during the height of the decline. That's a modest but steady improvement — not the sharp, overbought spike seen in some of the more explosive setups elsewhere, but a gradual stabilization consistent with a base-building phase rather than continued distribution.
Key Levels to Watch
Immediate resistance: 0.1755 — the recent lower high and the top of the current consolidation pocket; this is the first level that needs to break for AGLD to signal real strength.Major resistance: 0.1813 — a clean, untested level well above current price; a break above 0.1755 with volume would put this in play.Trendline support: the rising trendline from the 0.1656 low, currently tracking up through roughly 0.170–0.172 and climbing with each hourly candle.Immediate support: 0.1690 – 0.1710 — the recent consolidation floor just below current price.Major support / invalidation: 0.1641 — the green support level; a clean break below this would undo the recovery structure and open a retest of deeper lows.
Two Ways to Approach the Trade
1. Trendline support entry (favored, lower risk): Buying dips toward the rising trendline, roughly where price is sitting right now, offers a defined-risk way to play the continuation of the recovery.
Entry zone: 0.1700 – 0.1720Stop-loss: below 0.1656 (below the recent low and trendline)Target 1: 0.1755Target 2: 0.1813, on a confirmed break of the 0.1755 resistance
2. Breakout continuation (momentum play): For traders wanting confirmation first, a sustained close above 0.1755 with rising volume would validate that AGLD is ready to challenge the higher 0.1813 level.
Entry trigger: sustained close above 0.1755Stop-loss: 0.1710 (back inside the recent range)Target 1: 0.1813Target 2: a further extension toward the 0.185–0.19 zone if momentum accelerates
Given how consistently the trendline has held and RSI's steady (if unspectacular) recovery, this setup favors a patient continuation play over a chase — the more compelling trigger is a clean break of 0.1755 rather than the current grind beneath it.
Next Gainer?
AGLD's structure is less dramatic than some of the sharper breakout patterns elsewhere right now, but the ingredients for a continuation move are present: a defended trendline, a higher low above major support, and RSI recovering without yet reaching overbought. If price clears 0.1755 with volume, AGLD has a reasonable path toward the untested 0.1813 level, which would put it on watch as a steady mover rather than an explosive one. The main risk is that this remains a token still well below its September 13 high, so any failure to hold the trendline would put the move back into a slower, range-bound consolidation.
This is not financial advice. Crypto spot and perpetual markets are highly volatile, and prices can move sharply in either direction in minutes. Always do your own research, size positions responsibly, and use stop-losses before entering any trade.
@Binance Square Official #FedRateWatch #ZcashRises6% #XRPSinks10% #Binance #ChartSniper
1H Chart | Binance Spot | AGLDUSDT | September 16, 2026
Adventure Gold (AGLD) is trading at 0.1724, up a modest +0.52% on the session after opening at 0.1716 and ranging between 0.1716 and 0.1729. Compared to the sharper, more explosive setups elsewhere on the board right now, AGLD's chart is quieter — but underneath that quiet is a structure worth watching: a token that fell hard from a recent high, found a floor, and has spent the last day and a half slowly climbing a defended trendline back toward the resistance that capped its last bounce.
Reading the Structure
The setup starts with a sharp rally into a higher high near 0.192 on September 13, followed by an equally sharp reversal that dragged AGLD back down through the entire prior range. That decline didn't stop cleanly — price ground lower through September 14-15, eventually carving out a lower low near 0.1656 by September 15-16, just above the major green support level at 0.1641.
From that low, AGLD has been climbing steadily along a rising trendline, connecting the 0.1656 low to the current price action. That climb produced a lower high near 0.1755 on September 16, tagging the upper edge of a gray consolidation zone before rolling over into a shallow pullback. Since then, price has held above the trendline and is grinding back up toward that same resistance, currently sitting at 0.1724.
Two horizontal levels frame the current range clearly: the white line at 0.1813 well above current price — a level AGLD hasn't tested since its initial decline — and the green support at 0.1641 far below, which has held as the structural floor since the September 16 low. Between those, the recent lower-high rejection at 0.1755 is the more immediate hurdle.
RSI (14) is sitting just above neutral at 56.74 (signal 49.64), having recovered from an oversold dip near 40 during the height of the decline. That's a modest but steady improvement — not the sharp, overbought spike seen in some of the more explosive setups elsewhere, but a gradual stabilization consistent with a base-building phase rather than continued distribution.
Key Levels to Watch
Immediate resistance: 0.1755 — the recent lower high and the top of the current consolidation pocket; this is the first level that needs to break for AGLD to signal real strength.Major resistance: 0.1813 — a clean, untested level well above current price; a break above 0.1755 with volume would put this in play.Trendline support: the rising trendline from the 0.1656 low, currently tracking up through roughly 0.170–0.172 and climbing with each hourly candle.Immediate support: 0.1690 – 0.1710 — the recent consolidation floor just below current price.Major support / invalidation: 0.1641 — the green support level; a clean break below this would undo the recovery structure and open a retest of deeper lows.
Two Ways to Approach the Trade
1. Trendline support entry (favored, lower risk): Buying dips toward the rising trendline, roughly where price is sitting right now, offers a defined-risk way to play the continuation of the recovery.
Entry zone: 0.1700 – 0.1720Stop-loss: below 0.1656 (below the recent low and trendline)Target 1: 0.1755Target 2: 0.1813, on a confirmed break of the 0.1755 resistance
2. Breakout continuation (momentum play): For traders wanting confirmation first, a sustained close above 0.1755 with rising volume would validate that AGLD is ready to challenge the higher 0.1813 level.
Entry trigger: sustained close above 0.1755Stop-loss: 0.1710 (back inside the recent range)Target 1: 0.1813Target 2: a further extension toward the 0.185–0.19 zone if momentum accelerates
Given how consistently the trendline has held and RSI's steady (if unspectacular) recovery, this setup favors a patient continuation play over a chase — the more compelling trigger is a clean break of 0.1755 rather than the current grind beneath it.
Next Gainer?
AGLD's structure is less dramatic than some of the sharper breakout patterns elsewhere right now, but the ingredients for a continuation move are present: a defended trendline, a higher low above major support, and RSI recovering without yet reaching overbought. If price clears 0.1755 with volume, AGLD has a reasonable path toward the untested 0.1813 level, which would put it on watch as a steady mover rather than an explosive one. The main risk is that this remains a token still well below its September 13 high, so any failure to hold the trendline would put the move back into a slower, range-bound consolidation.
This is not financial advice. Crypto spot and perpetual markets are highly volatile, and prices can move sharply in either direction in minutes. Always do your own research, size positions responsibly, and use stop-losses before entering any trade.
@Binance Square Official #FedRateWatch #ZcashRises6% #XRPSinks10% #Binance #ChartSniper
51
·
--
記事
LA/USDT 上昇チャネルの中で上昇中――次のブレイクはもう仕込まれている?$LA
15分足チャート|Binance パーペチュアル|LAUSDT|2026年9月16日
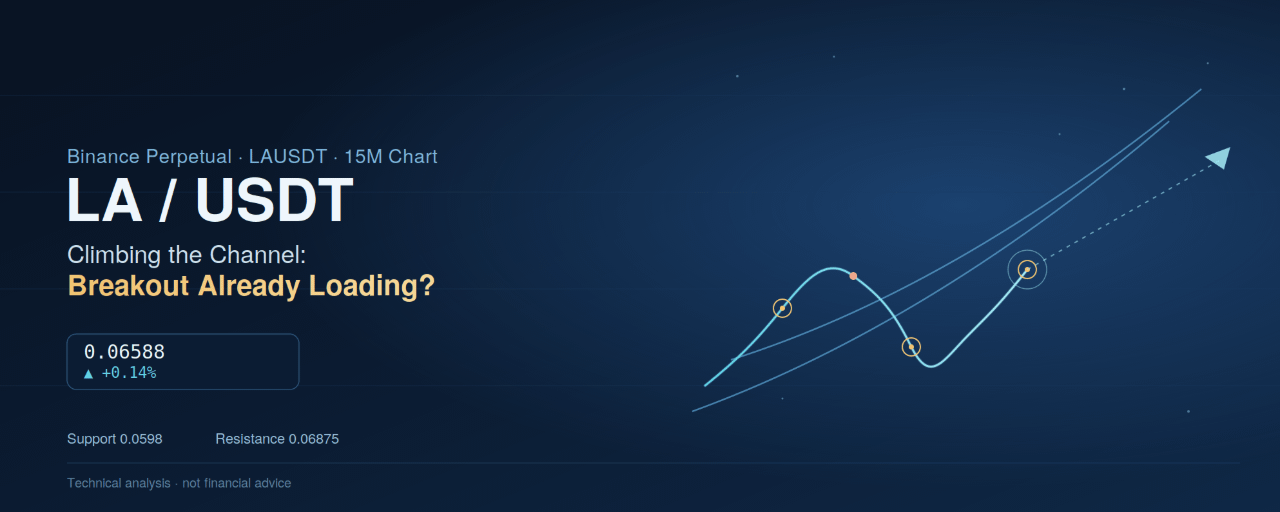
ラグランジュ(LA)は0.06588で取引されており、セッション開始が0.06578であった後、0.06597の高値と0.06561の安値の間で推移しつつ、わずか+0.14%上昇です。日足のローソク足は横ばいに見えますが、その下の構造は決して静的ではありません――今週序盤の急な2日間の売りの後、LAは過去1.5日間をかけて本物の上昇チャネルを形成し、下側レールから3回目の反発をして、直近の上昇トライを押し止めた抵抗へ向かってじわじわと戻しています。
LA/USDT 上昇チャネルの中で上昇中――次のブレイクはもう仕込まれている?
$LA
15分足チャート|Binance パーペチュアル|LAUSDT|2026年9月16日
ラグランジュ(LA)は0.06588で取引されており、セッション開始が0.06578であった後、0.06597の高値と0.06561の安値の間で推移しつつ、わずか+0.14%上昇です。日足のローソク足は横ばいに見えますが、その下の構造は決して静的ではありません――今週序盤の急な2日間の売りの後、LAは過去1.5日間をかけて本物の上昇チャネルを形成し、下側レールから3回目の反発をして、直近の上昇トライを押し止めた抵抗へ向かってじわじわと戻しています。
15分足チャート|Binance パーペチュアル|LAUSDT|2026年9月16日
ラグランジュ(LA)は0.06588で取引されており、セッション開始が0.06578であった後、0.06597の高値と0.06561の安値の間で推移しつつ、わずか+0.14%上昇です。日足のローソク足は横ばいに見えますが、その下の構造は決して静的ではありません――今週序盤の急な2日間の売りの後、LAは過去1.5日間をかけて本物の上昇チャネルを形成し、下側レールから3回目の反発をして、直近の上昇トライを押し止めた抵抗へ向かってじわじわと戻しています。
190
·
--
📉 $ZEC USDT — ショート・セットアップ
ZECは$1,178–$1,217付近です。直近で$1,200以上から鋭い下落(急な調整)が入りました。モメンタムは依然として不安定で、反転後も売り手が活発です。
🔴 ショート・エントリー:現在の市場価格
🛑 SL:$1,300
🎯 TP1:$1,100
🎯 TP2:$1,020
🎯 TP3:$950
⚡ エントリー:現在の市場価格 — すぐに執行可能。
⚠️ これは金融アドバイスではありません。リスク管理を慎重に行ってください。
@Binance_Square_Official #FedRateWatch #ZcashRises6% #XRPSinks10% #Binance #ChartSniper
{future}(ZECUSDT)
📉 $ZEC USDT — ショート・セットアップ
ZECは$1,178–$1,217付近です。直近で$1,200以上から鋭い下落(急な調整)が入りました。モメンタムは依然として不安定で、反転後も売り手が活発です。
🔴 ショート・エントリー:現在の市場価格
🛑 SL:$1,300
🎯 TP1:$1,100
🎯 TP2:$1,020
🎯 TP3:$950
⚡ エントリー:現在の市場価格 — すぐに執行可能。
⚠️ これは金融アドバイスではありません。リスク管理を慎重に行ってください。
@Binance Square Official #FedRateWatch #ZcashRises6% #XRPSinks10% #Binance #ChartSniper
ZECは$1,178–$1,217付近です。直近で$1,200以上から鋭い下落(急な調整)が入りました。モメンタムは依然として不安定で、反転後も売り手が活発です。
🔴 ショート・エントリー:現在の市場価格
🛑 SL:$1,300
🎯 TP1:$1,100
🎯 TP2:$1,020
🎯 TP3:$950
⚡ エントリー:現在の市場価格 — すぐに執行可能。
⚠️ これは金融アドバイスではありません。リスク管理を慎重に行ってください。
@Binance Square Official #FedRateWatch #ZcashRises6% #XRPSinks10% #Binance #ChartSniper
191
·
--

記事
NOT/USDT、岐路に立つコイル — Notcoinはどちらへブレイクするのか?$NOT
1H チャート | Binance スポット | NOTUSDT | 2026年9月11日
Notcoin(NOT)は0.000431で取引されており、本日+0.70%の小幅な上昇です。0.000428で寄り付き、0.000428から0.000432の範囲で推移しています。いま板の他の場所に出ているような鋭く決定的な動きとは対照的に、NOTのチャートは迷いの物語を語っています——断たれた上昇トレンドと、1週間以上保たれてきたサポートの棚の間に挟まれたトークンで、明確な分岐点に近づくにつれて価格がますます狭いレンジへ圧縮されているのです。
NOT/USDT、岐路に立つコイル — Notcoinはどちらへブレイクするのか?
$NOT
1H チャート | Binance スポット | NOTUSDT | 2026年9月11日
Notcoin(NOT)は0.000431で取引されており、本日+0.70%の小幅な上昇です。0.000428で寄り付き、0.000428から0.000432の範囲で推移しています。いま板の他の場所に出ているような鋭く決定的な動きとは対照的に、NOTのチャートは迷いの物語を語っています——断たれた上昇トレンドと、1週間以上保たれてきたサポートの棚の間に挟まれたトークンで、明確な分岐点に近づくにつれて価格がますます狭いレンジへ圧縮されているのです。
1H チャート | Binance スポット | NOTUSDT | 2026年9月11日
Notcoin(NOT)は0.000431で取引されており、本日+0.70%の小幅な上昇です。0.000428で寄り付き、0.000428から0.000432の範囲で推移しています。いま板の他の場所に出ているような鋭く決定的な動きとは対照的に、NOTのチャートは迷いの物語を語っています——断たれた上昇トレンドと、1週間以上保たれてきたサポートの棚の間に挟まれたトークンで、明確な分岐点に近づくにつれて価格がますます狭いレンジへ圧縮されているのです。
136
·
--

記事
CATI/USDT、安値から階段状に形成—次の上昇局面は来るか?$CATI
1Hチャート | Binanceパーペチュアル | CATIUSDT | 2026年9月11日
Catizen(CATI)は0.06116で取引されており、本日+0.81%です。0.06066で寄り付いた後、0.06148の高値と0.06061の安値の間で推移しました。これは落ち着いた日次レンジですが、掲示板上でもっとも建設的なリカバリー構造の一つの上に位置しています。強く急落したトークンが持続可能な安値を見つけ、直近1週間は、明確に定義されたレジスタンスの棚の下で、本物の階段状に「より高い高値」を積み上げています。
構造の読み取り
CATI/USDT、安値から階段状に形成—次の上昇局面は来るか?
$CATI
1Hチャート | Binanceパーペチュアル | CATIUSDT | 2026年9月11日
Catizen(CATI)は0.06116で取引されており、本日+0.81%です。0.06066で寄り付いた後、0.06148の高値と0.06061の安値の間で推移しました。これは落ち着いた日次レンジですが、掲示板上でもっとも建設的なリカバリー構造の一つの上に位置しています。強く急落したトークンが持続可能な安値を見つけ、直近1週間は、明確に定義されたレジスタンスの棚の下で、本物の階段状に「より高い高値」を積み上げています。
構造の読み取り
1Hチャート | Binanceパーペチュアル | CATIUSDT | 2026年9月11日
Catizen(CATI)は0.06116で取引されており、本日+0.81%です。0.06066で寄り付いた後、0.06148の高値と0.06061の安値の間で推移しました。これは落ち着いた日次レンジですが、掲示板上でもっとも建設的なリカバリー構造の一つの上に位置しています。強く急落したトークンが持続可能な安値を見つけ、直近1週間は、明確に定義されたレジスタンスの棚の下で、本物の階段状に「より高い高値」を積み上げています。
構造の読み取り
loseere:
bro I am in Big problem lost my all money Wich was 700 hundred it was for my mother treatment plz help what do 🙏
1
127
·
--

記事
翻訳参照
THETA/USDT Explodes Off the Lows — Is a New Uptrend Just Getting Started?$THETA
{future}(THETAUSDT)
1H Chart | Binance Perpetual | THETAUSDT | September 11, 2026
Theta Token is trading at 0.1906, up +1.06% on the day after opening at 0.1886 and swinging between a low of 0.1884 and a high of 0.1914. The daily candle looks unremarkable on its own, but it's sitting on top of one of the sharpest impulsive moves THETA has made in weeks — a rally that took price from a fresh low near 0.1685 to a higher high above 0.2073 in a matter of hours, before cooling into a healthy retracement that's now setting up the next decision point.
Reading the Structure
The setup starts with a clear lower-high, lower-low decline: THETA topped out near 0.1958 on September 7, then spent the following days grinding lower through a series of declining swings, eventually flushing down to a fresh low around 0.1685 on September 10-11. That low marks the anchor of the Fibonacci retracement now drawn on the chart.
From that low, THETA didn't just bounce — it ripped. Price broke the descending structure entirely, tore through the 0.236, 0.382, 0.5, 0.618, and 0.786 retracement levels in a single push, and printed a higher high above 0.2073 (the 1.0 Fib extension), briefly tagging the psychological 0.2047 resistance zone in the process. That's a five-level reclaim in one impulsive candle sequence — a strong signal of aggressive buying, not a weak short-covering bounce.
Since that spike, price has pulled back to 0.1906, landing almost exactly between the 0.5 (0.1879) and 0.618 (0.1925) retracement levels — a textbook healthy pullback zone after a strong impulse leg. The rising white trendline connecting the 0.1685 low to the more recent higher low is still intact and currently tracks just under current price, reinforcing that buyers are stepping in on dips rather than letting the move fully unwind.
RSI (14) tells the same story: it spiked to nearly 75 during the impulsive rally, has since cooled to 69.60 (signal at 55.44), and is holding well above the neutral 50 line — momentum has eased but hasn't broken down, which is consistent with a pause inside an uptrend rather than a reversal.
Key Levels to Watch
Major resistance: 0.2047–0.2073 — the prior swing high and the 1.0 Fibonacci extension; this zone capped the initial rally and needs to break with volume for the next leg to extend.Extended target: 0.2313 — the 1.618 Fibonacci extension, the next logical objective if 0.2073 clears cleanly.Immediate support: 0.1879 – 0.1925 — the 0.5–0.618 retracement band that price is currently consolidating inside.Trendline support: the rising white trendline from the 0.1685 low, currently tracking near 0.1870–0.1890 and rising.Major support / invalidation: 0.1834 — the 0.382 retracement; a clean break and close below this level would suggest the pullback is turning into a deeper correction, with 0.1685 as the next real support beneath it.
Two Ways to Approach the Trade
1. Pullback entry inside the retracement zone (favored, trend-aligned): Buying the current consolidation between the 0.5 and 0.618 retracement levels offers a reasonable entry with a defined invalidation just below the rising trendline.
Entry zone: 0.1879 – 0.1925Stop-loss: below 0.1834 (below the 0.382 retracement and trendline)Target 1: 0.2047Target 2: 0.2073, extending toward 0.2313 on continuation
2. Breakout continuation (momentum play): For traders who want confirmation before entering, a sustained close above 0.2047 with rising volume would confirm buyers are ready to challenge the prior high directly.
Entry trigger: sustained close above 0.2047Stop-loss: 0.1925 (below the 0.618 retracement)Target 1: 0.2073Target 2: 0.2313 (1.618 extension)
Given how cleanly the initial impulse reclaimed the entire Fibonacci grid and how well the pullback has respected the rising trendline so far, the structure favors continuation over reversal — but 0.2047–0.2073 remains the level that decides whether this becomes a genuine new leg higher or another failed test of the range top.
Next Gainer?
THETA's move off the 0.1685 low stands out for its speed and conviction — a full retracement reclaim followed by a controlled pullback that's holding above the midpoint of the rally is a constructive pattern, not an exhausted one. If price holds above 0.1879 and clears 0.2047 with volume, THETA has a credible path toward the 1.618 extension near 0.2313, which would put it among the stronger short-term performers on the board. The key risk is a failure to hold trendline support, which would open a deeper retest of 0.1685 before any further upside attempt.
This is not financial advice. Crypto perpetual contracts are highly leveraged, highly volatile instruments, and prices can move sharply against a position in minutes. Always do your own research, size positions responsibly, and use stop-losses before entering any trade.
@Binance_Square_Official #CPIWatch #BitcoinReboundsAbove$79KAfterCPI #BNBTops730USDT #Binance #ChartSniper
THETA/USDT Explodes Off the Lows — Is a New Uptrend Just Getting Started?
$THETA
1H Chart | Binance Perpetual | THETAUSDT | September 11, 2026
Theta Token is trading at 0.1906, up +1.06% on the day after opening at 0.1886 and swinging between a low of 0.1884 and a high of 0.1914. The daily candle looks unremarkable on its own, but it's sitting on top of one of the sharpest impulsive moves THETA has made in weeks — a rally that took price from a fresh low near 0.1685 to a higher high above 0.2073 in a matter of hours, before cooling into a healthy retracement that's now setting up the next decision point.
Reading the Structure
The setup starts with a clear lower-high, lower-low decline: THETA topped out near 0.1958 on September 7, then spent the following days grinding lower through a series of declining swings, eventually flushing down to a fresh low around 0.1685 on September 10-11. That low marks the anchor of the Fibonacci retracement now drawn on the chart.
From that low, THETA didn't just bounce — it ripped. Price broke the descending structure entirely, tore through the 0.236, 0.382, 0.5, 0.618, and 0.786 retracement levels in a single push, and printed a higher high above 0.2073 (the 1.0 Fib extension), briefly tagging the psychological 0.2047 resistance zone in the process. That's a five-level reclaim in one impulsive candle sequence — a strong signal of aggressive buying, not a weak short-covering bounce.
Since that spike, price has pulled back to 0.1906, landing almost exactly between the 0.5 (0.1879) and 0.618 (0.1925) retracement levels — a textbook healthy pullback zone after a strong impulse leg. The rising white trendline connecting the 0.1685 low to the more recent higher low is still intact and currently tracks just under current price, reinforcing that buyers are stepping in on dips rather than letting the move fully unwind.
RSI (14) tells the same story: it spiked to nearly 75 during the impulsive rally, has since cooled to 69.60 (signal at 55.44), and is holding well above the neutral 50 line — momentum has eased but hasn't broken down, which is consistent with a pause inside an uptrend rather than a reversal.
Key Levels to Watch
Major resistance: 0.2047–0.2073 — the prior swing high and the 1.0 Fibonacci extension; this zone capped the initial rally and needs to break with volume for the next leg to extend.Extended target: 0.2313 — the 1.618 Fibonacci extension, the next logical objective if 0.2073 clears cleanly.Immediate support: 0.1879 – 0.1925 — the 0.5–0.618 retracement band that price is currently consolidating inside.Trendline support: the rising white trendline from the 0.1685 low, currently tracking near 0.1870–0.1890 and rising.Major support / invalidation: 0.1834 — the 0.382 retracement; a clean break and close below this level would suggest the pullback is turning into a deeper correction, with 0.1685 as the next real support beneath it.
Two Ways to Approach the Trade
1. Pullback entry inside the retracement zone (favored, trend-aligned): Buying the current consolidation between the 0.5 and 0.618 retracement levels offers a reasonable entry with a defined invalidation just below the rising trendline.
Entry zone: 0.1879 – 0.1925Stop-loss: below 0.1834 (below the 0.382 retracement and trendline)Target 1: 0.2047Target 2: 0.2073, extending toward 0.2313 on continuation
2. Breakout continuation (momentum play): For traders who want confirmation before entering, a sustained close above 0.2047 with rising volume would confirm buyers are ready to challenge the prior high directly.
Entry trigger: sustained close above 0.2047Stop-loss: 0.1925 (below the 0.618 retracement)Target 1: 0.2073Target 2: 0.2313 (1.618 extension)
Given how cleanly the initial impulse reclaimed the entire Fibonacci grid and how well the pullback has respected the rising trendline so far, the structure favors continuation over reversal — but 0.2047–0.2073 remains the level that decides whether this becomes a genuine new leg higher or another failed test of the range top.
Next Gainer?
THETA's move off the 0.1685 low stands out for its speed and conviction — a full retracement reclaim followed by a controlled pullback that's holding above the midpoint of the rally is a constructive pattern, not an exhausted one. If price holds above 0.1879 and clears 0.2047 with volume, THETA has a credible path toward the 1.618 extension near 0.2313, which would put it among the stronger short-term performers on the board. The key risk is a failure to hold trendline support, which would open a deeper retest of 0.1685 before any further upside attempt.
This is not financial advice. Crypto perpetual contracts are highly leveraged, highly volatile instruments, and prices can move sharply against a position in minutes. Always do your own research, size positions responsibly, and use stop-losses before entering any trade.
@Binance Square Official #CPIWatch #BitcoinReboundsAbove$79KAfterCPI #BNBTops730USDT #Binance #ChartSniper
1H Chart | Binance Perpetual | THETAUSDT | September 11, 2026
Theta Token is trading at 0.1906, up +1.06% on the day after opening at 0.1886 and swinging between a low of 0.1884 and a high of 0.1914. The daily candle looks unremarkable on its own, but it's sitting on top of one of the sharpest impulsive moves THETA has made in weeks — a rally that took price from a fresh low near 0.1685 to a higher high above 0.2073 in a matter of hours, before cooling into a healthy retracement that's now setting up the next decision point.
Reading the Structure
The setup starts with a clear lower-high, lower-low decline: THETA topped out near 0.1958 on September 7, then spent the following days grinding lower through a series of declining swings, eventually flushing down to a fresh low around 0.1685 on September 10-11. That low marks the anchor of the Fibonacci retracement now drawn on the chart.
From that low, THETA didn't just bounce — it ripped. Price broke the descending structure entirely, tore through the 0.236, 0.382, 0.5, 0.618, and 0.786 retracement levels in a single push, and printed a higher high above 0.2073 (the 1.0 Fib extension), briefly tagging the psychological 0.2047 resistance zone in the process. That's a five-level reclaim in one impulsive candle sequence — a strong signal of aggressive buying, not a weak short-covering bounce.
Since that spike, price has pulled back to 0.1906, landing almost exactly between the 0.5 (0.1879) and 0.618 (0.1925) retracement levels — a textbook healthy pullback zone after a strong impulse leg. The rising white trendline connecting the 0.1685 low to the more recent higher low is still intact and currently tracks just under current price, reinforcing that buyers are stepping in on dips rather than letting the move fully unwind.
RSI (14) tells the same story: it spiked to nearly 75 during the impulsive rally, has since cooled to 69.60 (signal at 55.44), and is holding well above the neutral 50 line — momentum has eased but hasn't broken down, which is consistent with a pause inside an uptrend rather than a reversal.
Key Levels to Watch
Major resistance: 0.2047–0.2073 — the prior swing high and the 1.0 Fibonacci extension; this zone capped the initial rally and needs to break with volume for the next leg to extend.Extended target: 0.2313 — the 1.618 Fibonacci extension, the next logical objective if 0.2073 clears cleanly.Immediate support: 0.1879 – 0.1925 — the 0.5–0.618 retracement band that price is currently consolidating inside.Trendline support: the rising white trendline from the 0.1685 low, currently tracking near 0.1870–0.1890 and rising.Major support / invalidation: 0.1834 — the 0.382 retracement; a clean break and close below this level would suggest the pullback is turning into a deeper correction, with 0.1685 as the next real support beneath it.
Two Ways to Approach the Trade
1. Pullback entry inside the retracement zone (favored, trend-aligned): Buying the current consolidation between the 0.5 and 0.618 retracement levels offers a reasonable entry with a defined invalidation just below the rising trendline.
Entry zone: 0.1879 – 0.1925Stop-loss: below 0.1834 (below the 0.382 retracement and trendline)Target 1: 0.2047Target 2: 0.2073, extending toward 0.2313 on continuation
2. Breakout continuation (momentum play): For traders who want confirmation before entering, a sustained close above 0.2047 with rising volume would confirm buyers are ready to challenge the prior high directly.
Entry trigger: sustained close above 0.2047Stop-loss: 0.1925 (below the 0.618 retracement)Target 1: 0.2073Target 2: 0.2313 (1.618 extension)
Given how cleanly the initial impulse reclaimed the entire Fibonacci grid and how well the pullback has respected the rising trendline so far, the structure favors continuation over reversal — but 0.2047–0.2073 remains the level that decides whether this becomes a genuine new leg higher or another failed test of the range top.
Next Gainer?
THETA's move off the 0.1685 low stands out for its speed and conviction — a full retracement reclaim followed by a controlled pullback that's holding above the midpoint of the rally is a constructive pattern, not an exhausted one. If price holds above 0.1879 and clears 0.2047 with volume, THETA has a credible path toward the 1.618 extension near 0.2313, which would put it among the stronger short-term performers on the board. The key risk is a failure to hold trendline support, which would open a deeper retest of 0.1685 before any further upside attempt.
This is not financial advice. Crypto perpetual contracts are highly leveraged, highly volatile instruments, and prices can move sharply against a position in minutes. Always do your own research, size positions responsibly, and use stop-losses before entering any trade.
@Binance Square Official #CPIWatch #BitcoinReboundsAbove$79KAfterCPI #BNBTops730USDT #Binance #ChartSniper
70
·
--

記事
AT/USDTは失ったあらゆる水準を取り戻した——トレンドはもう反転したのか?$AT
1時間足チャート | バイナンス・パーペチュアル | ATUSDT | 2026年9月11日
ATは0.1529で取引されています。セッションでは+0.53%で、高値0.1536・安値0.1519を付けました。このわずかな日次の数字では表しきれないのは、チャート上で今まさに起きたことです。過去24時間でATは、直近レンジ内で最も鋭いリバーサルの一つを演じ、9月7日の高値以降、すべての上昇を抑え続けてきた一連の既存のレジスタンス群をストレートに突き抜けました。こうした動きは、「様子見(watch and wait)」のチャートを「実行可能なセットアップ(active setup)」へ変えてしまうタイプです。
AT/USDTは失ったあらゆる水準を取り戻した——トレンドはもう反転したのか?
$AT
1時間足チャート | バイナンス・パーペチュアル | ATUSDT | 2026年9月11日
ATは0.1529で取引されています。セッションでは+0.53%で、高値0.1536・安値0.1519を付けました。このわずかな日次の数字では表しきれないのは、チャート上で今まさに起きたことです。過去24時間でATは、直近レンジ内で最も鋭いリバーサルの一つを演じ、9月7日の高値以降、すべての上昇を抑え続けてきた一連の既存のレジスタンス群をストレートに突き抜けました。こうした動きは、「様子見(watch and wait)」のチャートを「実行可能なセットアップ(active setup)」へ変えてしまうタイプです。
1時間足チャート | バイナンス・パーペチュアル | ATUSDT | 2026年9月11日
ATは0.1529で取引されています。セッションでは+0.53%で、高値0.1536・安値0.1519を付けました。このわずかな日次の数字では表しきれないのは、チャート上で今まさに起きたことです。過去24時間でATは、直近レンジ内で最も鋭いリバーサルの一つを演じ、9月7日の高値以降、すべての上昇を抑え続けてきた一連の既存のレジスタンス群をストレートに突き抜けました。こうした動きは、「様子見(watch and wait)」のチャートを「実行可能なセットアップ(active setup)」へ変えてしまうタイプです。
96
·
--

記事
翻訳参照
LIT/USDT Rejected Again — Is the Downtrend Ready for One More Leg Lower?$LIT
{future}(LITUSDT)
15M Chart | Binance Perpetual | LITUSDT | September 11, 2026
Lighter (LIT) is trading at 4.4168 after opening the session at 4.4160 and swinging between a high of 4.4340 and a low of 4.3645 — a quiet, almost flat candle on the surface, but the structure underneath tells a more decisive story. Since putting in a higher high near 5.25 on September 9, LIT has been carving out a textbook descending channel: lower highs, a clean break of the prior range low, and a rejection at a well-defined resistance trendline that has now been tested and denied three separate times.
Reading the Structure
The move started with a strong higher high just above 5.25, followed by an immediate loss of momentum. Price rolled over into a descending trendline that connects that high to two subsequent lower-high rejections — the first near 4.60 and the second, more recent, a failed push into the 4.8361 resistance zone (marked in red) that stalled almost exactly on the trendline itself.
In between those two rejections, sellers drove price into a fresh lower low around 4.30, confirming the broader trend has flipped from consolidation into active downside. The bounce off that low was sharp — LIT rallied hard back up toward 4.83 — but the fact that it topped out precisely on the descending trendline, rather than breaking through it, is the key tell here. That's a lower high forming inside an established downtrend, not a trend reversal.
Since that rejection, price has been sliding back down through the horizontal support/resistance band between 4.45 and 4.65, and now sits right on top of the lower edge of that band at 4.4168. The RSI (14) backs up the weakening picture: it spiked toward 75 during the rally into the LH, and has since rolled over hard to 44.33, slipping back below its signal line and trending toward the 25–50 zone that typically accompanies renewed selling pressure.
Key Levels to Watch
Major resistance / trend cap: 4.8361 — the recent lower-high and the level the descending trendline currently intersects. A close above this with volume is the first sign the downtrend is losing control.Immediate resistance: the upper edge of the current support band near 4.60–4.65.Immediate support: 4.45 — the lower edge of the current consolidation band; this is the level price is testing right now.Major support: 4.30 — the prior lower low; a break below this reopens the downside with no clear structure until much lower prices.Trendline resistance: descending from the 5.25 high, currently tracking down through roughly 4.55–4.60 and falling — as long as price stays under this line, the bias remains bearish.
Two Ways to Approach the Trade
1. Breakdown continuation (aligned with the trend): The dominant structure is still bearish — lower highs, a broken range low, and RSI rolling over from overbought all favor sellers. A confirmed break of the 4.45 support with a 15M close below it would confirm continuation toward the prior low.
Entry trigger: sustained close below 4.4500Stop-loss: 4.6500 (above the recent lower-high shelf and back above the trendline)Target 1: 4.3600Target 2: 4.3000 (prior swing low)
2. Range/bounce trade (counter-trend, higher risk): Aggressive traders may look to fade the lower edge of the current band, since price has held 4.45 on the first test. This is a lower-probability, mean-reversion play against the dominant trend and should be sized accordingly.
Entry zone: 4.4000 – 4.4500 on signs of a reaction (rejection wick, RSI turning up from below 40)Stop-loss: below 4.30 (below the confirmed lower low)Target 1: 4.60Target 2: 4.75, only on a break back above the descending trendline
Given the strength of the rejection at 4.83 and the trendline still sloping down, the breakdown-continuation setup lines up better with the current structure. The counter-trend bounce is a scalp idea for traders comfortable moving against the primary trend, not a swing position.
Bottom Line
LIT's rally attempt was capped almost perfectly by a well-respected descending trendline, and momentum has since faded fast, with RSI back under 45 and price pressing on support. Unless buyers can reclaim 4.65 and close back above the trendline, the path of least resistance stays down toward the 4.30 low and potentially lower. Watch the 4.45 level closely — how it holds over the next few 15-minute candles should decide which side takes control next.
This is not financial advice. Crypto perpetual contracts are highly leveraged, highly volatile instruments, and prices can move sharply against a position in minutes. Always do your own research, size positions responsibly, and use stop-losses before entering any trade.
@Binance_Square_Official #CPIWatch #BitcoinReboundsAbove$79KAfterCPI #BNBTops730USDT #Binance #ChartSniper
Content
LIT/USDT Rejected Again — Is the Downtrend Ready for One More Leg Lower?
$LIT
15M Chart | Binance Perpetual | LITUSDT | September 11, 2026
Lighter (LIT) is trading at 4.4168 after opening the session at 4.4160 and swinging between a high of 4.4340 and a low of 4.3645 — a quiet, almost flat candle on the surface, but the structure underneath tells a more decisive story. Since putting in a higher high near 5.25 on September 9, LIT has been carving out a textbook descending channel: lower highs, a clean break of the prior range low, and a rejection at a well-defined resistance trendline that has now been tested and denied three separate times.
Reading the Structure
The move started with a strong higher high just above 5.25, followed by an immediate loss of momentum. Price rolled over into a descending trendline that connects that high to two subsequent lower-high rejections — the first near 4.60 and the second, more recent, a failed push into the 4.8361 resistance zone (marked in red) that stalled almost exactly on the trendline itself.
In between those two rejections, sellers drove price into a fresh lower low around 4.30, confirming the broader trend has flipped from consolidation into active downside. The bounce off that low was sharp — LIT rallied hard back up toward 4.83 — but the fact that it topped out precisely on the descending trendline, rather than breaking through it, is the key tell here. That's a lower high forming inside an established downtrend, not a trend reversal.
Since that rejection, price has been sliding back down through the horizontal support/resistance band between 4.45 and 4.65, and now sits right on top of the lower edge of that band at 4.4168. The RSI (14) backs up the weakening picture: it spiked toward 75 during the rally into the LH, and has since rolled over hard to 44.33, slipping back below its signal line and trending toward the 25–50 zone that typically accompanies renewed selling pressure.
Key Levels to Watch
Major resistance / trend cap: 4.8361 — the recent lower-high and the level the descending trendline currently intersects. A close above this with volume is the first sign the downtrend is losing control.Immediate resistance: the upper edge of the current support band near 4.60–4.65.Immediate support: 4.45 — the lower edge of the current consolidation band; this is the level price is testing right now.Major support: 4.30 — the prior lower low; a break below this reopens the downside with no clear structure until much lower prices.Trendline resistance: descending from the 5.25 high, currently tracking down through roughly 4.55–4.60 and falling — as long as price stays under this line, the bias remains bearish.
Two Ways to Approach the Trade
1. Breakdown continuation (aligned with the trend): The dominant structure is still bearish — lower highs, a broken range low, and RSI rolling over from overbought all favor sellers. A confirmed break of the 4.45 support with a 15M close below it would confirm continuation toward the prior low.
Entry trigger: sustained close below 4.4500Stop-loss: 4.6500 (above the recent lower-high shelf and back above the trendline)Target 1: 4.3600Target 2: 4.3000 (prior swing low)
2. Range/bounce trade (counter-trend, higher risk): Aggressive traders may look to fade the lower edge of the current band, since price has held 4.45 on the first test. This is a lower-probability, mean-reversion play against the dominant trend and should be sized accordingly.
Entry zone: 4.4000 – 4.4500 on signs of a reaction (rejection wick, RSI turning up from below 40)Stop-loss: below 4.30 (below the confirmed lower low)Target 1: 4.60Target 2: 4.75, only on a break back above the descending trendline
Given the strength of the rejection at 4.83 and the trendline still sloping down, the breakdown-continuation setup lines up better with the current structure. The counter-trend bounce is a scalp idea for traders comfortable moving against the primary trend, not a swing position.
Bottom Line
LIT's rally attempt was capped almost perfectly by a well-respected descending trendline, and momentum has since faded fast, with RSI back under 45 and price pressing on support. Unless buyers can reclaim 4.65 and close back above the trendline, the path of least resistance stays down toward the 4.30 low and potentially lower. Watch the 4.45 level closely — how it holds over the next few 15-minute candles should decide which side takes control next.
This is not financial advice. Crypto perpetual contracts are highly leveraged, highly volatile instruments, and prices can move sharply against a position in minutes. Always do your own research, size positions responsibly, and use stop-losses before entering any trade.
@Binance Square Official #CPIWatch #BitcoinReboundsAbove$79KAfterCPI #BNBTops730USDT #Binance #ChartSniper
Content
15M Chart | Binance Perpetual | LITUSDT | September 11, 2026
Lighter (LIT) is trading at 4.4168 after opening the session at 4.4160 and swinging between a high of 4.4340 and a low of 4.3645 — a quiet, almost flat candle on the surface, but the structure underneath tells a more decisive story. Since putting in a higher high near 5.25 on September 9, LIT has been carving out a textbook descending channel: lower highs, a clean break of the prior range low, and a rejection at a well-defined resistance trendline that has now been tested and denied three separate times.
Reading the Structure
The move started with a strong higher high just above 5.25, followed by an immediate loss of momentum. Price rolled over into a descending trendline that connects that high to two subsequent lower-high rejections — the first near 4.60 and the second, more recent, a failed push into the 4.8361 resistance zone (marked in red) that stalled almost exactly on the trendline itself.
In between those two rejections, sellers drove price into a fresh lower low around 4.30, confirming the broader trend has flipped from consolidation into active downside. The bounce off that low was sharp — LIT rallied hard back up toward 4.83 — but the fact that it topped out precisely on the descending trendline, rather than breaking through it, is the key tell here. That's a lower high forming inside an established downtrend, not a trend reversal.
Since that rejection, price has been sliding back down through the horizontal support/resistance band between 4.45 and 4.65, and now sits right on top of the lower edge of that band at 4.4168. The RSI (14) backs up the weakening picture: it spiked toward 75 during the rally into the LH, and has since rolled over hard to 44.33, slipping back below its signal line and trending toward the 25–50 zone that typically accompanies renewed selling pressure.
Key Levels to Watch
Major resistance / trend cap: 4.8361 — the recent lower-high and the level the descending trendline currently intersects. A close above this with volume is the first sign the downtrend is losing control.Immediate resistance: the upper edge of the current support band near 4.60–4.65.Immediate support: 4.45 — the lower edge of the current consolidation band; this is the level price is testing right now.Major support: 4.30 — the prior lower low; a break below this reopens the downside with no clear structure until much lower prices.Trendline resistance: descending from the 5.25 high, currently tracking down through roughly 4.55–4.60 and falling — as long as price stays under this line, the bias remains bearish.
Two Ways to Approach the Trade
1. Breakdown continuation (aligned with the trend): The dominant structure is still bearish — lower highs, a broken range low, and RSI rolling over from overbought all favor sellers. A confirmed break of the 4.45 support with a 15M close below it would confirm continuation toward the prior low.
Entry trigger: sustained close below 4.4500Stop-loss: 4.6500 (above the recent lower-high shelf and back above the trendline)Target 1: 4.3600Target 2: 4.3000 (prior swing low)
2. Range/bounce trade (counter-trend, higher risk): Aggressive traders may look to fade the lower edge of the current band, since price has held 4.45 on the first test. This is a lower-probability, mean-reversion play against the dominant trend and should be sized accordingly.
Entry zone: 4.4000 – 4.4500 on signs of a reaction (rejection wick, RSI turning up from below 40)Stop-loss: below 4.30 (below the confirmed lower low)Target 1: 4.60Target 2: 4.75, only on a break back above the descending trendline
Given the strength of the rejection at 4.83 and the trendline still sloping down, the breakdown-continuation setup lines up better with the current structure. The counter-trend bounce is a scalp idea for traders comfortable moving against the primary trend, not a swing position.
Bottom Line
LIT's rally attempt was capped almost perfectly by a well-respected descending trendline, and momentum has since faded fast, with RSI back under 45 and price pressing on support. Unless buyers can reclaim 4.65 and close back above the trendline, the path of least resistance stays down toward the 4.30 low and potentially lower. Watch the 4.45 level closely — how it holds over the next few 15-minute candles should decide which side takes control next.
This is not financial advice. Crypto perpetual contracts are highly leveraged, highly volatile instruments, and prices can move sharply against a position in minutes. Always do your own research, size positions responsibly, and use stop-losses before entering any trade.
@Binance Square Official #CPIWatch #BitcoinReboundsAbove$79KAfterCPI #BNBTops730USDT #Binance #ChartSniper
Content
234
·
--

記事
MMT/USDT:勢いを失った――ドミノ効果がサポートを次々と倒し続ける$MMT
アセット: MMT/USDT パーペチュアル | 時間足: 15M | 取引所: Binance
MMTのチャートは、倒れていくドミノの連鎖のように読めます。2日間、0.1670〜0.1710のレンジで推移(明確なLower Highによって示される)したのち、9月9〜10日に売り手が主導権を握り、攻撃的なインパルスの一撃でサポートをまっすぐ突き破って、0.155付近のLower Lowまで押し込みました。それ以降、このペアは明確な下降トレンドラインの中でじりじりと下落を続け、ついに0.1484でHigher Lowを形成した後、0.1550への急反発を試みました。しかしその反発は直ちに拒否され、トレンドラインへ押し戻されています。現在の価格は0.1508で、当日(セッション)では0.79%下落しており、その下落していくレジスタンスラインの下に依然として閉じ込められています。
MMT/USDT:勢いを失った――ドミノ効果がサポートを次々と倒し続ける
$MMT
アセット: MMT/USDT パーペチュアル | 時間足: 15M | 取引所: Binance
MMTのチャートは、倒れていくドミノの連鎖のように読めます。2日間、0.1670〜0.1710のレンジで推移(明確なLower Highによって示される)したのち、9月9〜10日に売り手が主導権を握り、攻撃的なインパルスの一撃でサポートをまっすぐ突き破って、0.155付近のLower Lowまで押し込みました。それ以降、このペアは明確な下降トレンドラインの中でじりじりと下落を続け、ついに0.1484でHigher Lowを形成した後、0.1550への急反発を試みました。しかしその反発は直ちに拒否され、トレンドラインへ押し戻されています。現在の価格は0.1508で、当日(セッション)では0.79%下落しており、その下落していくレジスタンスラインの下に依然として閉じ込められています。
アセット: MMT/USDT パーペチュアル | 時間足: 15M | 取引所: Binance
MMTのチャートは、倒れていくドミノの連鎖のように読めます。2日間、0.1670〜0.1710のレンジで推移(明確なLower Highによって示される)したのち、9月9〜10日に売り手が主導権を握り、攻撃的なインパルスの一撃でサポートをまっすぐ突き破って、0.155付近のLower Lowまで押し込みました。それ以降、このペアは明確な下降トレンドラインの中でじりじりと下落を続け、ついに0.1484でHigher Lowを形成した後、0.1550への急反発を試みました。しかしその反発は直ちに拒否され、トレンドラインへ押し戻されています。現在の価格は0.1508で、当日(セッション)では0.79%下落しており、その下落していくレジスタンスラインの下に依然として閉じ込められています。
320
·
--

記事
PUMP/USDT: 脈動が弱まる — 重要なサポートを下回り構造が崩れる$PUMP
アセット: PUMP/USDT パーペチュアル | 指標期間: 1H | 取引所: Binance
PUMPは、ミーム寄りのトークンで感情(センチメント)がいかに速く反転し得るかを、まさに教科書通りに見せつけました。9月上旬のベース付近(0.0035)から力強く上昇して、0.0048に向けたきれいなインパルス・レグを形成した後、価格は高値を更新(Higher High)—するとすぐに、より低い構造の形成を始めました。1Hチャートでは、完了したLH → HH → LL → HLの一連の流れが示されており、直近の足はちょうどHLを下抜けました。0フィボナッチ・レベル(0.003506)をウィックで突き抜けた後、0.003539でクローズしており、当セッションでは4%以上下落しています。
PUMP/USDT: 脈動が弱まる — 重要なサポートを下回り構造が崩れる
$PUMP
アセット: PUMP/USDT パーペチュアル | 指標期間: 1H | 取引所: Binance
PUMPは、ミーム寄りのトークンで感情(センチメント)がいかに速く反転し得るかを、まさに教科書通りに見せつけました。9月上旬のベース付近(0.0035)から力強く上昇して、0.0048に向けたきれいなインパルス・レグを形成した後、価格は高値を更新(Higher High)—するとすぐに、より低い構造の形成を始めました。1Hチャートでは、完了したLH → HH → LL → HLの一連の流れが示されており、直近の足はちょうどHLを下抜けました。0フィボナッチ・レベル(0.003506)をウィックで突き抜けた後、0.003539でクローズしており、当セッションでは4%以上下落しています。
アセット: PUMP/USDT パーペチュアル | 指標期間: 1H | 取引所: Binance
PUMPは、ミーム寄りのトークンで感情(センチメント)がいかに速く反転し得るかを、まさに教科書通りに見せつけました。9月上旬のベース付近(0.0035)から力強く上昇して、0.0048に向けたきれいなインパルス・レグを形成した後、価格は高値を更新(Higher High)—するとすぐに、より低い構造の形成を始めました。1Hチャートでは、完了したLH → HH → LL → HLの一連の流れが示されており、直近の足はちょうどHLを下抜けました。0フィボナッチ・レベル(0.003506)をウィックで突き抜けた後、0.003539でクローズしており、当セッションでは4%以上下落しています。
195
·
--
翻訳参照
📈 $DEXE USDT — LONG SETUP
DEXE is trading around $1.96, with recent selling pressure creating a potential support zone. A hold above $1.90–$1.95 could trigger a recovery toward the next resistance levels. Technical structure favors a cautious rebound setup.
🟢 ENTRY: $1.96
🛑 SL: $1.84
🎯 TP1: $2.10
🎯 TP2: $2.25
🎯 TP3: $2.40
⚡ Entry is executable now.
⚠️ Not financial advice. Manage risk carefully.
@Binance_Square_Official #USAugustPPIRisesLessThanExpected #SECApprovesNasdaqTexasCommodityTrustRule #ECBRaisesRatesSecondTimeTo2.5% #Binance #ChartSniper
{future}(DEXEUSDT)
📈 $DEXE USDT — LONG SETUP
DEXE is trading around $1.96, with recent selling pressure creating a potential support zone. A hold above $1.90–$1.95 could trigger a recovery toward the next resistance levels. Technical structure favors a cautious rebound setup.
🟢 ENTRY: $1.96
🛑 SL: $1.84
🎯 TP1: $2.10
🎯 TP2: $2.25
🎯 TP3: $2.40
⚡ Entry is executable now.
⚠️ Not financial advice. Manage risk carefully.
@Binance Square Official #USAugustPPIRisesLessThanExpected #SECApprovesNasdaqTexasCommodityTrustRule #ECBRaisesRatesSecondTimeTo2.5% #Binance #ChartSniper
DEXE is trading around $1.96, with recent selling pressure creating a potential support zone. A hold above $1.90–$1.95 could trigger a recovery toward the next resistance levels. Technical structure favors a cautious rebound setup.
🟢 ENTRY: $1.96
🛑 SL: $1.84
🎯 TP1: $2.10
🎯 TP2: $2.25
🎯 TP3: $2.40
⚡ Entry is executable now.
⚠️ Not financial advice. Manage risk carefully.
@Binance Square Official #USAugustPPIRisesLessThanExpected #SECApprovesNasdaqTexasCommodityTrustRule #ECBRaisesRatesSecondTimeTo2.5% #Binance #ChartSniper
206
·
--
📉 $SAGA USDT — ショートセットアップ
SAGAは$0.0142付近で取引されており、過去24時間で約3〜4%下落しています。価格は直近の$0.0150のレジスタンスを下回ったままで、リジェクト後の弱気圧力が続いています。
🔴 ショートエントリー: $0.01420
🛑 SL: $0.01480
🎯 TP1: $0.01370
🎯 TP2: $0.01320
🎯 TP3: $0.01280
⚡ エントリーは現在の市場価格で実行可能です。
⚠️ これは金融アドバイスではありません。リスク管理を慎重に行ってください。
@Binance_Square_Official #USAugustPPIRisesLessThanExpected #SECApprovesNasdaqTexasCommodityTrustRule #ECBRaisesRatesSecondTimeTo2.5% #Binance #ChartSniper
{future}(SAGAUSDT)
📉 $SAGA USDT — ショートセットアップ
SAGAは$0.0142付近で取引されており、過去24時間で約3〜4%下落しています。価格は直近の$0.0150のレジスタンスを下回ったままで、リジェクト後の弱気圧力が続いています。
🔴 ショートエントリー: $0.01420
🛑 SL: $0.01480
🎯 TP1: $0.01370
🎯 TP2: $0.01320
🎯 TP3: $0.01280
⚡ エントリーは現在の市場価格で実行可能です。
⚠️ これは金融アドバイスではありません。リスク管理を慎重に行ってください。
@Binance Square Official #USAugustPPIRisesLessThanExpected #SECApprovesNasdaqTexasCommodityTrustRule #ECBRaisesRatesSecondTimeTo2.5% #Binance #ChartSniper
SAGAは$0.0142付近で取引されており、過去24時間で約3〜4%下落しています。価格は直近の$0.0150のレジスタンスを下回ったままで、リジェクト後の弱気圧力が続いています。
🔴 ショートエントリー: $0.01420
🛑 SL: $0.01480
🎯 TP1: $0.01370
🎯 TP2: $0.01320
🎯 TP3: $0.01280
⚡ エントリーは現在の市場価格で実行可能です。
⚠️ これは金融アドバイスではありません。リスク管理を慎重に行ってください。
@Binance Square Official #USAugustPPIRisesLessThanExpected #SECApprovesNasdaqTexasCommodityTrustRule #ECBRaisesRatesSecondTimeTo2.5% #Binance #ChartSniper
127
·
--
記事
NEAR Protocolが新高値から押し戻される──上昇トレンドのブリッジはまだ健在か?$NEAR
NEAR(NEAR/USDT パーペチュアル)は、新しいローカル高値を付けた後、冷静さを取り戻しつつあります。1Hチャートでは、価格は2.616で始まり、2.639まで急騰したのち、2.526の安値まで売られ、その後2.552付近に落ち着き、足は-2.45%となっています。9月上旬の安値からの強い数日間の上昇の後で、これはトレンド転換というよりは、まだ維持されている上昇トレンドの中で起きる通常の押し戻しに見えます。ただし、現在のサポートの棚で次の数本のローソク足が、本当のところを教えてくれるでしょう。
構造を読む
このチャート全体でのより大きな動きは、きれいな衝動的な上昇(インパルス)です。価格は1.882付近の安値更新(Lower Low: LL)で底を打ち、安値切り下げの高値圏(Lower High: LH)へ戻り、その後もう一度下げてから、より高値の連続(Higher Highs: HH)へと決定的に上抜けました。最初は2.30台中盤から2.40台(チャート上の「Retracement Area」ボックス)でレジスタンスをテストし、そこでいったん保ち合ったのち、最新のHHである2.639へ勢いよく到達しています。
NEAR Protocolが新高値から押し戻される──上昇トレンドのブリッジはまだ健在か?
$NEAR
NEAR(NEAR/USDT パーペチュアル)は、新しいローカル高値を付けた後、冷静さを取り戻しつつあります。1Hチャートでは、価格は2.616で始まり、2.639まで急騰したのち、2.526の安値まで売られ、その後2.552付近に落ち着き、足は-2.45%となっています。9月上旬の安値からの強い数日間の上昇の後で、これはトレンド転換というよりは、まだ維持されている上昇トレンドの中で起きる通常の押し戻しに見えます。ただし、現在のサポートの棚で次の数本のローソク足が、本当のところを教えてくれるでしょう。
構造を読む
このチャート全体でのより大きな動きは、きれいな衝動的な上昇(インパルス)です。価格は1.882付近の安値更新(Lower Low: LL)で底を打ち、安値切り下げの高値圏(Lower High: LH)へ戻り、その後もう一度下げてから、より高値の連続(Higher Highs: HH)へと決定的に上抜けました。最初は2.30台中盤から2.40台(チャート上の「Retracement Area」ボックス)でレジスタンスをテストし、そこでいったん保ち合ったのち、最新のHHである2.639へ勢いよく到達しています。
NEAR(NEAR/USDT パーペチュアル)は、新しいローカル高値を付けた後、冷静さを取り戻しつつあります。1Hチャートでは、価格は2.616で始まり、2.639まで急騰したのち、2.526の安値まで売られ、その後2.552付近に落ち着き、足は-2.45%となっています。9月上旬の安値からの強い数日間の上昇の後で、これはトレンド転換というよりは、まだ維持されている上昇トレンドの中で起きる通常の押し戻しに見えます。ただし、現在のサポートの棚で次の数本のローソク足が、本当のところを教えてくれるでしょう。
構造を読む
このチャート全体でのより大きな動きは、きれいな衝動的な上昇(インパルス)です。価格は1.882付近の安値更新(Lower Low: LL)で底を打ち、安値切り下げの高値圏(Lower High: LH)へ戻り、その後もう一度下げてから、より高値の連続(Higher Highs: HH)へと決定的に上抜けました。最初は2.30台中盤から2.40台(チャート上の「Retracement Area」ボックス)でレジスタンスをテストし、そこでいったん保ち合ったのち、最新のHHである2.639へ勢いよく到達しています。
74
·
--
記事
シアコインが構造をブレイク:SC/USDTは次の高値更新に向けて仕込み中か?$SC
シアコイン(SC/USDT)は、急激な日中の値動きの後、再びトレーダーの注目を集めるに至りました。1時間足チャートでは、価格は+10.21%上昇し、始値0.000871から高値0.000993まで上げた後、執筆時点では0.000961付近で落ち着きを見せています。1週間の大半を狭いレンジで横ばい推移していたコインにとって、このような拡大(エクスパンション)タイプのローソク足は、「トップ・ゲイナー(上昇銘柄)」のスクリーナーで目に付く動きです。そして、その背後にある市場構造は、これが単発の一発屋(1本のろうそく足だけの出来事)で終わらない可能性を示唆しています。
シアコインが構造をブレイク:SC/USDTは次の高値更新に向けて仕込み中か?
$SC
シアコイン(SC/USDT)は、急激な日中の値動きの後、再びトレーダーの注目を集めるに至りました。1時間足チャートでは、価格は+10.21%上昇し、始値0.000871から高値0.000993まで上げた後、執筆時点では0.000961付近で落ち着きを見せています。1週間の大半を狭いレンジで横ばい推移していたコインにとって、このような拡大(エクスパンション)タイプのローソク足は、「トップ・ゲイナー(上昇銘柄)」のスクリーナーで目に付く動きです。そして、その背後にある市場構造は、これが単発の一発屋(1本のろうそく足だけの出来事)で終わらない可能性を示唆しています。
シアコイン(SC/USDT)は、急激な日中の値動きの後、再びトレーダーの注目を集めるに至りました。1時間足チャートでは、価格は+10.21%上昇し、始値0.000871から高値0.000993まで上げた後、執筆時点では0.000961付近で落ち着きを見せています。1週間の大半を狭いレンジで横ばい推移していたコインにとって、このような拡大(エクスパンション)タイプのローソク足は、「トップ・ゲイナー(上昇銘柄)」のスクリーナーで目に付く動きです。そして、その背後にある市場構造は、これが単発の一発屋(1本のろうそく足だけの出来事)で終わらない可能性を示唆しています。
63
·
--
📊 $BANK USDT — テクニカル分析セットアップ
BANKは約$0.0353付近で取引されており、直近のボラティリティの後、サポート上で推移しています。$0.0340のエリアが重要なサポートで、$0.0360〜$0.0370が最初のレジスタンスゾーンです。$0.036を上抜けて反発(リテイク)できれば、$0.040に向けて余地が開けます。
🟢 ロング・エントリー: $0.03530
🛑 SL: $0.03380
🎯 TP1: $0.03700
🎯 TP2: $0.04000
🎯 TP3: $0.04500
⚡ エントリーは現在実行可能です。
⚠️ 金融アドバイスではありません。リスク管理を慎重に行ってください
@Binance_Square_Official #AEROSurges17%In24Hours #IranSaysItCapturedUSUnmannedSubmarine #SaudiHaltsSouthernEnergySitesAfterAttacks #Binance #ChartSniper
{future}(BANKUSDT)
📊 $BANK USDT — テクニカル分析セットアップ
BANKは約$0.0353付近で取引されており、直近のボラティリティの後、サポート上で推移しています。$0.0340のエリアが重要なサポートで、$0.0360〜$0.0370が最初のレジスタンスゾーンです。$0.036を上抜けて反発(リテイク)できれば、$0.040に向けて余地が開けます。
🟢 ロング・エントリー: $0.03530
🛑 SL: $0.03380
🎯 TP1: $0.03700
🎯 TP2: $0.04000
🎯 TP3: $0.04500
⚡ エントリーは現在実行可能です。
⚠️ 金融アドバイスではありません。リスク管理を慎重に行ってください
@Binance Square Official #AEROSurges17%In24Hours #IranSaysItCapturedUSUnmannedSubmarine #SaudiHaltsSouthernEnergySitesAfterAttacks #Binance #ChartSniper
BANKは約$0.0353付近で取引されており、直近のボラティリティの後、サポート上で推移しています。$0.0340のエリアが重要なサポートで、$0.0360〜$0.0370が最初のレジスタンスゾーンです。$0.036を上抜けて反発(リテイク)できれば、$0.040に向けて余地が開けます。
🟢 ロング・エントリー: $0.03530
🛑 SL: $0.03380
🎯 TP1: $0.03700
🎯 TP2: $0.04000
🎯 TP3: $0.04500
⚡ エントリーは現在実行可能です。
⚠️ 金融アドバイスではありません。リスク管理を慎重に行ってください
@Binance Square Official #AEROSurges17%In24Hours #IranSaysItCapturedUSUnmannedSubmarine #SaudiHaltsSouthernEnergySitesAfterAttacks #Binance #ChartSniper
303
·
--
📈 PI USDT — ロング・セットアップ
PIは$0.09635付近で取引されており、控えめな強気モメンタムを示しています。価格は$0.096のサポート領域付近で推移しており、$0.100を上抜けできれば継続のセットアップが強まる可能性があります。
🟢 ロング・エントリー: $0.09635
🛑 SL: $0.09200
🎯 TP1: $0.10000
🎯 TP2: $0.10500
🎯 TP3: $0.11200
⚡ エントリー: 現在の市場価格
⚠️ 金融助言ではありません。リスク管理を慎重に行ってください。
@Binance_Square_Official #IranSaysItCapturedUSUnmannedSubmarine #AEROSurges17%In24Hours #SaudiHaltsSouthernEnergySitesAfterAttacks #Binance #ChartSniper
📈 PI USDT — ロング・セットアップ
PIは$0.09635付近で取引されており、控えめな強気モメンタムを示しています。価格は$0.096のサポート領域付近で推移しており、$0.100を上抜けできれば継続のセットアップが強まる可能性があります。
🟢 ロング・エントリー: $0.09635
🛑 SL: $0.09200
🎯 TP1: $0.10000
🎯 TP2: $0.10500
🎯 TP3: $0.11200
⚡ エントリー: 現在の市場価格
⚠️ 金融助言ではありません。リスク管理を慎重に行ってください。
@Binance Square Official #IranSaysItCapturedUSUnmannedSubmarine #AEROSurges17%In24Hours #SaudiHaltsSouthernEnergySitesAfterAttacks #Binance #ChartSniper
PIは$0.09635付近で取引されており、控えめな強気モメンタムを示しています。価格は$0.096のサポート領域付近で推移しており、$0.100を上抜けできれば継続のセットアップが強まる可能性があります。
🟢 ロング・エントリー: $0.09635
🛑 SL: $0.09200
🎯 TP1: $0.10000
🎯 TP2: $0.10500
🎯 TP3: $0.11200
⚡ エントリー: 現在の市場価格
⚠️ 金融助言ではありません。リスク管理を慎重に行ってください。
@Binance Square Official #IranSaysItCapturedUSUnmannedSubmarine #AEROSurges17%In24Hours #SaudiHaltsSouthernEnergySitesAfterAttacks #Binance #ChartSniper
50
·
--
📈 $XRP USDT — ロング・セットアップ
XRPは約$1.42で、RSIは57付近、ほとんどの移動平均が買いシグナルを示しています。価格は$1.40のあたりを上回って推移しており、強気の継続セットアップを裏付けています。
🟢 ロング・エントリー: $1.42
🛑 SL: $1.38
🎯 TP1: $1.47
🎯 TP2: $1.55
🎯 TP3: $1.68
⚡ エントリーは現在の市場価格で実行可能です。
⚠️ 金融助言ではありません。リスクを慎重に管理してください。
@Binance_Square_Official #AEROSurges17%In24Hours #IranSaysItCapturedUSUnmannedSubmarine #SaudiHaltsSouthernEnergySitesAfterAttacks #Binance #ChartSniper
{future}(XRPUSDT)
📈 $XRP USDT — ロング・セットアップ
XRPは約$1.42で、RSIは57付近、ほとんどの移動平均が買いシグナルを示しています。価格は$1.40のあたりを上回って推移しており、強気の継続セットアップを裏付けています。
🟢 ロング・エントリー: $1.42
🛑 SL: $1.38
🎯 TP1: $1.47
🎯 TP2: $1.55
🎯 TP3: $1.68
⚡ エントリーは現在の市場価格で実行可能です。
⚠️ 金融助言ではありません。リスクを慎重に管理してください。
@Binance Square Official #AEROSurges17%In24Hours #IranSaysItCapturedUSUnmannedSubmarine #SaudiHaltsSouthernEnergySitesAfterAttacks #Binance #ChartSniper
XRPは約$1.42で、RSIは57付近、ほとんどの移動平均が買いシグナルを示しています。価格は$1.40のあたりを上回って推移しており、強気の継続セットアップを裏付けています。
🟢 ロング・エントリー: $1.42
🛑 SL: $1.38
🎯 TP1: $1.47
🎯 TP2: $1.55
🎯 TP3: $1.68
⚡ エントリーは現在の市場価格で実行可能です。
⚠️ 金融助言ではありません。リスクを慎重に管理してください。
@Binance Square Official #AEROSurges17%In24Hours #IranSaysItCapturedUSUnmannedSubmarine #SaudiHaltsSouthernEnergySitesAfterAttacks #Binance #ChartSniper
79
·
--
🔥 $DOT USDT — 最高にホットなコイン
DOTは強い勢いを見せており、$1.08近辺で推移し、今日は10%以上上昇しています。価格は$1.10〜$1.12のレジスタンス帯に向けて押し上げられており、$1.00を上回って維持できている限り短期の構造は強気を保ちます。
🟢 エントリー(買い): $1.08
🛑 SL: $1.00
🎯 TP1: $1.15
🎯 TP2: $1.22
🎯 TP3: $1.30
⚡ シグナル: 強いモメンタム
⚠️ 金融助言ではありません。リスク管理を慎重に行ってください。
@Binance_Square_Official #USIranTradeTankerStrikesEscalate #CanadaToImpose15%To50%TariffsOnUSGoods #ZcashRises45%WeeklyToHighestSince2016 #Binance #ChartSniper
{future}(DOTUSDT)
🔥 $DOT USDT — 最高にホットなコイン
DOTは強い勢いを見せており、$1.08近辺で推移し、今日は10%以上上昇しています。価格は$1.10〜$1.12のレジスタンス帯に向けて押し上げられており、$1.00を上回って維持できている限り短期の構造は強気を保ちます。
🟢 エントリー(買い): $1.08
🛑 SL: $1.00
🎯 TP1: $1.15
🎯 TP2: $1.22
🎯 TP3: $1.30
⚡ シグナル: 強いモメンタム
⚠️ 金融助言ではありません。リスク管理を慎重に行ってください。
@Binance Square Official #USIranTradeTankerStrikesEscalate #CanadaToImpose15%To50%TariffsOnUSGoods #ZcashRises45%WeeklyToHighestSince2016 #Binance #ChartSniper
DOTは強い勢いを見せており、$1.08近辺で推移し、今日は10%以上上昇しています。価格は$1.10〜$1.12のレジスタンス帯に向けて押し上げられており、$1.00を上回って維持できている限り短期の構造は強気を保ちます。
🟢 エントリー(買い): $1.08
🛑 SL: $1.00
🎯 TP1: $1.15
🎯 TP2: $1.22
🎯 TP3: $1.30
⚡ シグナル: 強いモメンタム
⚠️ 金融助言ではありません。リスク管理を慎重に行ってください。
@Binance Square Official #USIranTradeTankerStrikesEscalate #CanadaToImpose15%To50%TariffsOnUSGoods #ZcashRises45%WeeklyToHighestSince2016 #Binance #ChartSniper
129
ログインして、さらにコンテンツを読む
厳選トピックで世界の暗号資産トレーダーの仲間入り
⚡️ 暗号資産に関する最新かつ有益な情報が見つかります。
💬 世界最大の暗号資産取引所から信頼されています。
👍 認証を受けたクリエイターから、有益なインサイトを得られます。
メール / 電話番号
トレンドトピック
1
#AmazonGetsWarrantsToBuyGeneracStock
閲覧回数 1
12人が討論中
2
#DotPlotSignalsOneMoreHikeIn2026
閲覧回数 14,587
348人が討論中
3
#RobinhoodToSupportCircleArcNetwork
閲覧回数 2,183
103人が討論中
4
#FedHikes25BpsUSStocksClose
閲覧回数 20,842
312人が討論中
5
#AaveToLaunchRWAMarketOnAvalanche
閲覧回数 5,448
136人が討論中
6
#CryptoVCFundingRebounds$5.6BInQ2
閲覧回数 6,958
36人が討論中
7
#RevolutHackersDemand$3MInMonero
閲覧回数 393
9人が討論中
8
#ZcashRises6%
閲覧回数 120,038
1,023人が討論中
9
#XRPSinks10%
閲覧回数 72,467
684人が討論中
10
#BitcoinETFsShed$450M
閲覧回数 11,242
116人が討論中