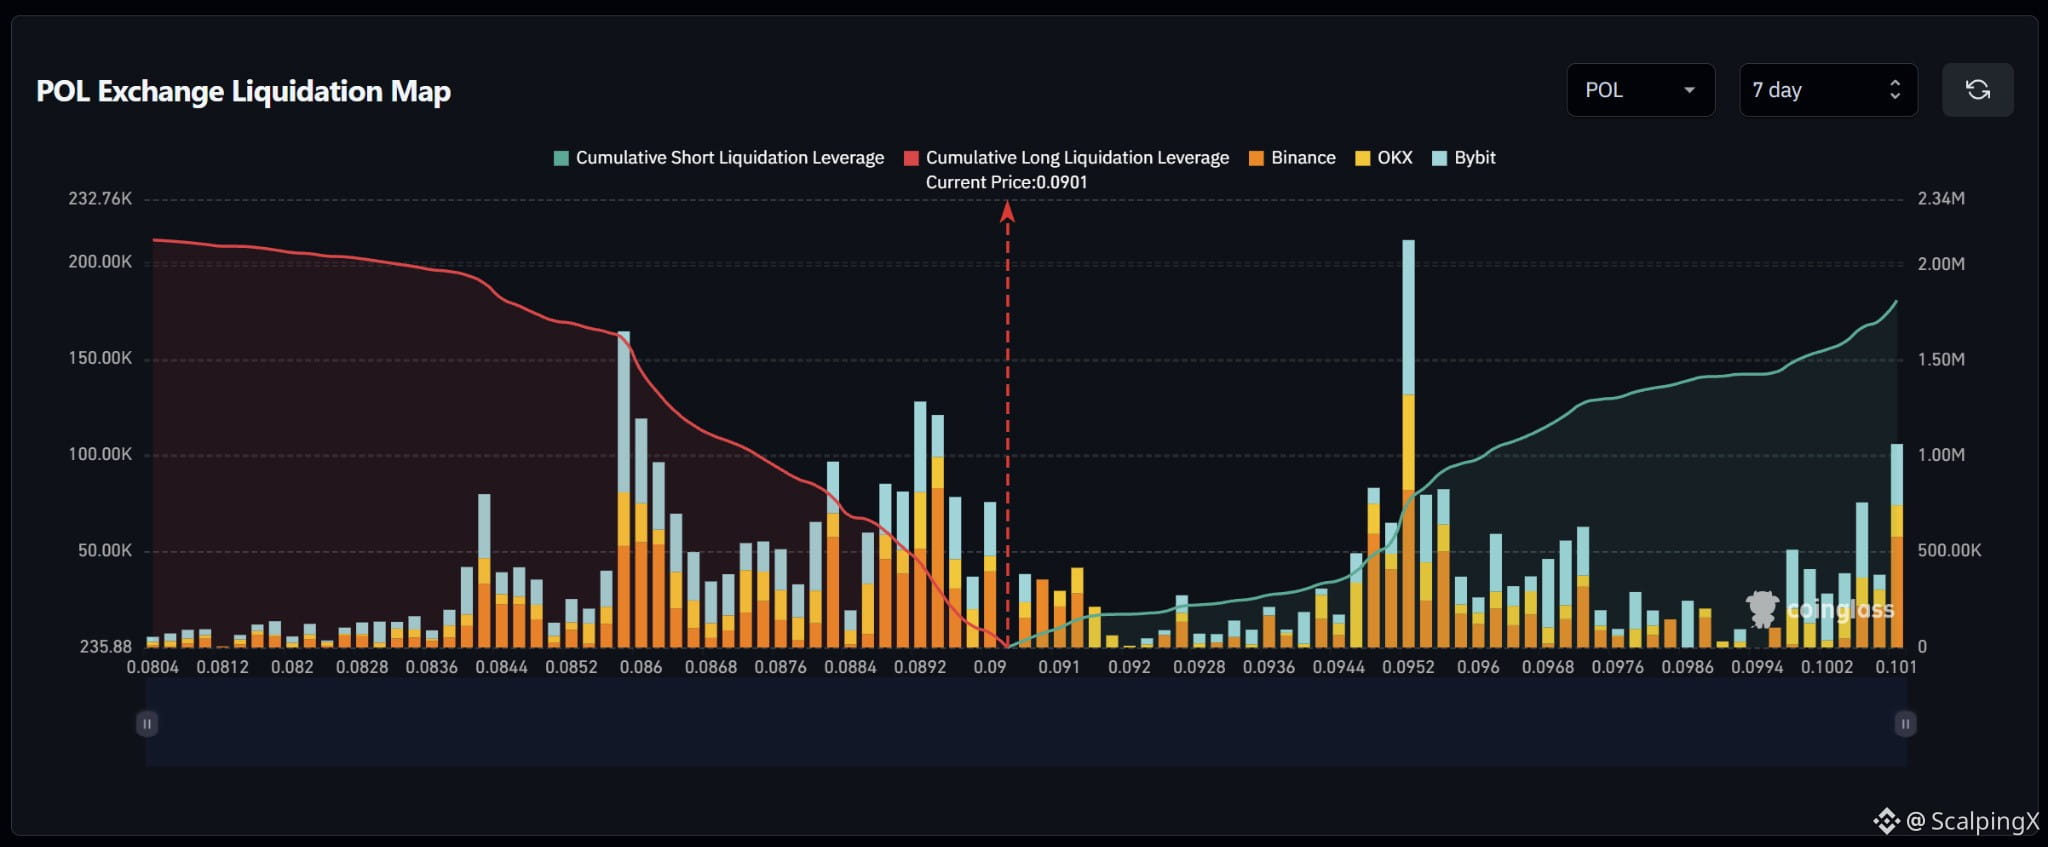
$POL – Liquidation Map (7 days) – Index ~0.0901
🧭 The preferred scenario is a nearby long-liquidation sweep at 0.0889–0.0900. Estimated cumulative exposure is fairly balanced, but nearby long bars are denser, while the largest short cluster sits further away at 0.0945–0.0956.
🔻 Losing 0.0900 without reclaiming it shifts attention to 0.0889–0.0895. Two large bars near 0.0892–0.0894 stand out; consecutive long liquidations could amplify volatility.
🎯 Holding below 0.0889 after the sweep brings 0.0880–0.0884, then 0.0858–0.0865, into focus. Conversely, a sweep below 0.0900 followed by a quick reclaim of 0.0901 would weaken the downside scenario.
⚖️ Clearing the short cluster at 0.0904–0.0914 and holding above 0.0914 shifts attention to 0.0945–0.0956. The 0.0918–0.0940 range is sparse; the bar near 0.0952 is the map’s largest, at roughly $210,000. Holding above 0.0956 would bring 0.0960–0.0972 into view.
#LiquidationMap
🧭 The preferred scenario is a nearby long-liquidation sweep at 0.0889–0.0900. Estimated cumulative exposure is fairly balanced, but nearby long bars are denser, while the largest short cluster sits further away at 0.0945–0.0956.
🔻 Losing 0.0900 without reclaiming it shifts attention to 0.0889–0.0895. Two large bars near 0.0892–0.0894 stand out; consecutive long liquidations could amplify volatility.
🎯 Holding below 0.0889 after the sweep brings 0.0880–0.0884, then 0.0858–0.0865, into focus. Conversely, a sweep below 0.0900 followed by a quick reclaim of 0.0901 would weaken the downside scenario.
⚖️ Clearing the short cluster at 0.0904–0.0914 and holding above 0.0914 shifts attention to 0.0945–0.0956. The 0.0918–0.0940 range is sparse; the bar near 0.0952 is the map’s largest, at roughly $210,000. Holding above 0.0956 would bring 0.0960–0.0972 into view.
#LiquidationMap