
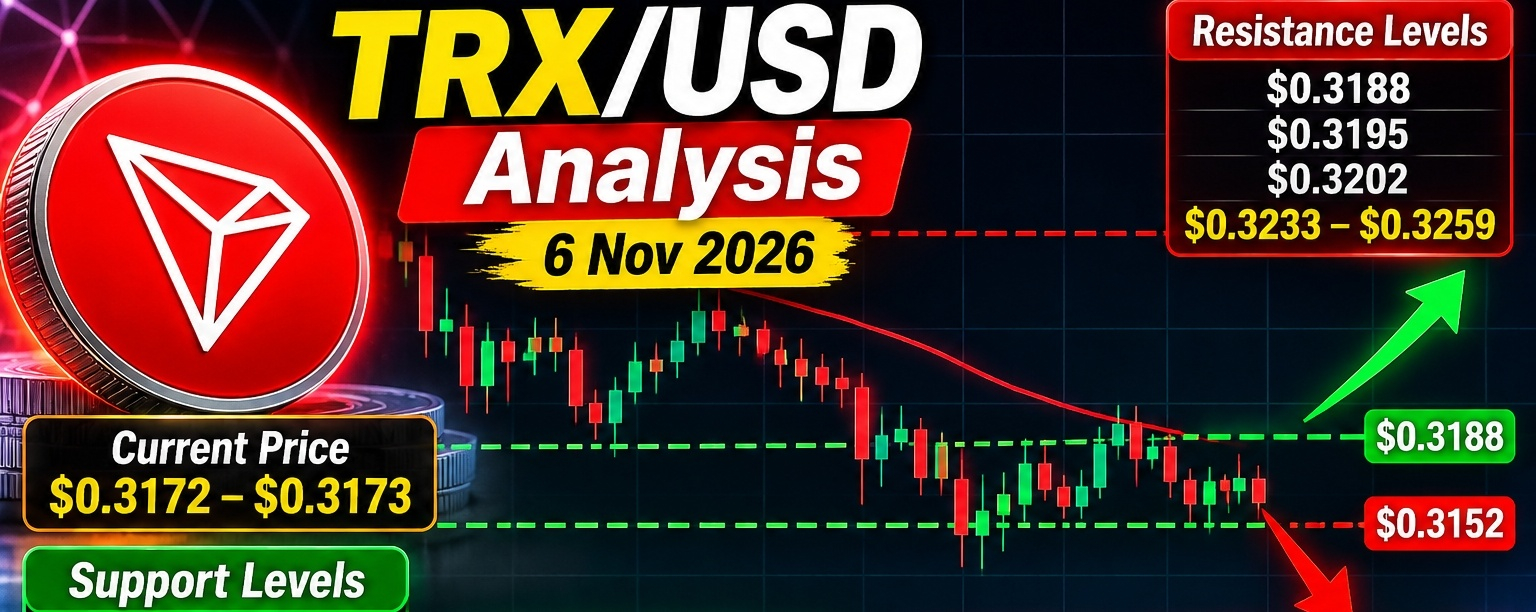

$TRX /USD Analysis — 6 Nov 2026
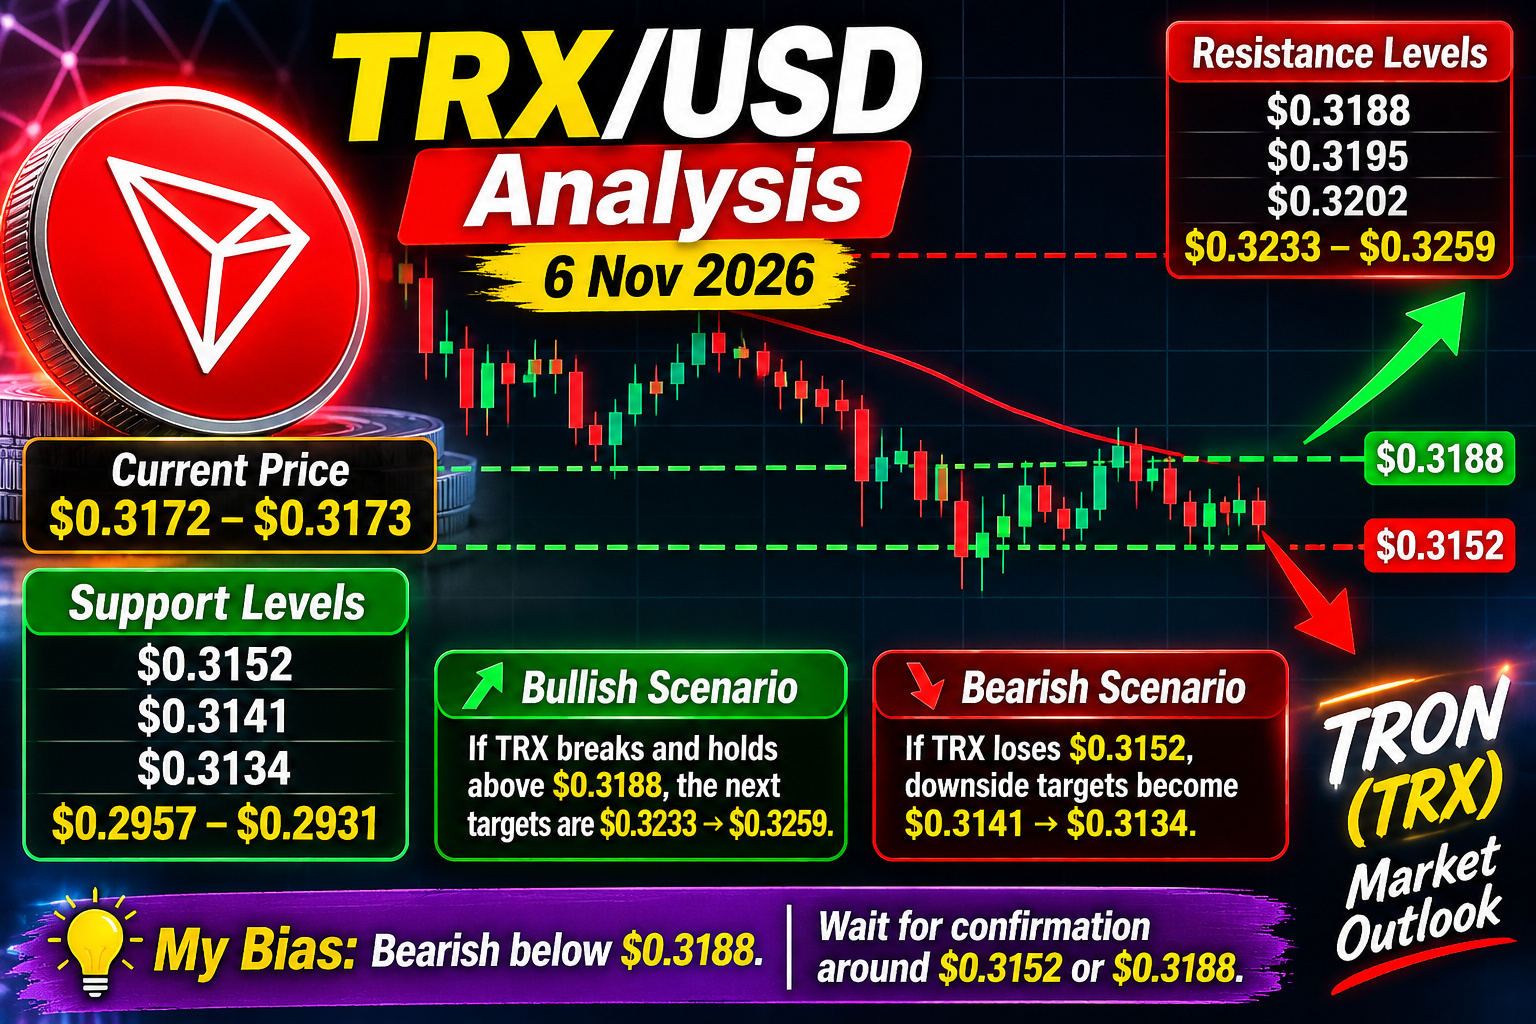
Current price: around $0.3172–$0.3173. The daily structure remains bearish, although the intraday chart is showing a possible relief bounce.
📉 Technical outlook $TRX

- Short-term: 🔴 Bearish
- Intraday: 🟢 Mildly bullish above $0.3152
- Daily RSI: ~43–45, showing weak momentum.
- Daily MACD: Bearish, with price below the 20-day and 50-day averages.
Key levels
Resistance:
- $0.3188
- $0.3195
- $0.3202
- Major: $0.3233–$0.3259
Support:
- $0.3152
- $0.3141
- $0.3134
- Major downside: $0.2957–$0.2931
📊 Scenarios
🟢 Bullish: If $TRX breaks and holds above $0.3188, the next targets are $0.3233 → $0.3259.
🔴 Bearish: If TRX loses $0.3152, downside targets become $0.3141 → $0.3134. A larger breakdown could eventually test $0.2957.
🎯 My bias
Bearish below $0.3188. A sustained break above $0.3233 would improve the structure and provide stronger bullish confirmation.
Potential setup: Wait for confirmation around $0.3152 or $0.3188 rather than entering in the middle of the range.
⚠️ Crypto is highly volatile; these levels are technical reference points, not financial advice.
#TrendingTopic #TradingCommunity #viralpost #TronNetwork #TRXUSDT #CryptoSignals #LongTrade #FuturesTrading #BinanceFeed #ScalpSetup #MomentumTrade #Leverage15x #CryptoTamil #BreakoutSetup