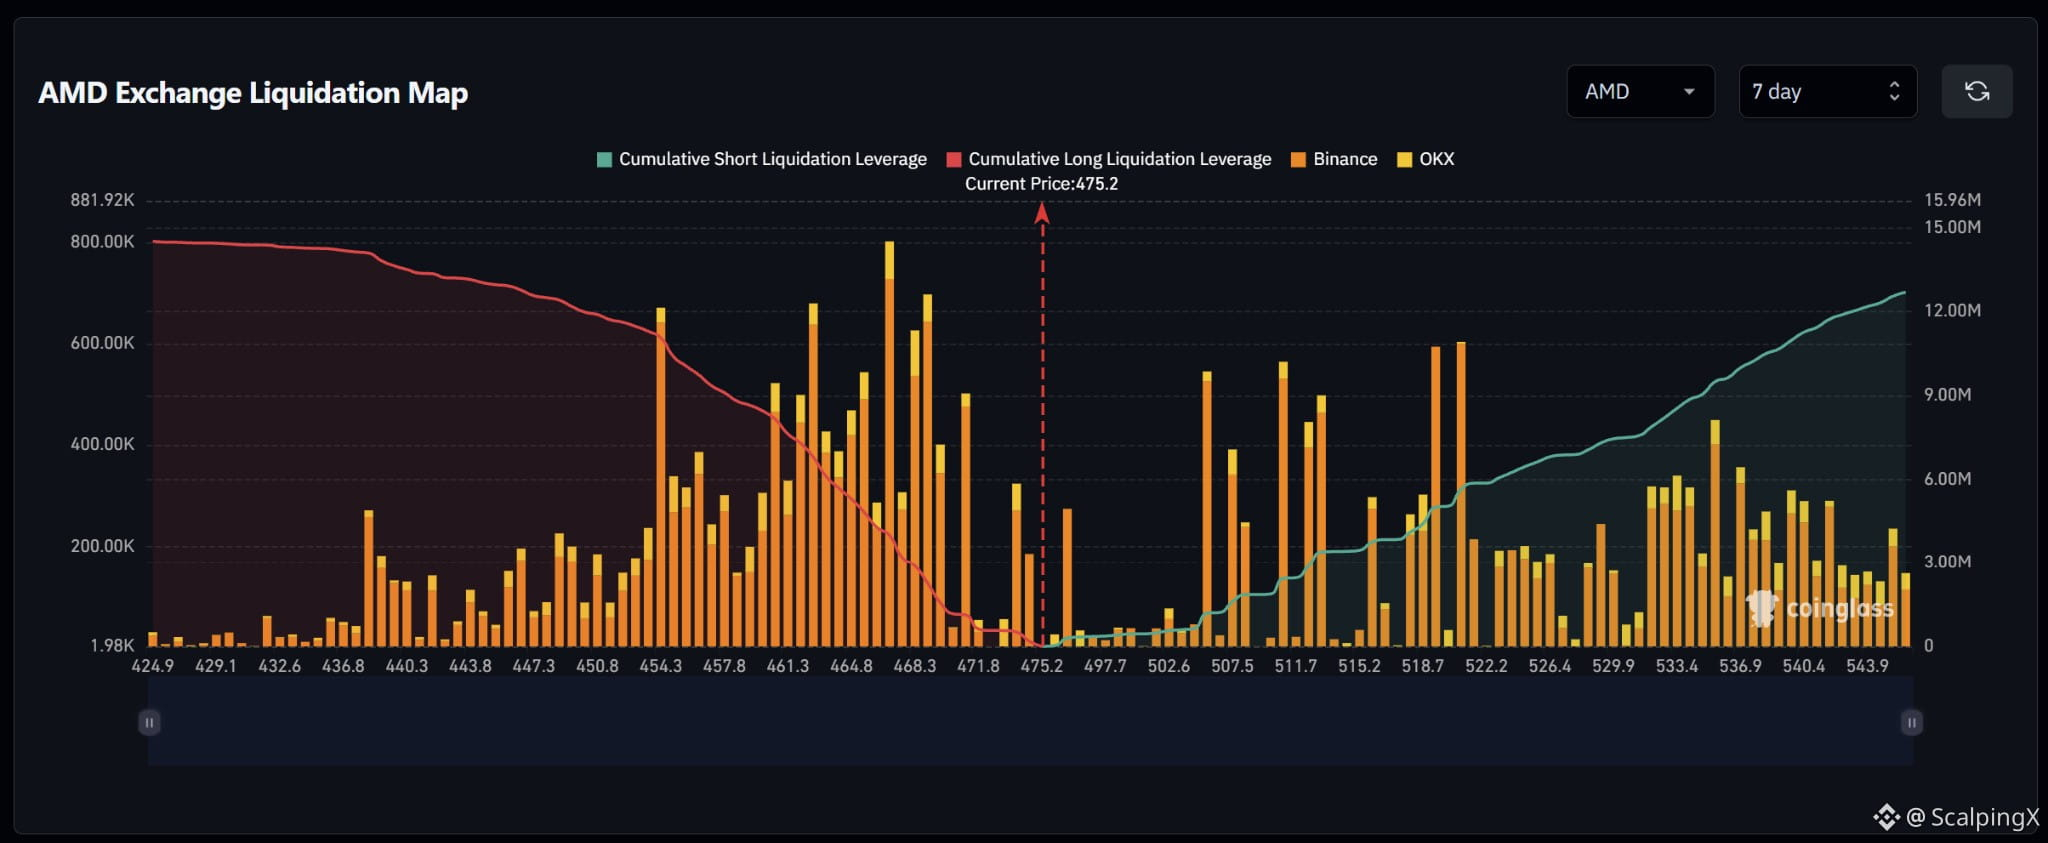
$AMD – Liquidation Map (7 days) – Index ~475.2
🧭 The preferred scenario is a downside long-liquidation sweep at 473–474, followed by 468–471. Dense long clusters sit closer to price than the larger short clusters above; estimated cumulative exposure is relatively balanced within the displayed range.
🔻 Losing 473 without reclaiming it shifts attention to 468–471. Holding below 468 after the sweep brings 466–467 into focus, where the map’s largest bar reaches roughly $800,000.
🎯 A further break below 466 brings 461–465, then 454–458, into view. Consecutive long liquidations across this range could amplify volatility. A sweep of 473–474 followed by a quick reclaim of 475.2 would weaken the downside scenario.
⚖️ If price advances and holds above 503, attention shifts to short clusters at 505–508, 511–513 and 518–521. Bars around 498–503 are small, while larger upside spikes are more scattered; sustained momentum would help distinguish continuation from an isolated sweep.
#LiquidationMap
🧭 The preferred scenario is a downside long-liquidation sweep at 473–474, followed by 468–471. Dense long clusters sit closer to price than the larger short clusters above; estimated cumulative exposure is relatively balanced within the displayed range.
🔻 Losing 473 without reclaiming it shifts attention to 468–471. Holding below 468 after the sweep brings 466–467 into focus, where the map’s largest bar reaches roughly $800,000.
🎯 A further break below 466 brings 461–465, then 454–458, into view. Consecutive long liquidations across this range could amplify volatility. A sweep of 473–474 followed by a quick reclaim of 475.2 would weaken the downside scenario.
⚖️ If price advances and holds above 503, attention shifts to short clusters at 505–508, 511–513 and 518–521. Bars around 498–503 are small, while larger upside spikes are more scattered; sustained momentum would help distinguish continuation from an isolated sweep.
#LiquidationMap