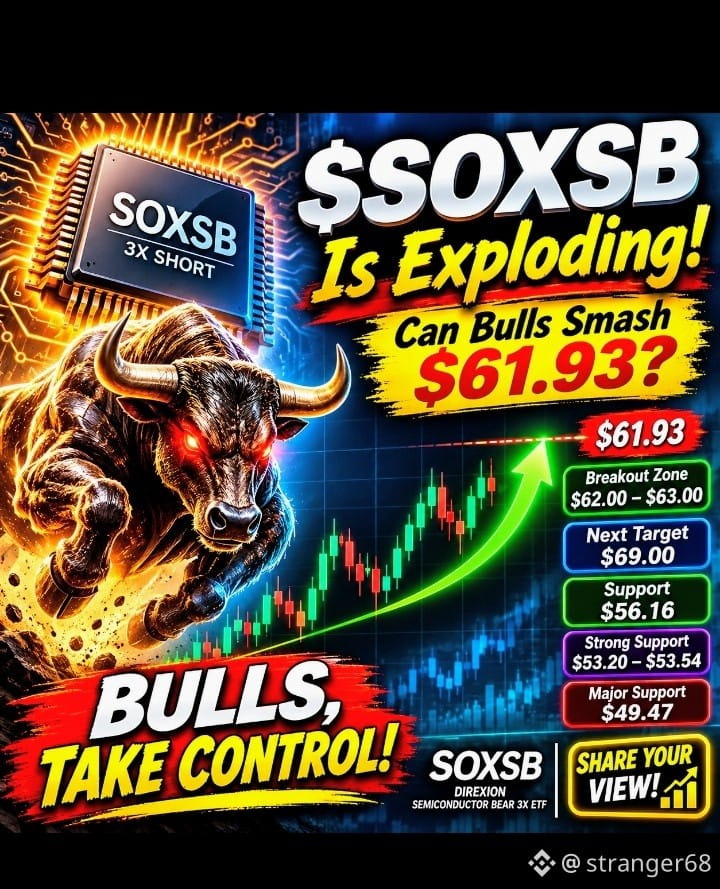
🚨 $SOXSB Is Exploding +13%! Can Bulls Smash Through $61.93? 🔥
⚡ $SOXSB /USDT is trading around $58.20, up 13.32% in 24H, after a powerful rally from $49.47. Momentum is strong, but bulls are approaching a major resistance zone. 📈
⏱️ 1H Chart: Price is slightly below MA(7) $58.51 but holding above MA(25) $55.53 and MA(99) $53.20. Reclaiming $58.50 could strengthen the recovery. 🎯
📊 4H Chart: Bullish structure remains strong! Price is above MA(7) $56.16, MA(25) $53.54 and MA(99) $49.55. Buyers currently have the advantage. 🚀
🌍 1D Chart: Strong recovery continues, with price comfortably above MA(7) $52.57, MA(25) $47.79 and MA(99) $43.99. The broader momentum is improving. 💪
🎯 THE BIG PRICE BATTLE:
- Immediate resistance: $61.93
- Breakout zone: $62.00–$63.00
- Next upside area: $69.00
- Support: $56.16
- Stronger support: $53.20–$53.54
- Major support: $49.47
⚠️ RISK CHECK: A rejection near $61.93 could trigger a pullback. Remember, SOXSB represents leveraged inverse semiconductor exposure, so its daily movements and risks can be substantial.
🔥 THE $61.93 LEVEL IS THE KEY! Can bulls push through resistance, or will sellers step in? What's your market outlook? Share your analysis below! 🚀
#SOXSB #Semiconductor #CryptoMarket
#BinanceIncidentReport #USOctoberNFP-AreRateCutsStillPossible #USMidterms-WhatAreMarketsExpecting? #AMDBeatsExpectations-AINarrativeContinues
⚡ $SOXSB /USDT is trading around $58.20, up 13.32% in 24H, after a powerful rally from $49.47. Momentum is strong, but bulls are approaching a major resistance zone. 📈
⏱️ 1H Chart: Price is slightly below MA(7) $58.51 but holding above MA(25) $55.53 and MA(99) $53.20. Reclaiming $58.50 could strengthen the recovery. 🎯
📊 4H Chart: Bullish structure remains strong! Price is above MA(7) $56.16, MA(25) $53.54 and MA(99) $49.55. Buyers currently have the advantage. 🚀
🌍 1D Chart: Strong recovery continues, with price comfortably above MA(7) $52.57, MA(25) $47.79 and MA(99) $43.99. The broader momentum is improving. 💪
🎯 THE BIG PRICE BATTLE:
- Immediate resistance: $61.93
- Breakout zone: $62.00–$63.00
- Next upside area: $69.00
- Support: $56.16
- Stronger support: $53.20–$53.54
- Major support: $49.47
⚠️ RISK CHECK: A rejection near $61.93 could trigger a pullback. Remember, SOXSB represents leveraged inverse semiconductor exposure, so its daily movements and risks can be substantial.
🔥 THE $61.93 LEVEL IS THE KEY! Can bulls push through resistance, or will sellers step in? What's your market outlook? Share your analysis below! 🚀
#SOXSB #Semiconductor #CryptoMarket
#BinanceIncidentReport #USOctoberNFP-AreRateCutsStillPossible #USMidterms-WhatAreMarketsExpecting? #AMDBeatsExpectations-AINarrativeContinues