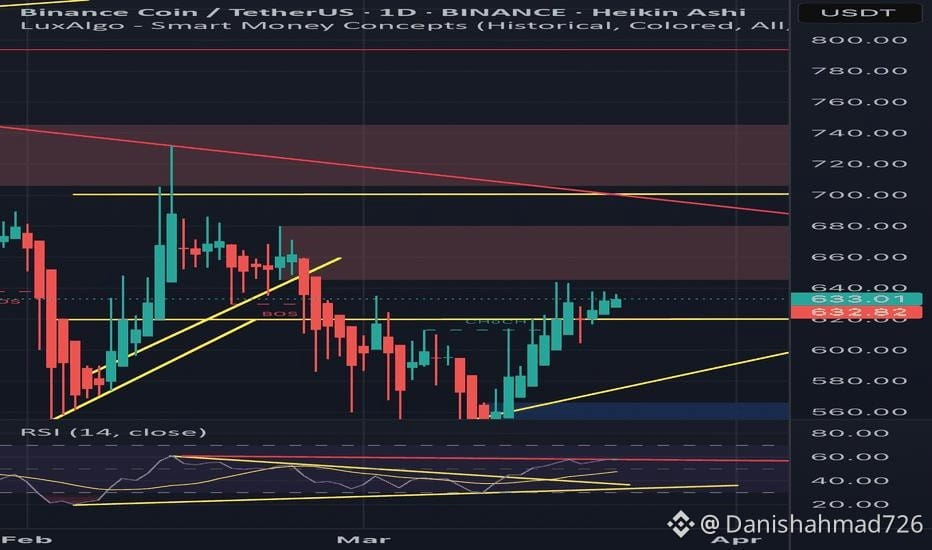
$BNB
Today's BNB analysis should focus on three things: price trend, support and resistance, and trading volume. The key is to confirm whether buyers or sellers are controlling the market before entering a trade.
Technical analysis
The latest available technical readings show:
RSI (14): 47.46 – neutral to weak.
MACD: bearish signal.
Moving averages: strong sell, with 11 sell signals.
4-hour trend: downward.
Daily trend: sideways/downward.
Possible price scenarios
Bullish scenario
Break and hold above $706 could open a move toward $709–$710.
Bearish scenario
A breakdown below $694 could expose the next support near $680.
Sideways scenario
BNB may consolidate between $694 and $706.
Trading outlook
Short-term: Bearish until resistance is reclaimed.
Buy entry: Wait for confirmation above $706.
Sell/short watch: Rejection around $705–$706.
Risk management: Place a stop-loss based on your entry and timeframe.
#BinanceReopensWithdrawalsForMoreAssets #bnb #BNB_Market_Update #BNB走势 #BNBToken
Today's BNB analysis should focus on three things: price trend, support and resistance, and trading volume. The key is to confirm whether buyers or sellers are controlling the market before entering a trade.
Technical analysis
The latest available technical readings show:
RSI (14): 47.46 – neutral to weak.
MACD: bearish signal.
Moving averages: strong sell, with 11 sell signals.
4-hour trend: downward.
Daily trend: sideways/downward.
Possible price scenarios
Bullish scenario
Break and hold above $706 could open a move toward $709–$710.
Bearish scenario
A breakdown below $694 could expose the next support near $680.
Sideways scenario
BNB may consolidate between $694 and $706.
Trading outlook
Short-term: Bearish until resistance is reclaimed.
Buy entry: Wait for confirmation above $706.
Sell/short watch: Rejection around $705–$706.
Risk management: Place a stop-loss based on your entry and timeframe.
#BinanceReopensWithdrawalsForMoreAssets #bnb #BNB_Market_Update #BNB走势 #BNBToken