EVAA Pulls Back to the MA(7) After a Strong Run: Healthy Dip or Trend Change?
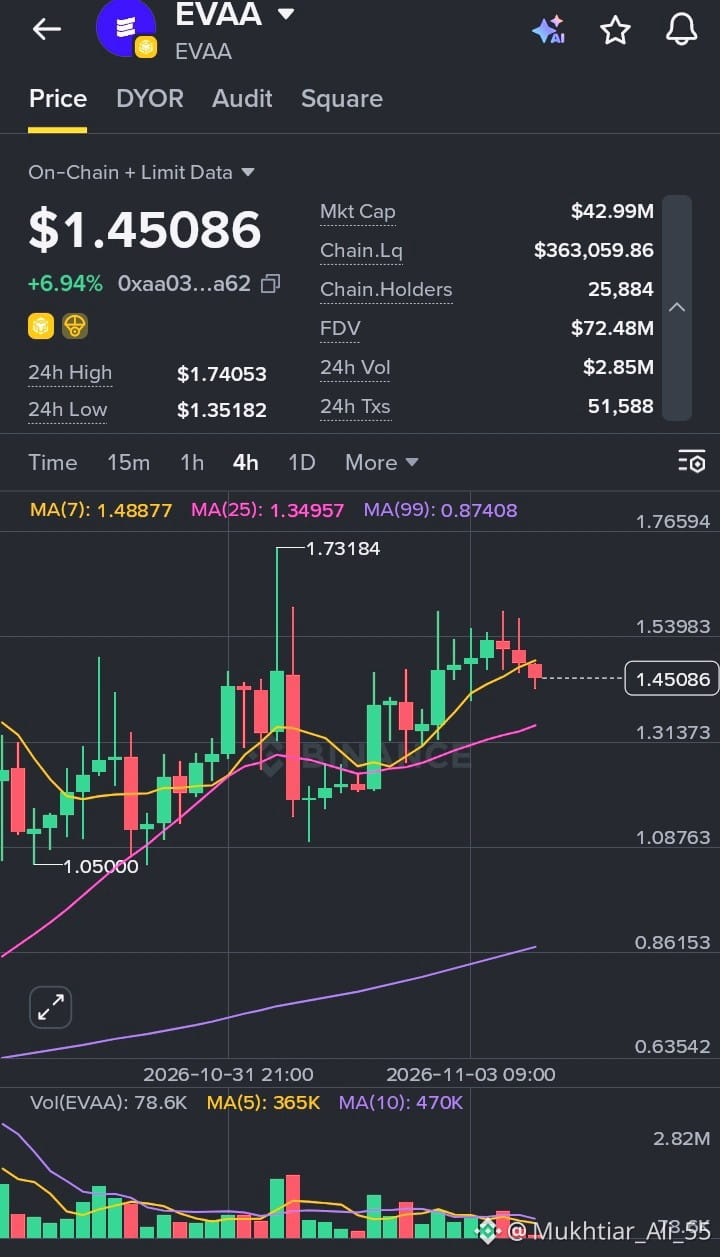
EVAA is trading around $1.45086, up 6.94% on the day, and the 4H chart shows a well-established uptrend taking a breather.
After building a base near $1.05, price climbed steadily with higher highs and higher lows, spiking to $1.73184 before pulling back. A second push in recent sessions topped out near $1.55, and the last few red candles have brought price down to the MA(7), which is the first real test of this short-term pullback.
What the chart is showing:
24h range: $1.35182 to $1.74053
24h volume: about $2.85M, with 51.6K transactions
Market cap: $42.99M, FDV: $72.48M
On-chain liquidity: about $363K, with roughly 25.9K holders
MA(7): 1.48877, now sitting just above price after the recent dip
MA(25): 1.34957, rising steadily and acting as the next support below
MA(99): 0.87408, sloping up and far beneath price, confirming the bigger trend is bullish
Volume: fading, with the MA(5) below the MA(10), which suggests the pullback is happening on light selling
My take: The broader structure is still bullish. The averages are stacked in the right order, and the pullback has been orderly with volume drying up rather than expanding on the red candles. That usually points to a pause rather than a reversal. The first level to watch is the MA(25) near $1.35, which lines up with the 24h low and would be a logical area for buyers to return. Reclaiming the MA(7) near $1.49 would be an early sign that the dip is over, and a break above $1.55 would open the way back toward the $1.73 high. If $1.35 fails, the recovery structure weakens and the $1.08 area comes into view.
Also worth noting, on-chain liquidity is thin compared to the daily volume, so price can move sharply in either direction. I’m waiting to see how it reacts at support rather than catching a falling candle.
#EVAA #CryptoAnalysis #TechnicalAnalysis #Altcoins #DeFi
$EVAA
EVAA is trading around $1.45086, up 6.94% on the day, and the 4H chart shows a well-established uptrend taking a breather.
After building a base near $1.05, price climbed steadily with higher highs and higher lows, spiking to $1.73184 before pulling back. A second push in recent sessions topped out near $1.55, and the last few red candles have brought price down to the MA(7), which is the first real test of this short-term pullback.
What the chart is showing:
24h range: $1.35182 to $1.74053
24h volume: about $2.85M, with 51.6K transactions
Market cap: $42.99M, FDV: $72.48M
On-chain liquidity: about $363K, with roughly 25.9K holders
MA(7): 1.48877, now sitting just above price after the recent dip
MA(25): 1.34957, rising steadily and acting as the next support below
MA(99): 0.87408, sloping up and far beneath price, confirming the bigger trend is bullish
Volume: fading, with the MA(5) below the MA(10), which suggests the pullback is happening on light selling
My take: The broader structure is still bullish. The averages are stacked in the right order, and the pullback has been orderly with volume drying up rather than expanding on the red candles. That usually points to a pause rather than a reversal. The first level to watch is the MA(25) near $1.35, which lines up with the 24h low and would be a logical area for buyers to return. Reclaiming the MA(7) near $1.49 would be an early sign that the dip is over, and a break above $1.55 would open the way back toward the $1.73 high. If $1.35 fails, the recovery structure weakens and the $1.08 area comes into view.
Also worth noting, on-chain liquidity is thin compared to the daily volume, so price can move sharply in either direction. I’m waiting to see how it reacts at support rather than catching a falling candle.
#EVAA #CryptoAnalysis #TechnicalAnalysis #Altcoins #DeFi
$EVAA