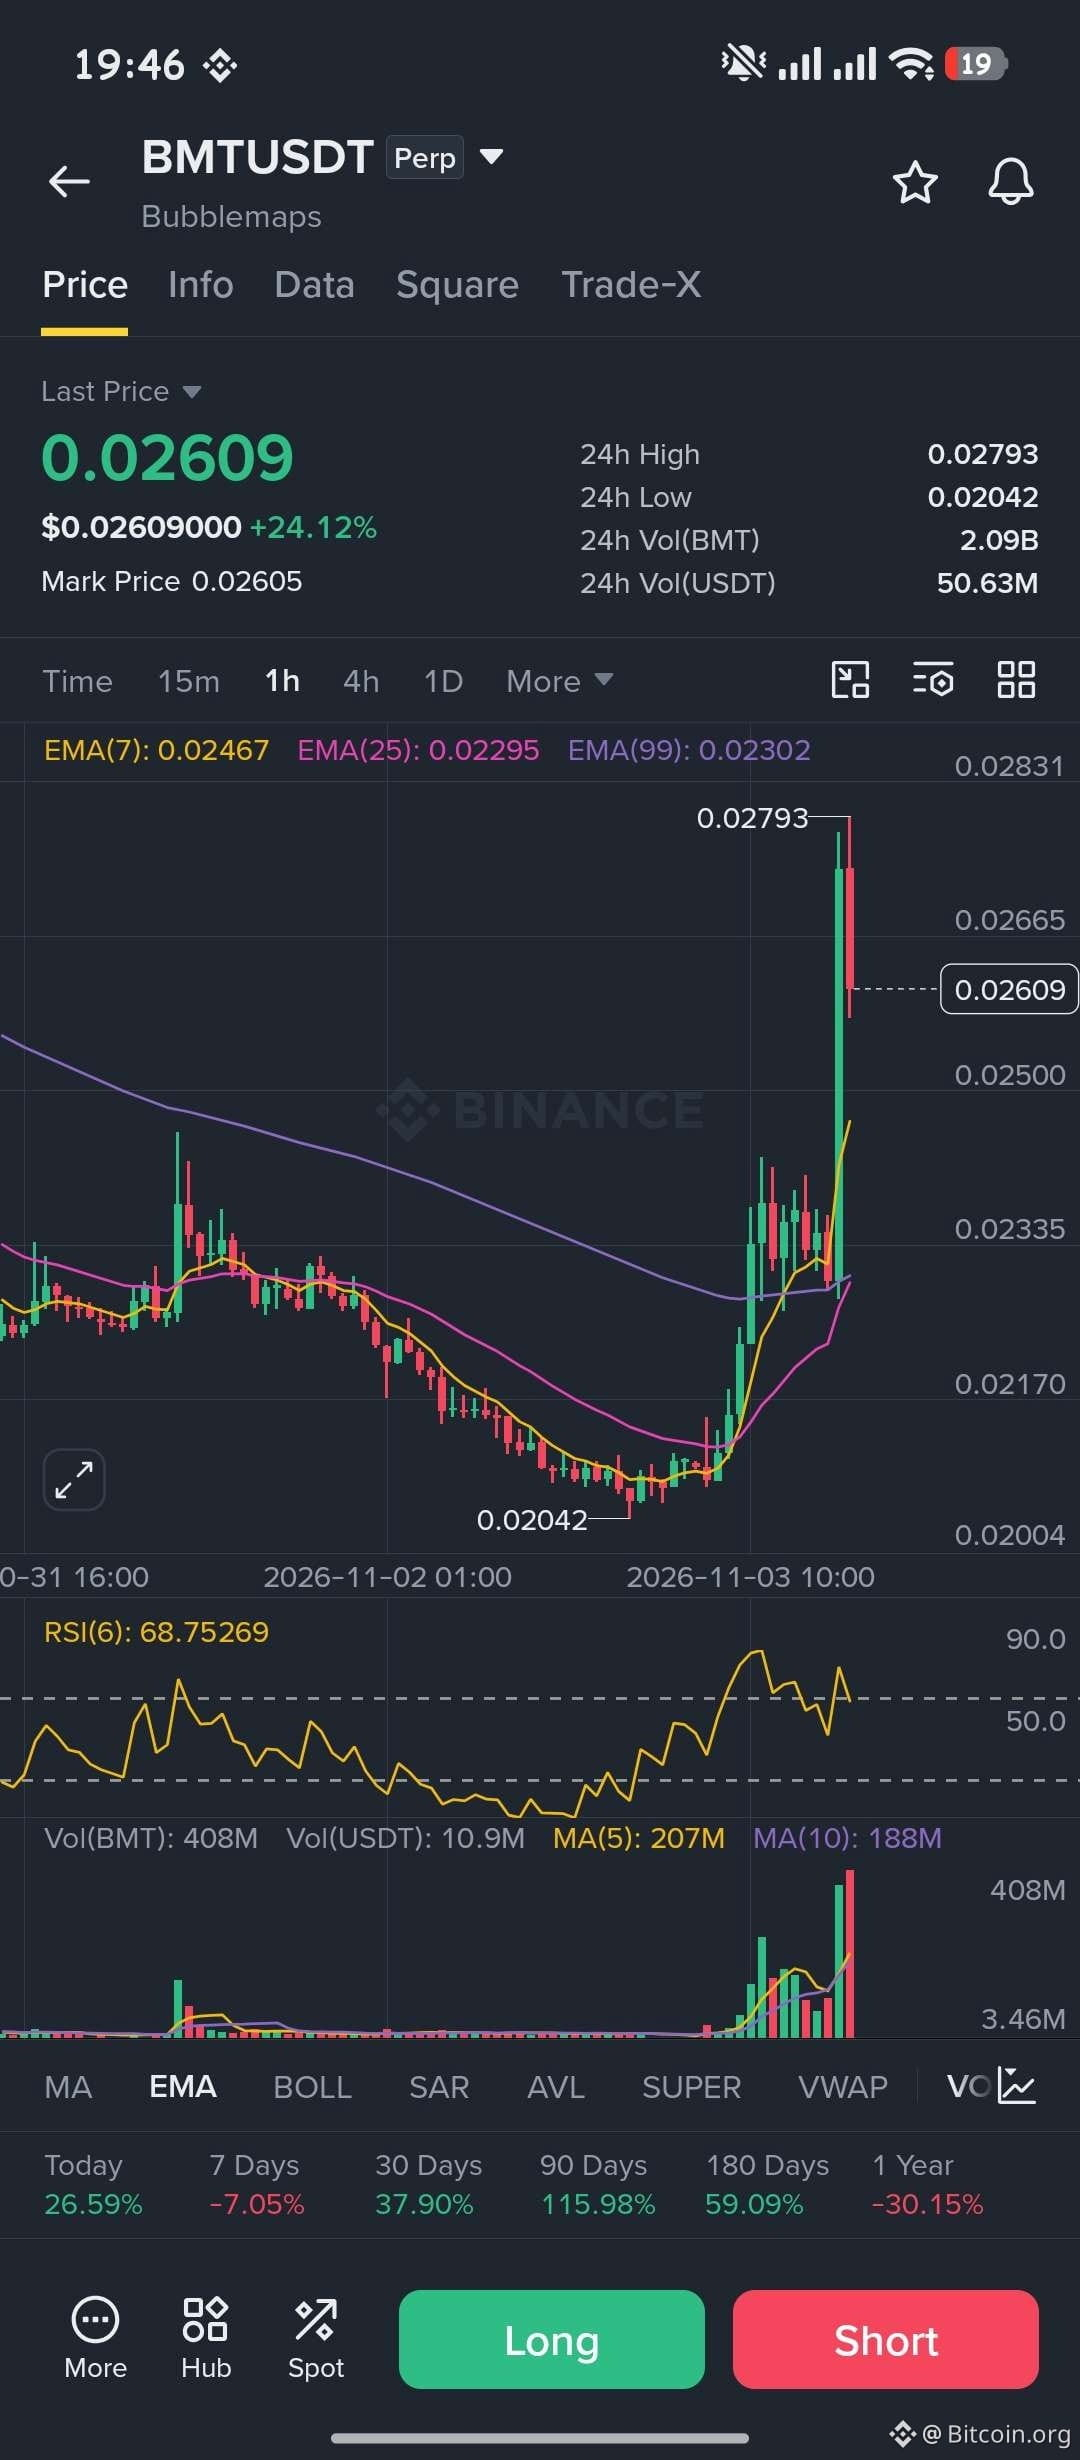
$BMT just broke out of a two day downtrend on the heaviest volume of the move.
Up 24.12% to 0.02609 after a low of 0.02042 and a high of 0.02793. Price ripped straight through the EMA(25) at 0.02295 and the EMA(99) at 0.02302, the exact zone that had capped every bounce on the way down.
The 1h volume bar printed 408M BMT against a MA(5) of 207M, the biggest bar on the chart. That's real size, not a thin wick. RSI(6) is at 68.75, strong but not stretched.
The first red candle is already at the top, so a pullback is normal. Holding above the EMA(7) at 0.02467 keeps it constructive.
7 day is still down 7.05%, so this is a bounce inside a bigger range. But 30 day is up 37.90% and 90 day is up 115.98%, and Bubblemaps is still the tool trenchers use to check rugpull risk and bundlers.
Reclaim 0.02793 and it's off to the next leg.
$BMT
Up 24.12% to 0.02609 after a low of 0.02042 and a high of 0.02793. Price ripped straight through the EMA(25) at 0.02295 and the EMA(99) at 0.02302, the exact zone that had capped every bounce on the way down.
The 1h volume bar printed 408M BMT against a MA(5) of 207M, the biggest bar on the chart. That's real size, not a thin wick. RSI(6) is at 68.75, strong but not stretched.
The first red candle is already at the top, so a pullback is normal. Holding above the EMA(7) at 0.02467 keeps it constructive.
7 day is still down 7.05%, so this is a bounce inside a bigger range. But 30 day is up 37.90% and 90 day is up 115.98%, and Bubblemaps is still the tool trenchers use to check rugpull risk and bundlers.
Reclaim 0.02793 and it's off to the next leg.
$BMT