
$AGT
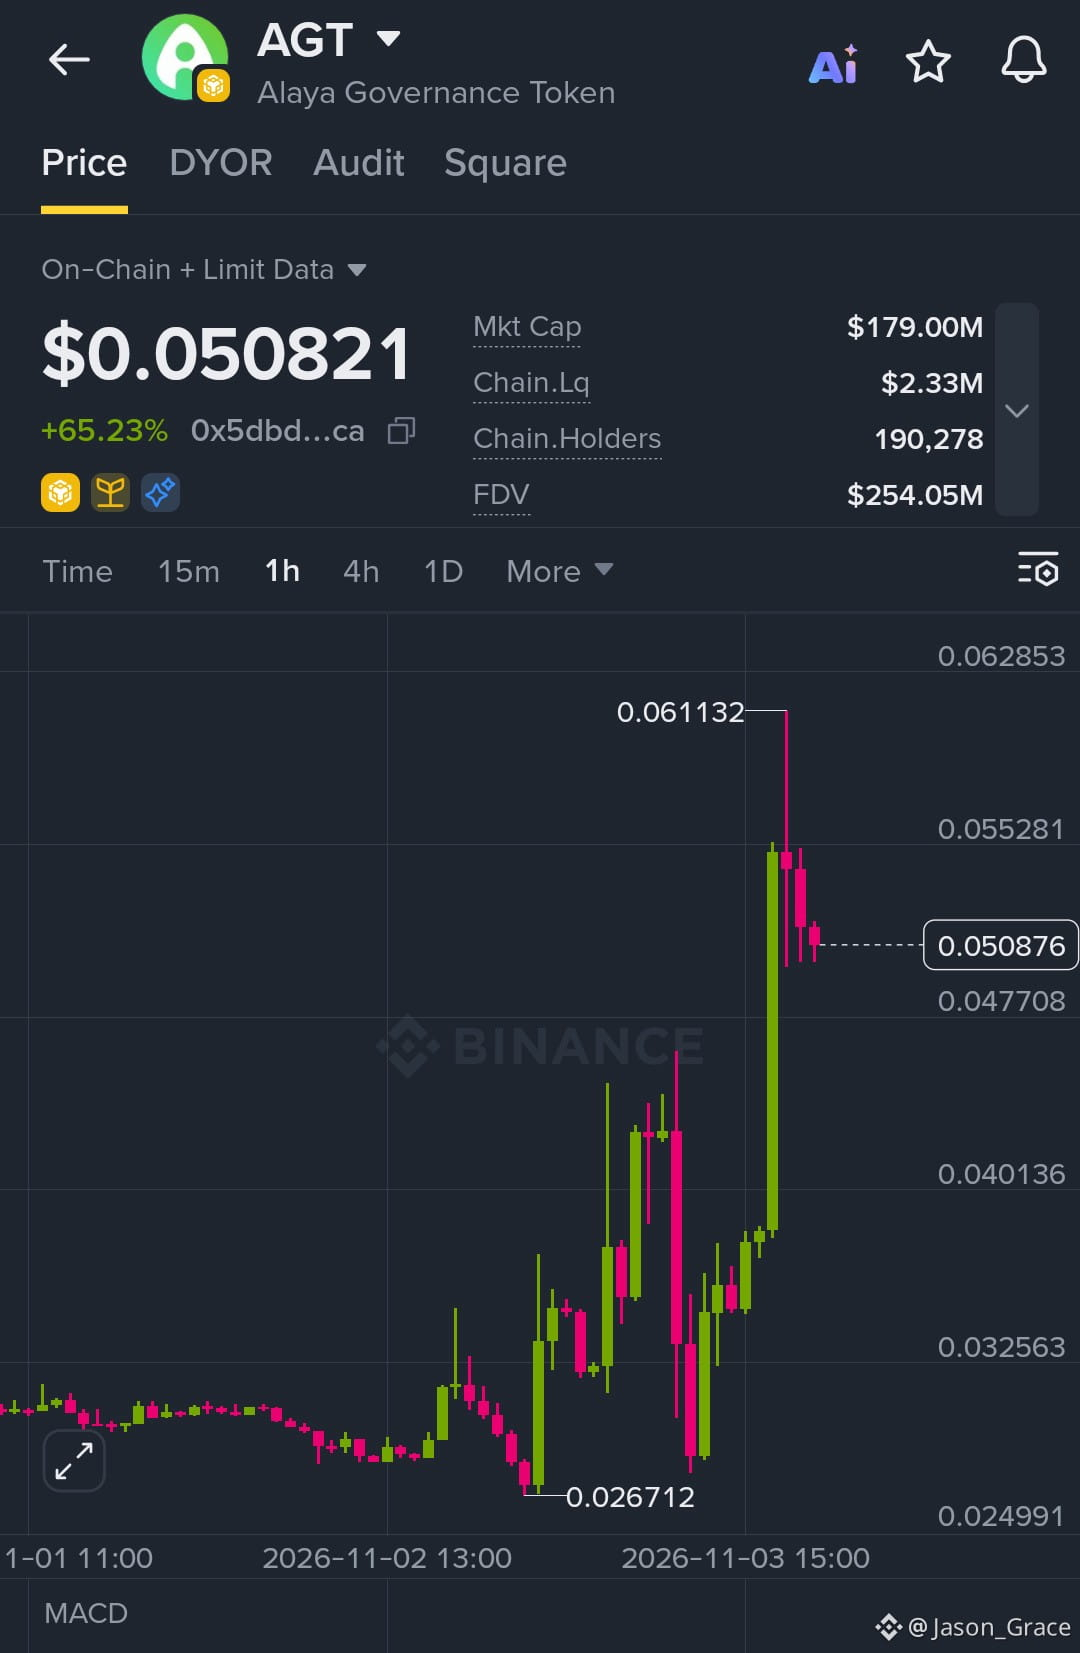
AGT is showing strong bullish momentum after an aggressive breakout on the 1-hour chart. Price surged from approximately $0.0267 to $0.0611, marking a major shift in short-term market structure. Currently trading near $0.0508 in the supplied chart, AGT is undergoing a healthy-looking pullback after its explosive rally.
Key Support Levels: $0.0477, $0.0450 and $0.0401.
Resistance Levels: $0.0553 and $0.0611.
Trade Setup: I am watching the $0.0490–$0.0510 zone for a potential bullish continuation, preferably after confirmation from buyers.
Upside Targets:
TP1: $0.0553
TP2: $0.0611
TP3: $0.0650
Stop Loss: $0.0465 (below the immediate support zone).
Market Sentiment: Bullish, but short-term profit-taking is visible after the sharp rally. A confirmed 1H close above $0.0553 could open the door toward a retest of $0.0611. However, a breakdown below $0.0477 would weaken the bullish structure and expose lower support.
My strategy is to wait for confirmation rather than chase an extended candle.
Not financial advice. DYOR.
$AGT
AGT is showing strong bullish momentum after an aggressive breakout on the 1-hour chart. Price surged from approximately $0.0267 to $0.0611, marking a major shift in short-term market structure. Currently trading near $0.0508 in the supplied chart, AGT is undergoing a healthy-looking pullback after its explosive rally.
Key Support Levels: $0.0477, $0.0450 and $0.0401.
Resistance Levels: $0.0553 and $0.0611.
Trade Setup: I am watching the $0.0490–$0.0510 zone for a potential bullish continuation, preferably after confirmation from buyers.
Upside Targets:
TP1: $0.0553
TP2: $0.0611
TP3: $0.0650
Stop Loss: $0.0465 (below the immediate support zone).
Market Sentiment: Bullish, but short-term profit-taking is visible after the sharp rally. A confirmed 1H close above $0.0553 could open the door toward a retest of $0.0611. However, a breakdown below $0.0477 would weaken the bullish structure and expose lower support.
My strategy is to wait for confirmation rather than chase an extended candle.
Not financial advice. DYOR.
$AGT