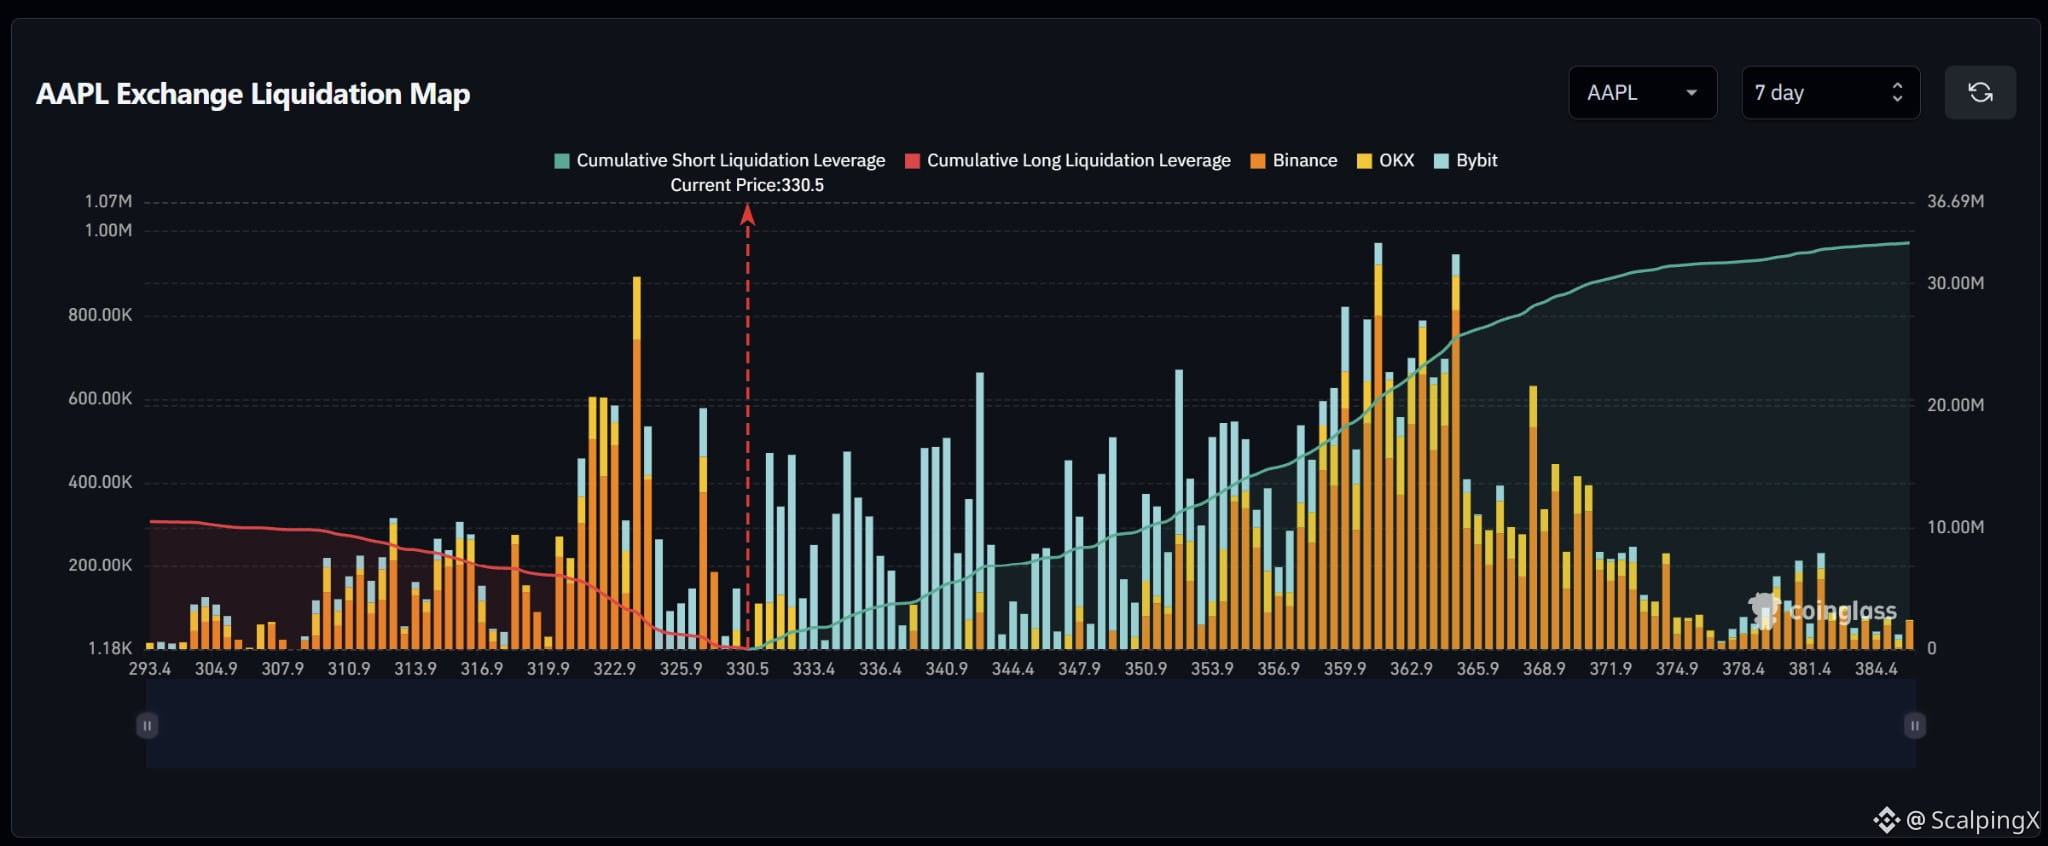
$AAPL – Liquidation Map (7 days) – Index ~330.5
🧭 The preferred scenario is an upside short sweep, starting at 331–333, then 335–337. Short clusters appear in succession, while nearby long exposure below price is more scattered. Estimated cumulative short liquidation exposure is roughly $33 million across the displayed range, more than three times the long side.
🔺 A break and hold above 333 after the initial sweep shifts attention to 335–337, then 340–343. The large bar near 342.5 stands out; short liquidations there could amplify the advance.
🎯 Holding above 343 would bring clusters at 348–355 into focus next. Farther up, the dense 358–366 band is particularly prominent around 360–365. Beyond 372, bars become noticeably smaller and more scattered, making continuation worth reassessing after the main band is swept.
⚖️ Losing 329 without a reclaim would weaken the upside scenario and shift attention to long clusters at 327.5–328.5, then 322–325. The bar near 324 is the most prominent below price. Avoid chasing a sweep of 340–343 that quickly reverses below 340.
#LiquidationMap
🧭 The preferred scenario is an upside short sweep, starting at 331–333, then 335–337. Short clusters appear in succession, while nearby long exposure below price is more scattered. Estimated cumulative short liquidation exposure is roughly $33 million across the displayed range, more than three times the long side.
🔺 A break and hold above 333 after the initial sweep shifts attention to 335–337, then 340–343. The large bar near 342.5 stands out; short liquidations there could amplify the advance.
🎯 Holding above 343 would bring clusters at 348–355 into focus next. Farther up, the dense 358–366 band is particularly prominent around 360–365. Beyond 372, bars become noticeably smaller and more scattered, making continuation worth reassessing after the main band is swept.
⚖️ Losing 329 without a reclaim would weaken the upside scenario and shift attention to long clusters at 327.5–328.5, then 322–325. The bar near 324 is the most prominent below price. Avoid chasing a sweep of 340–343 that quickly reverses below 340.
#LiquidationMap