ACT Breaks Down From Descending Triangle on 1D: Baseline Retest Unlocks Trend-Following Short Toward 0.0046 USD?
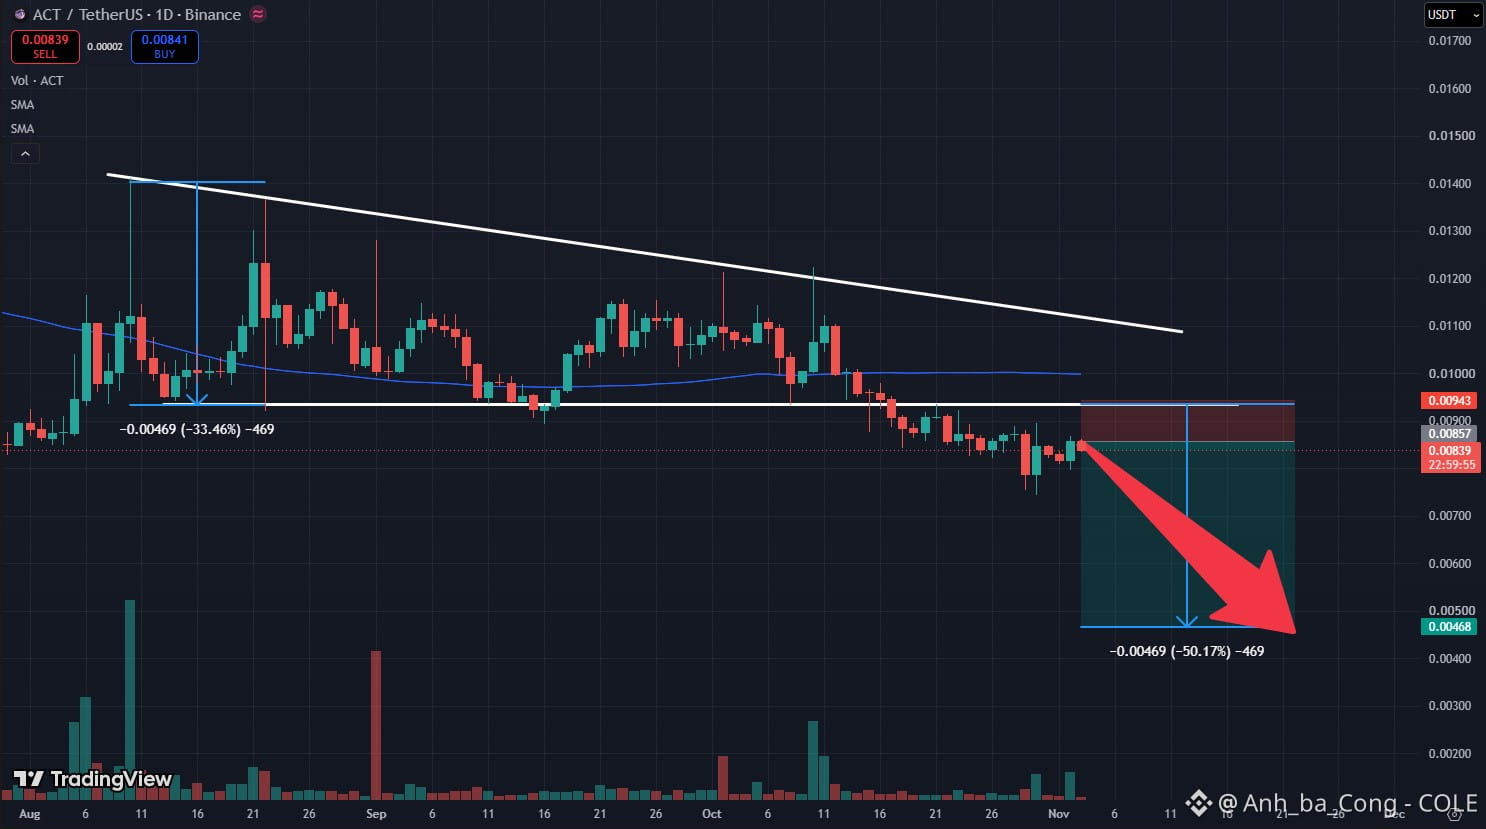
ACT on the daily (1D) timeframe has triggered a decisive bearish continuation signal by officially breaking beneath the horizontal support baseline of a macro descending triangle established since August. The breakdown of this consolidation structure marks complete seller dominance following months of persistent compression under the downward-sloping diagonal resistance ceiling.
Following the structural flush below the 0.0093 USD demand floor, price action delivered a shallow relief retest toward the newly flipped support-turned-resistance zone. Examining the active daily candle hovering near 0.00839 USD, upward momentum shows visible exhaustion, heavily capped beneath the dynamic moving average baseline and broken horizontal shelf. Trading volume on this corrective bounce has contracted dramatically, confirming that high-level buying sponsorship is completely absent. Former primary support has cleanly transitioned into formidable overhead supply, priming the asset for another aggressive distribution impulse.
This exhausted retest unlocks an asymmetric trend-continuation Short opportunity featuring an outstanding risk-to-reward ratio. The measured-move downside target calculated from the triangle's height (-50.17%) points directly toward the 0.00468 USD floor. Downside exposure is strictly managed by placing a disciplined stop-loss cleanly above the broken baseline at 0.00943 USD for capital preservation.
DYOR $ACT
ACT on the daily (1D) timeframe has triggered a decisive bearish continuation signal by officially breaking beneath the horizontal support baseline of a macro descending triangle established since August. The breakdown of this consolidation structure marks complete seller dominance following months of persistent compression under the downward-sloping diagonal resistance ceiling.
Following the structural flush below the 0.0093 USD demand floor, price action delivered a shallow relief retest toward the newly flipped support-turned-resistance zone. Examining the active daily candle hovering near 0.00839 USD, upward momentum shows visible exhaustion, heavily capped beneath the dynamic moving average baseline and broken horizontal shelf. Trading volume on this corrective bounce has contracted dramatically, confirming that high-level buying sponsorship is completely absent. Former primary support has cleanly transitioned into formidable overhead supply, priming the asset for another aggressive distribution impulse.
This exhausted retest unlocks an asymmetric trend-continuation Short opportunity featuring an outstanding risk-to-reward ratio. The measured-move downside target calculated from the triangle's height (-50.17%) points directly toward the 0.00468 USD floor. Downside exposure is strictly managed by placing a disciplined stop-loss cleanly above the broken baseline at 0.00943 USD for capital preservation.
DYOR $ACT