$ENA: Understanding Liquidity Through ENA’s Volume Spike
When a token shows higher than usual trading activity, the most direct lens is liquidity. Think of a market as a busy highway: liquidity is the number of lanes that let cars (orders) move smoothly. If only a single lane exists, a sudden surge of traffic creates a jam, causing price to swing sharply. More lanes – deeper liquidity – let the same surge spread across many participants, keeping price changes modest.
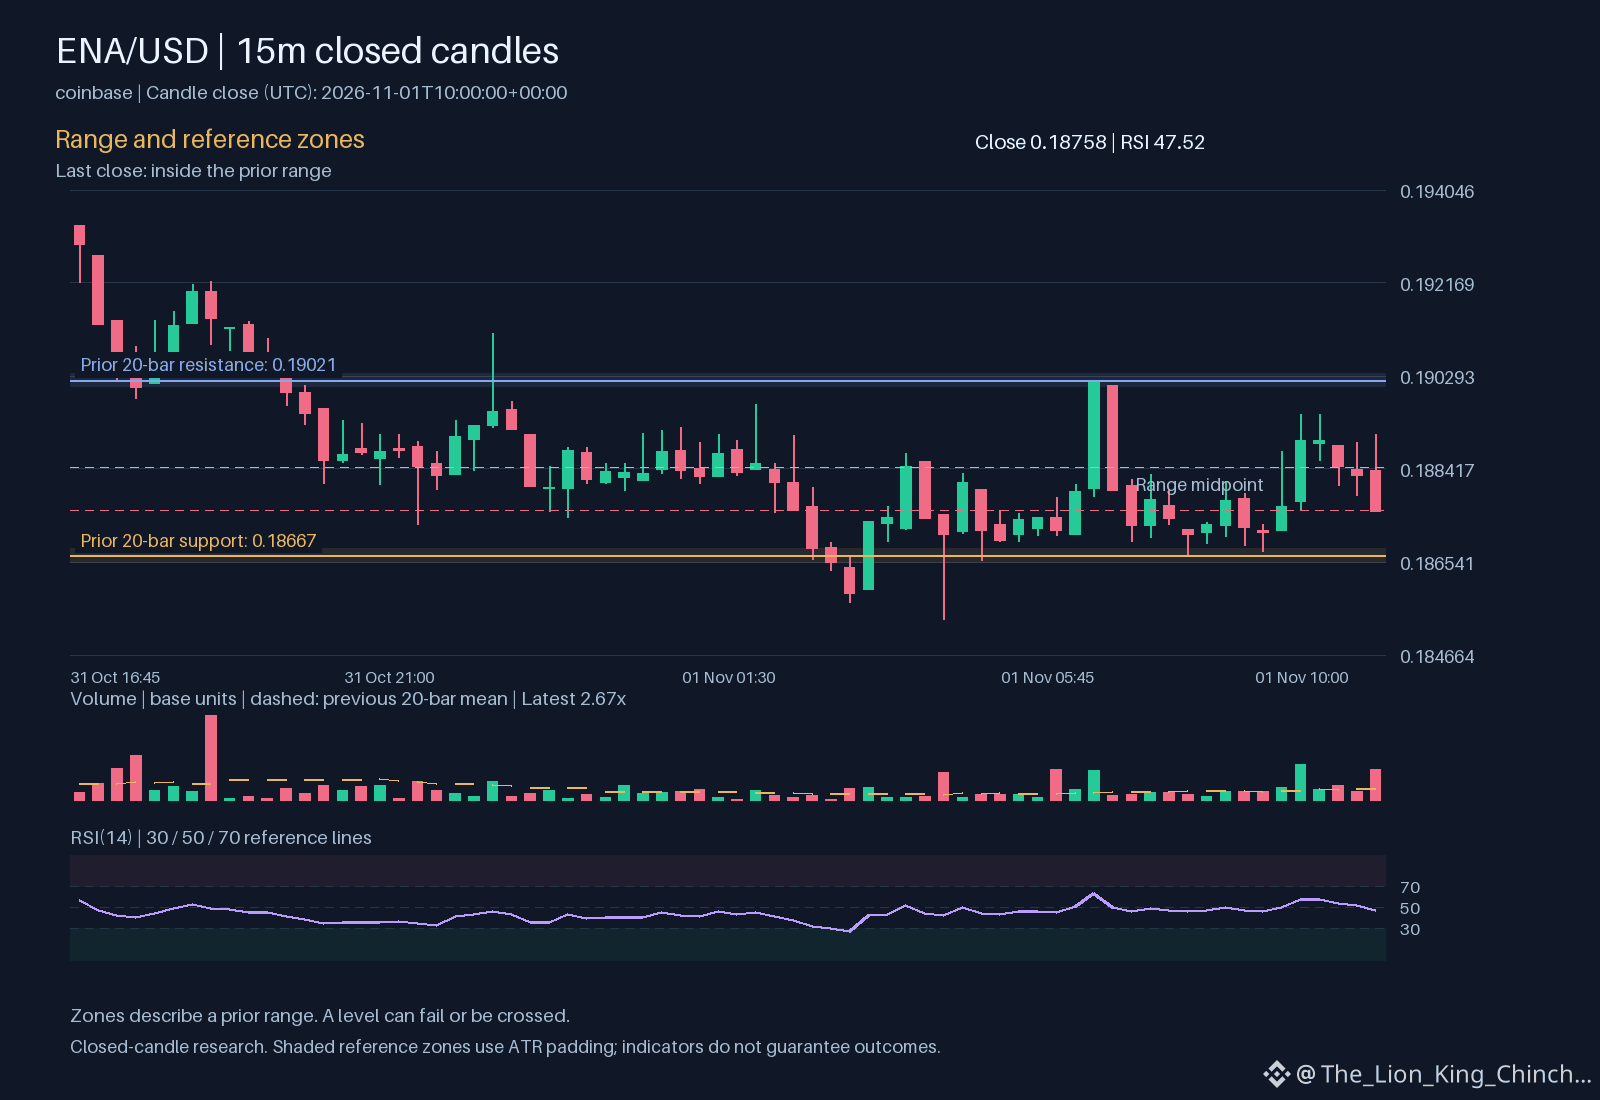
In the recent ENA chart the hourly direction is down while volume sits above baseline. This scenario is a practical illustration of the liquidity concept. The price decline represents cars trying to exit the highway, while the elevated volume adds more cars entering from side streets. If ENA’s order book holds many limit orders close to the current price, the extra cars can merge into traffic without forcing a sudden stop. Conversely, a thin order book would act like a narrow bridge, and the same influx could push the price lower than the underlying sentiment suggests.
To apply this insight, traders can compare the observed relative volume 2.67492 with the recent VWAP 0.190034. A VWAP that remains stable despite a volume surge hints at sufficient liquidity, while a diverging VWAP signals that price may be moving away from true market depth. Re‑assessing ENA with this simple liquidity check helps separate a genuine trend from a temporary imbalance.
Probabilistic market research, not a recommendation or guaranteed return.
Which crypto concept becomes clearer when you look at an actual chart?
#ENA #CryptoEducation #CryptoLearning