🚨 S&P 500: Is a Major Correction Coming?
The weekly chart is showing some warning signs that investors shouldn't ignore.
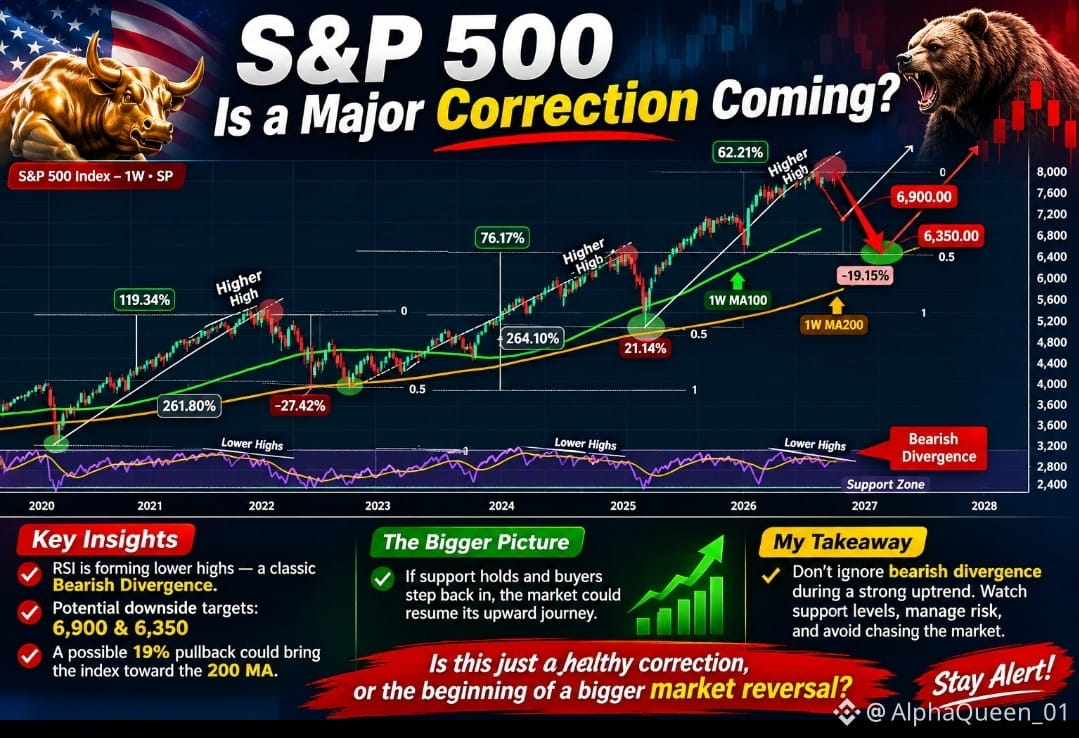
The S&P 500 continues to print higher highs, but the RSI is forming lower highs — a classic Bearish Divergence.
Here’s what the chart suggests:
📉 6,900 – First potential downside target.
📉 6,350 – Major support zone and a possible deeper correction.
📊 A potential 19% pullback could bring the index toward its long-term moving average support.
However, the bigger bullish trend isn't necessarily over. If support holds and buyers step back in, the market could resume its upward journey toward new highs.
My takeaway: Don't ignore bearish divergence during a strong uptrend. Watch support levels, manage risk, and avoid chasing the market at the top.
Is this just a healthy correction, or the beginning of a bigger market reversal?
#SP500 #StockMarket #Trading #MarketAnalysis #Investing