$INTWB
🚨 INTW DOWN ALMOST 63% — THIS WASN'T JUST A NORMAL CRYPTO DUMP!
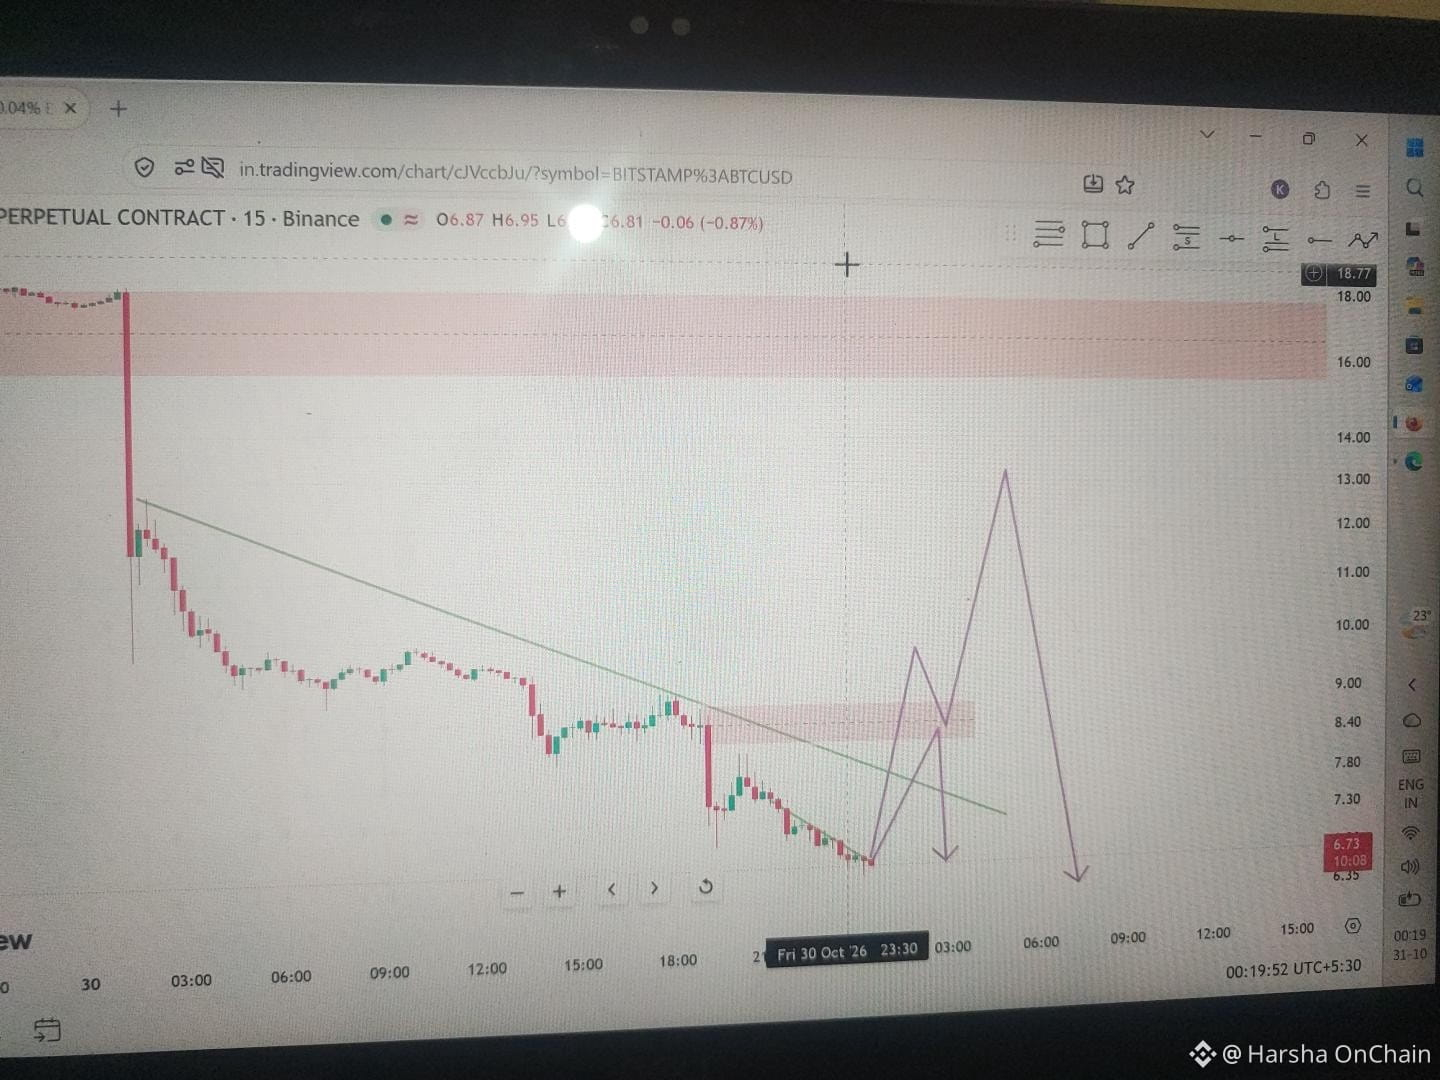
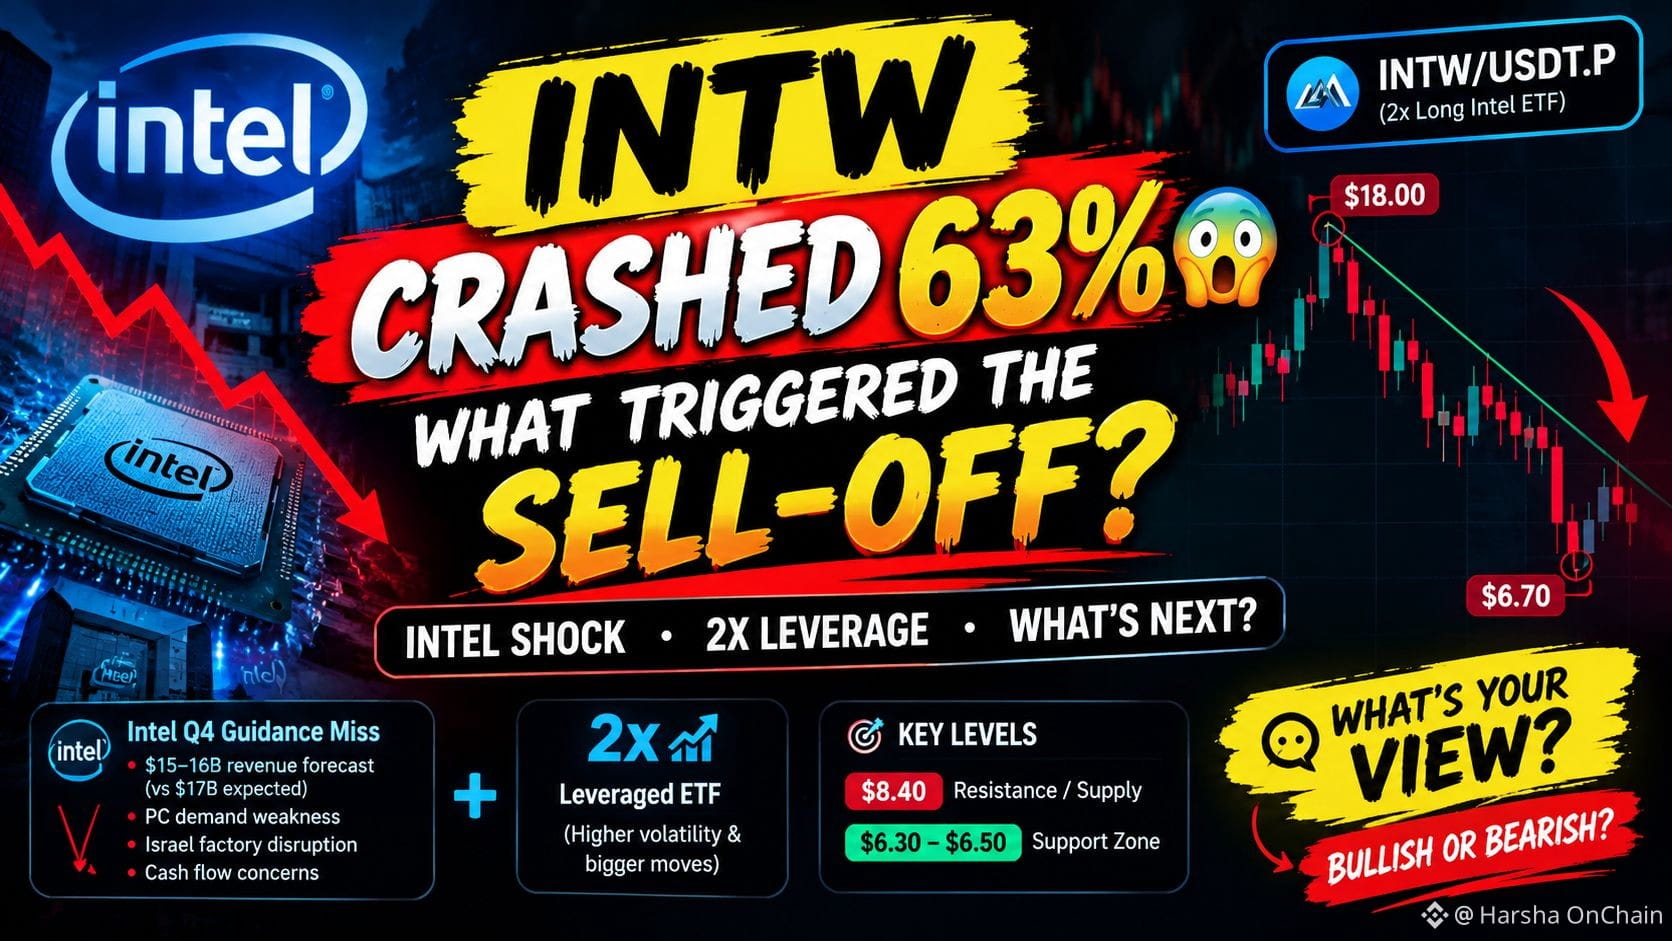
From nearly $18 to around $6.7 on the chart. What triggered this brutal sell-off?
Here's the interesting part. 👇
INTW is linked to the GraniteShares 2x Long Intel (INTC) Daily ETF, not a traditional crypto token.
📉 WHAT TRIGGERED THE SELL-OFF?
🔴 Intel delivered a disappointing Q4 outlook.
🔴 Weak PC demand is creating pressure.
🔴 An Israeli factory disruption added manufacturing concerns.
🔴 Investors reacted aggressively to the weaker forward guidance.
And because INTW tracks a 2x daily leveraged Intel ETF, the underlying stock's sharp fall can create an amplified move.
🎯 WHAT I'M WATCHING ON THE CHART
The structure is still bearish:
- Lower highs and lower lows.
- Descending trendline remains a hurdle.
- $8.40 area is an important resistance zone.
- $6.30–$6.50 is the immediate reaction area.
🟢 Bullish possibility: A liquidity sweep followed by a strong reclaim could create a relief bounce.
🔴 Bearish possibility: Failure to hold the current zone could expose price to further downside.
⚠️ Remember: This is a leveraged TradFi perpetual contract. Volatility, funding and leverage can make the risk much higher.
NOW I'M CURIOUS ABOUT YOUR VIEW! 👇
After a nearly 63% correction, what comes next?
1️⃣ Relief bounce and short squeeze?
2️⃣ Another breakdown before recovery?
Don't just vote. Tell me WHY!
#INTW #Intel #TradFi #TradingAnalysis #BinanceSquare